The interactive chart is available on larger screens
Please open this page on a desktop to try it out
Key features of Individual velocity chart
The Individual velocity chart provides a detailed view of each team member’s performance on Scrum boards. It tracks key metrics such as initial and final commitments, rollover work, completed work, and not completed work, providing team leads and managers insight into individual contributions, workload balance, and potential bottlenecks.
You can choose one or multiple Jira boards, select a time interval, and pick the grouping mode - either sprints by user or users by sprint. The chart enables you to drill down into each sprint or assignee to view detailed metrics, with flexible options to configure the estimation field (Story Points, Issue Count, or other numeric fields) and apply user-defined filters. Advanced settings let you switch between Bar, Line, and Stacked Bar charts, add target lines for goal tracking, and customize the chart to highlight trends and individual performance patterns.
Since Jira does not provide a native Individual velocity chart that shows user-level commitments versus completion, supports rollover tracking, or allows flexible visualization and filtering, our Agile Velocity Chart Gadget fills the gap - delivering per-user velocity, interactive drill-downs, advanced filtering, and customizable chart types directly on the Jira dashboard.
How different roles use Velocity chart per user
🧑💼 Team Leads / Scrum Masters – check how each person is doing to spot who's overloaded or stuck. They examine aspects such as the amount of work completed versus deferred to the next sprint, then use this information to help individuals improve and plan more effective sprints.
📊 Project Managers – need to know if the team can actually hit their deadlines. They compare what each person delivers against what was expected, so they can adjust plans before things go off track.
👨💻 Developers / Team Members – gain visibility into their own productivity and workload distribution. Individual velocity metrics help them recognize their strengths, identify areas for improvement, and track progress toward individual or team objectives.
🛠 Agile Coaches – look at the big picture across multiple sprints and the whole team. They're hunting for patterns that reveal where processes are breaking down, so they can suggest practical fixes that actually help the team work more effectively.
Unlock per-user insights and track team performance effortlessly with the INDIVIDUAL VELOCITY CHART
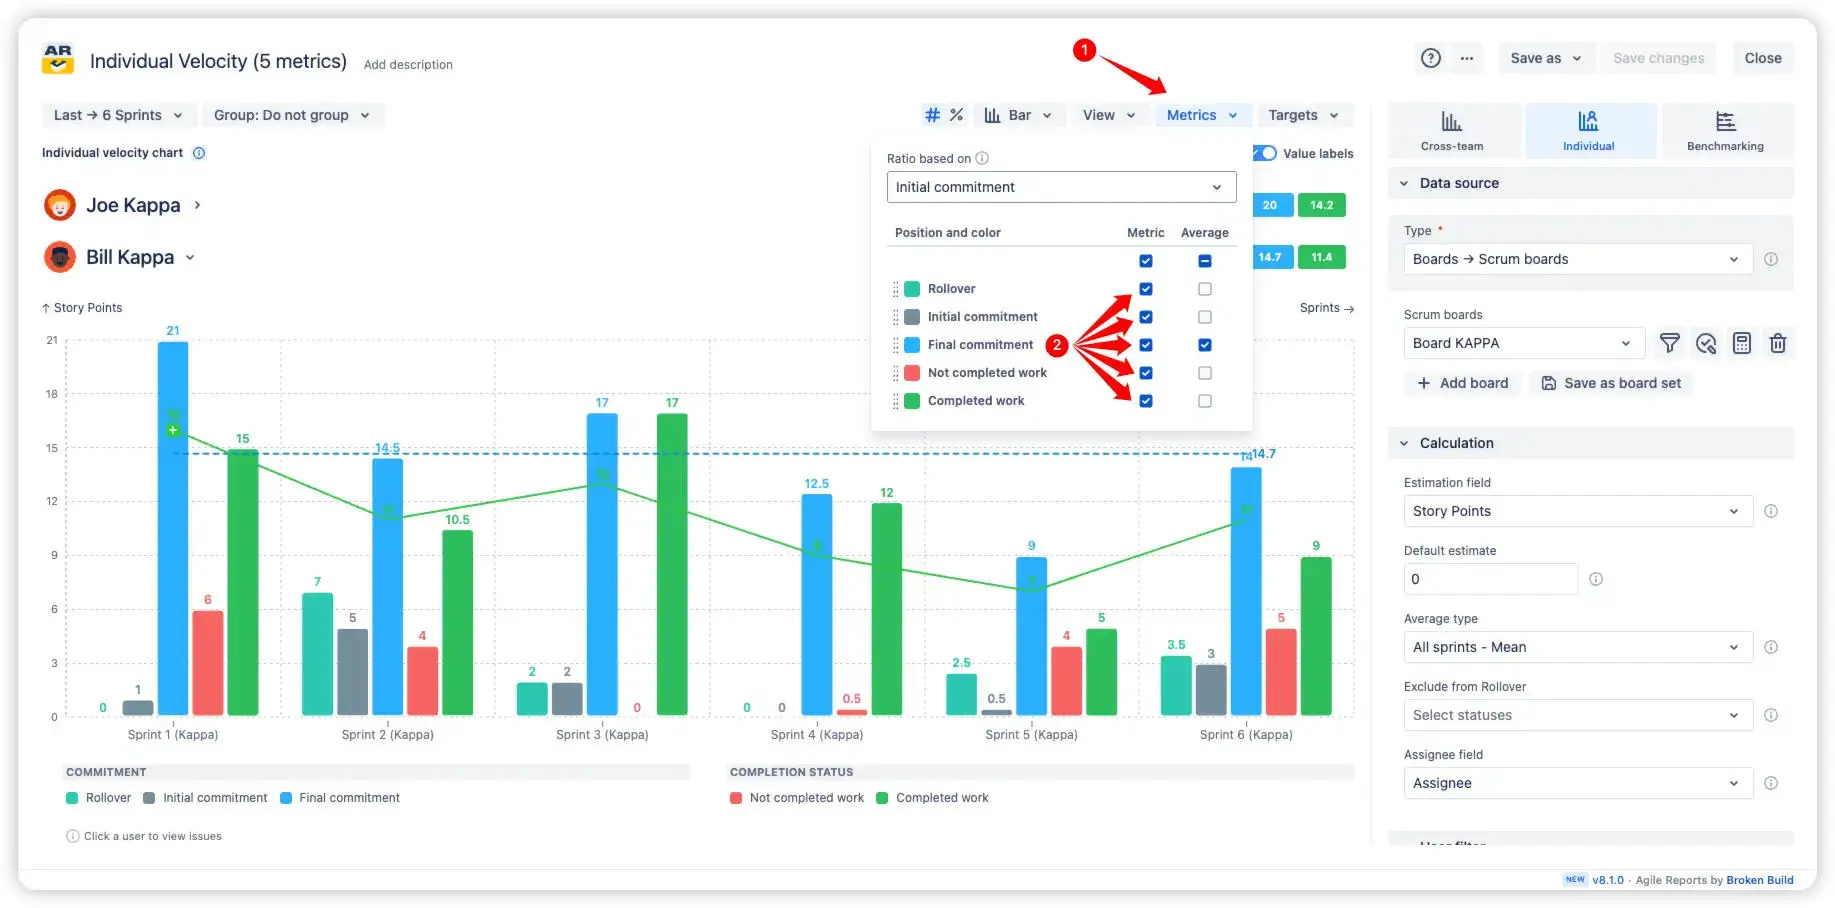
The Jira Individual velocity chart provides five essential metrics for each user on Scrum boards:
Initial Commitment – work items assigned to a user at the start of a sprint.
Final Commitment – work items assigned to a user at the end of a sprint.
Rollover – work items not completed in the previous sprint and carried over.
Not Completed Work – work items a user did not finish during the sprint.
Completed Work – work items successfully delivered during the sprint.
These metrics help you understand each team member’s performance, identify patterns, and spot bottlenecks. It’s a powerful tool for team leads and managers who need deeper insight into individual contributions.
💡 Pro tip: Click the “Metrics” button 1️⃣ in the top-right corner, then use the checkboxes 2️⃣ to show or hide any metric on the chart instantly.
“Metrics“ form on the Individual velocity chart in Jira dashboard
The Scrum individual velocity chart offers two flexible ways to visualize the data:
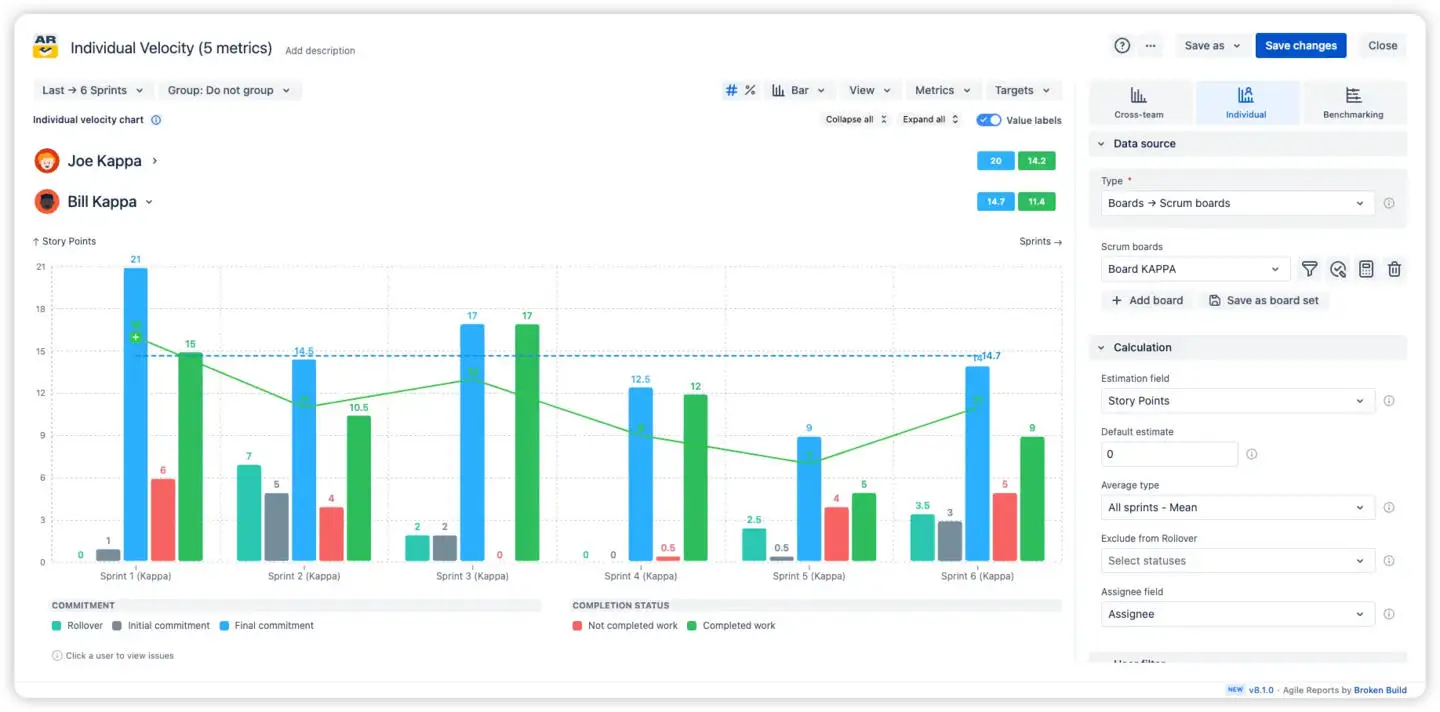
Group sprints by user
The Velocity chart per user shows assignees, each with two summary metrics: average final commitment and average completed work for the selected period.
Expanding an assignee displays their sprint-by-sprint breakdown over the chosen timeline.
Scrum individual velocity grouped by users
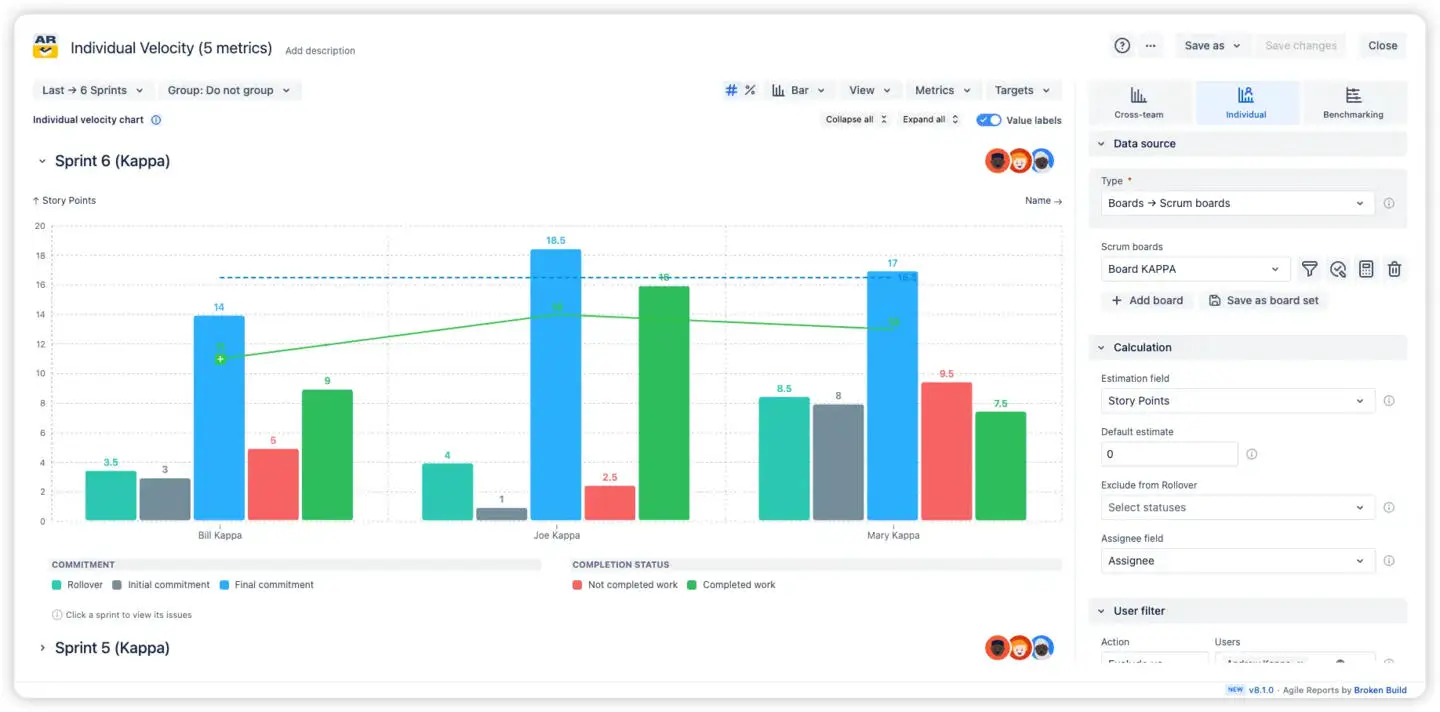
Group users by sprint
The chart shows sprints in a collapsed view.
Expanding a sprint reveals each user’s performance and metrics within that sprint.
Individual velocity per user, grouped by sprints
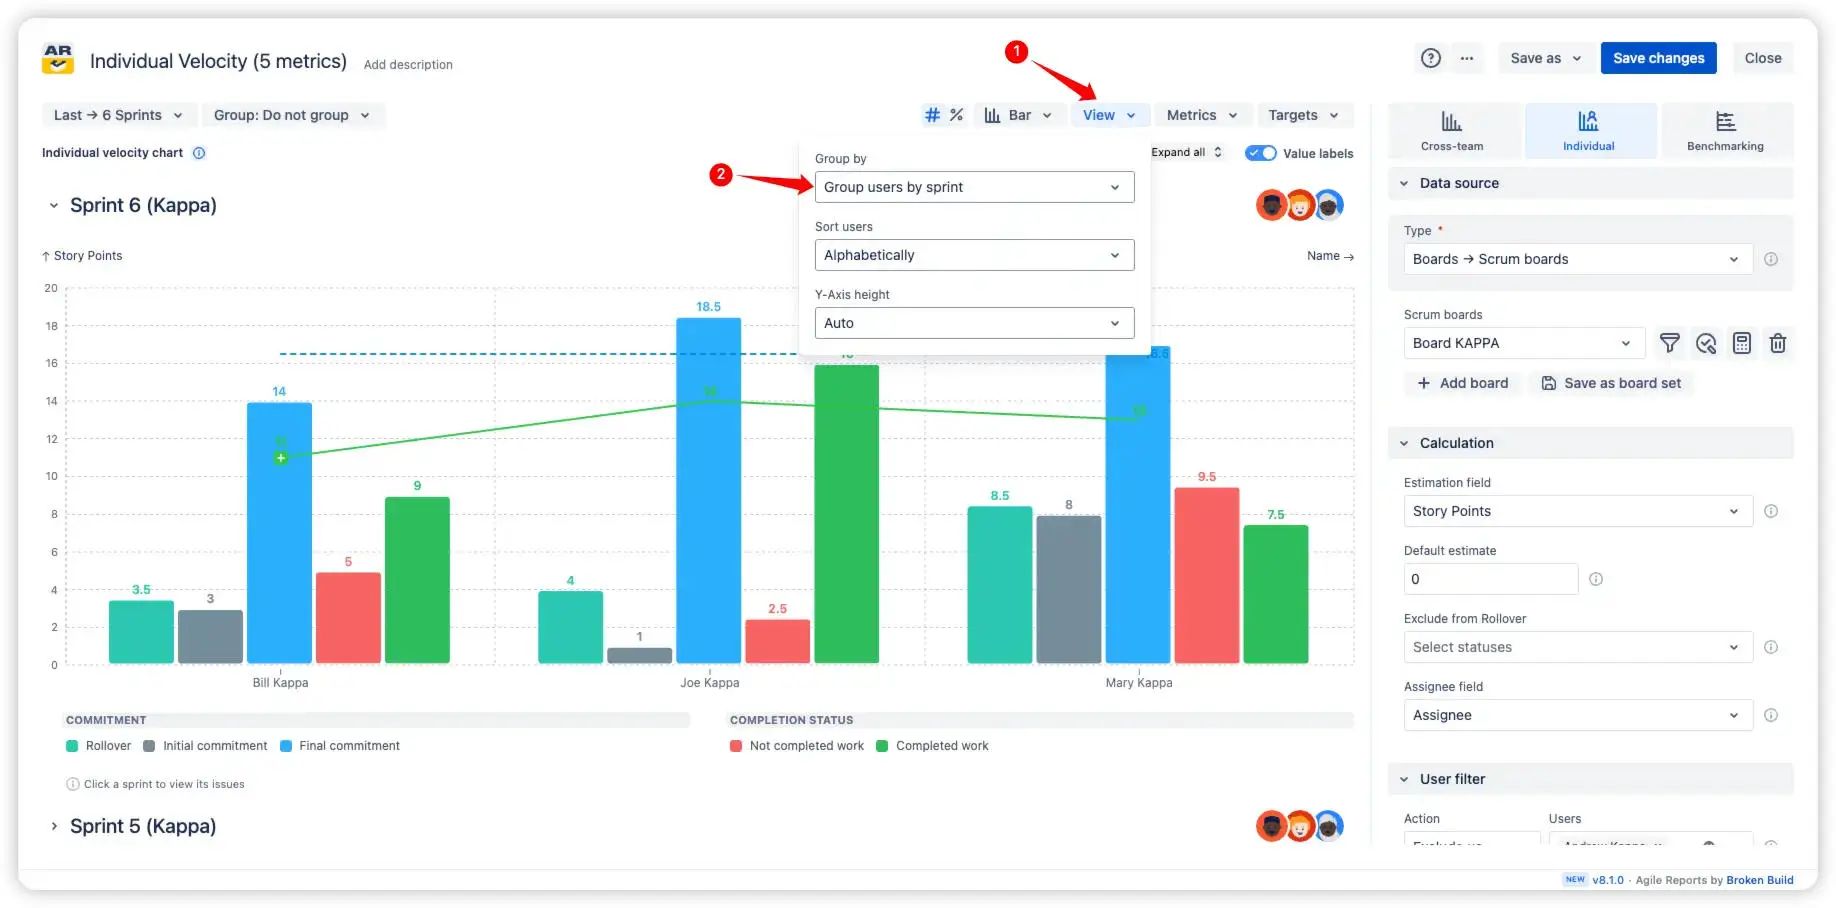
To switch perspectives, click the “View” button 1️⃣ and select the preferred option from the dropdown 2️⃣.
These two perspectives let you switch seamlessly between analyzing individual trends over time and team performance within a single sprint.
“View“ form on the Velocity chart per user in Jira
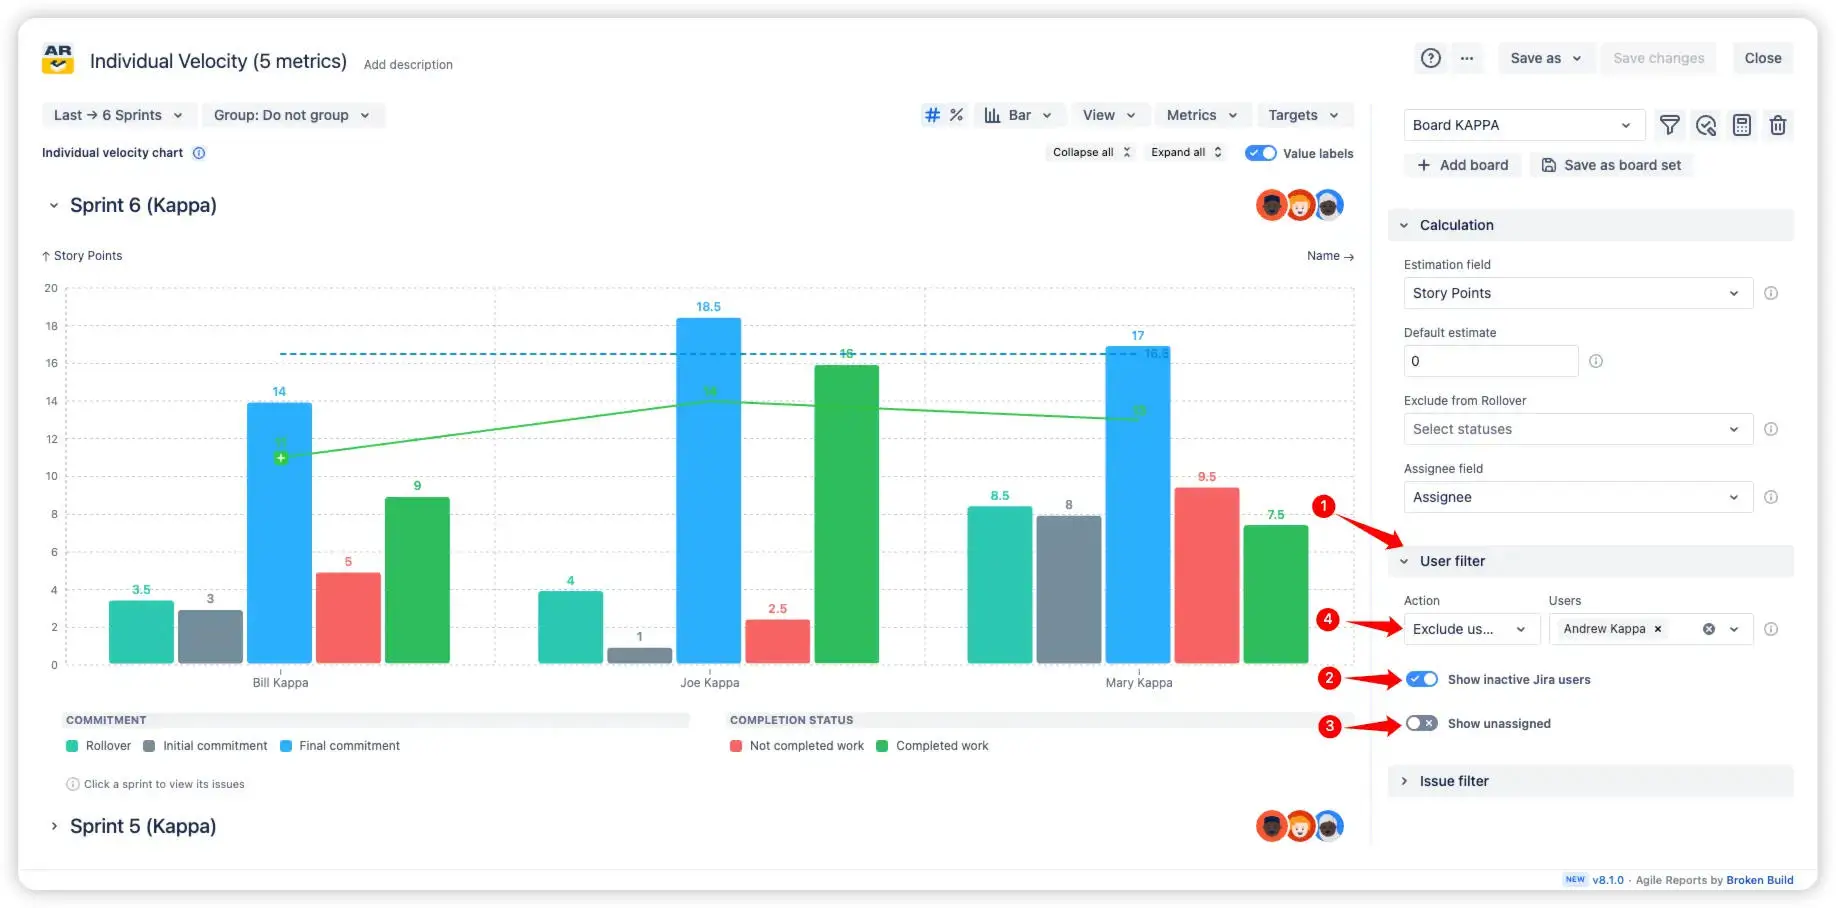
3. Key feature: User filter
The User Filter 1️⃣ in the right sidebar lets you control exactly whose work shows up on your Individual velocity report chart gadget. You can show or hide work items assigned to inactive users 2️⃣ or unassigned issues 3️⃣ by toggling the corresponding switches. The filter lets you define which users should be displayed or excluded. Switch the dropdown between 'Include' and 'Exclude' 4️⃣ to adjust the view according to your needs, ensuring the chart reflects only the users and data that matter to your analysis.
User filter on theIndividual velocity report in Jira
Additional features of Individual velocity chart
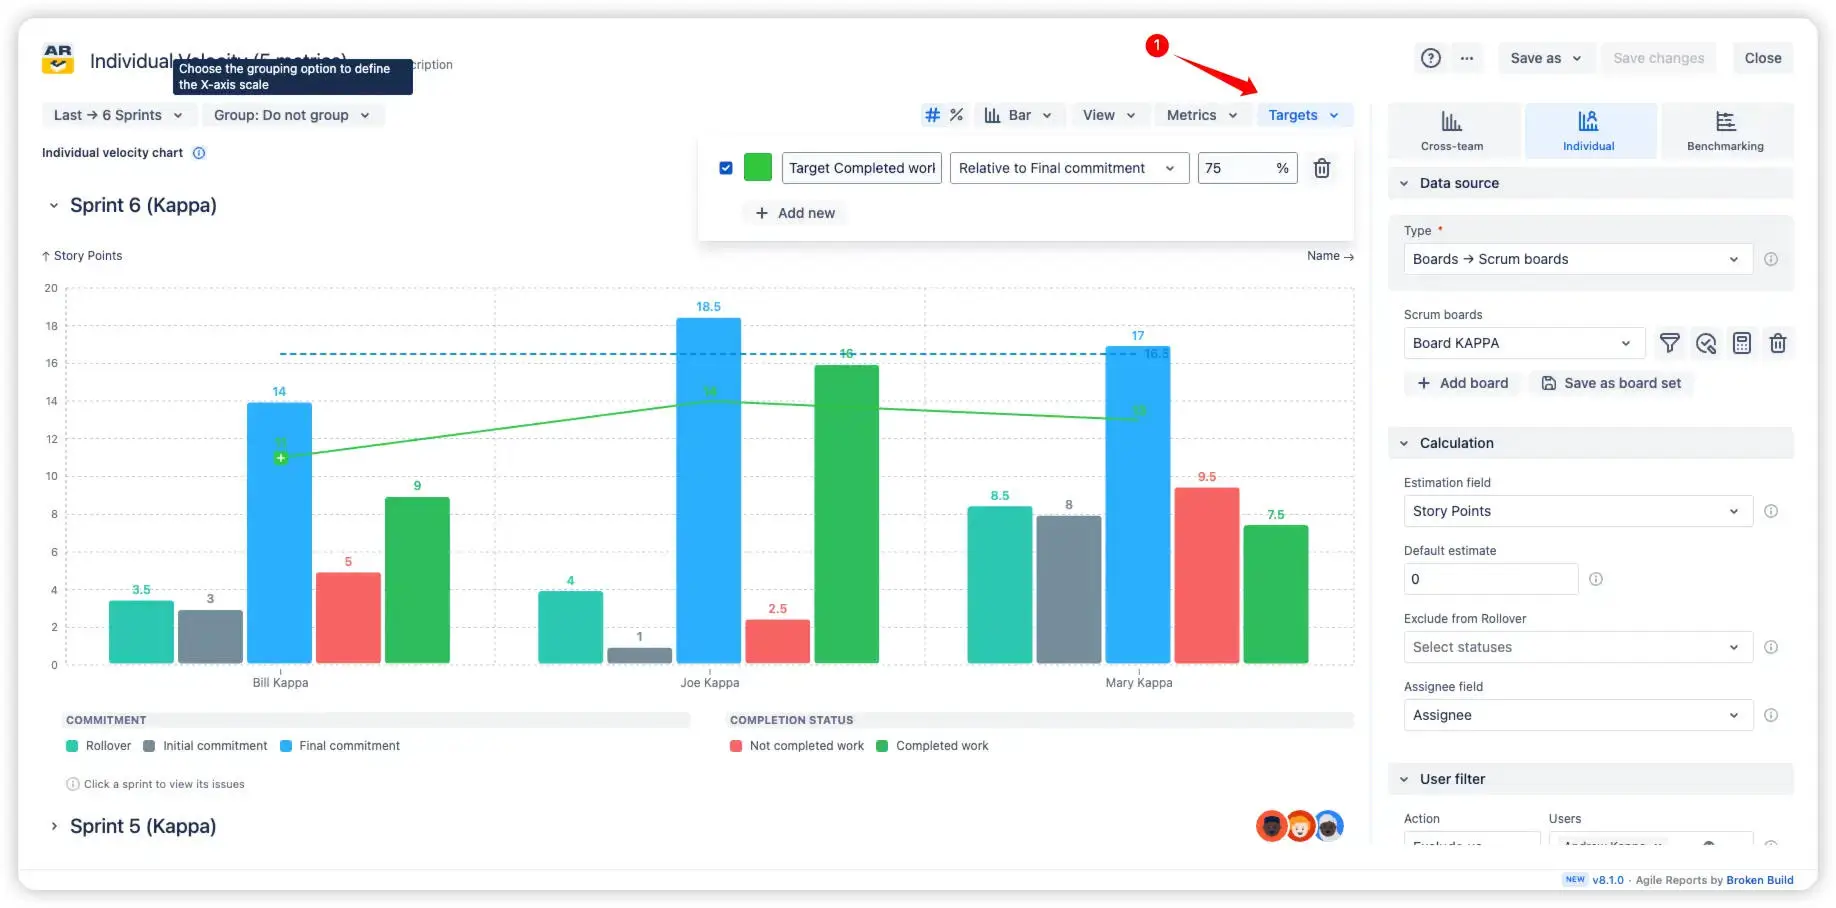
1. Target Lines
Keep your team on track by adding target lines directly to the Velocity chart per user. You can set absolute targets or relative targets - for example, completing 75% of the initial sprint commitment. Relative targets can be based on either the initial or final commitment, providing you with the flexibility to plan before the sprint begins or track progress in real-time. With a quick setup, you can instantly see how actual results compare to your goals and make informed decisions to maintain or improve performance.
Target lines form on the Individual velocity report in Jira dashboard
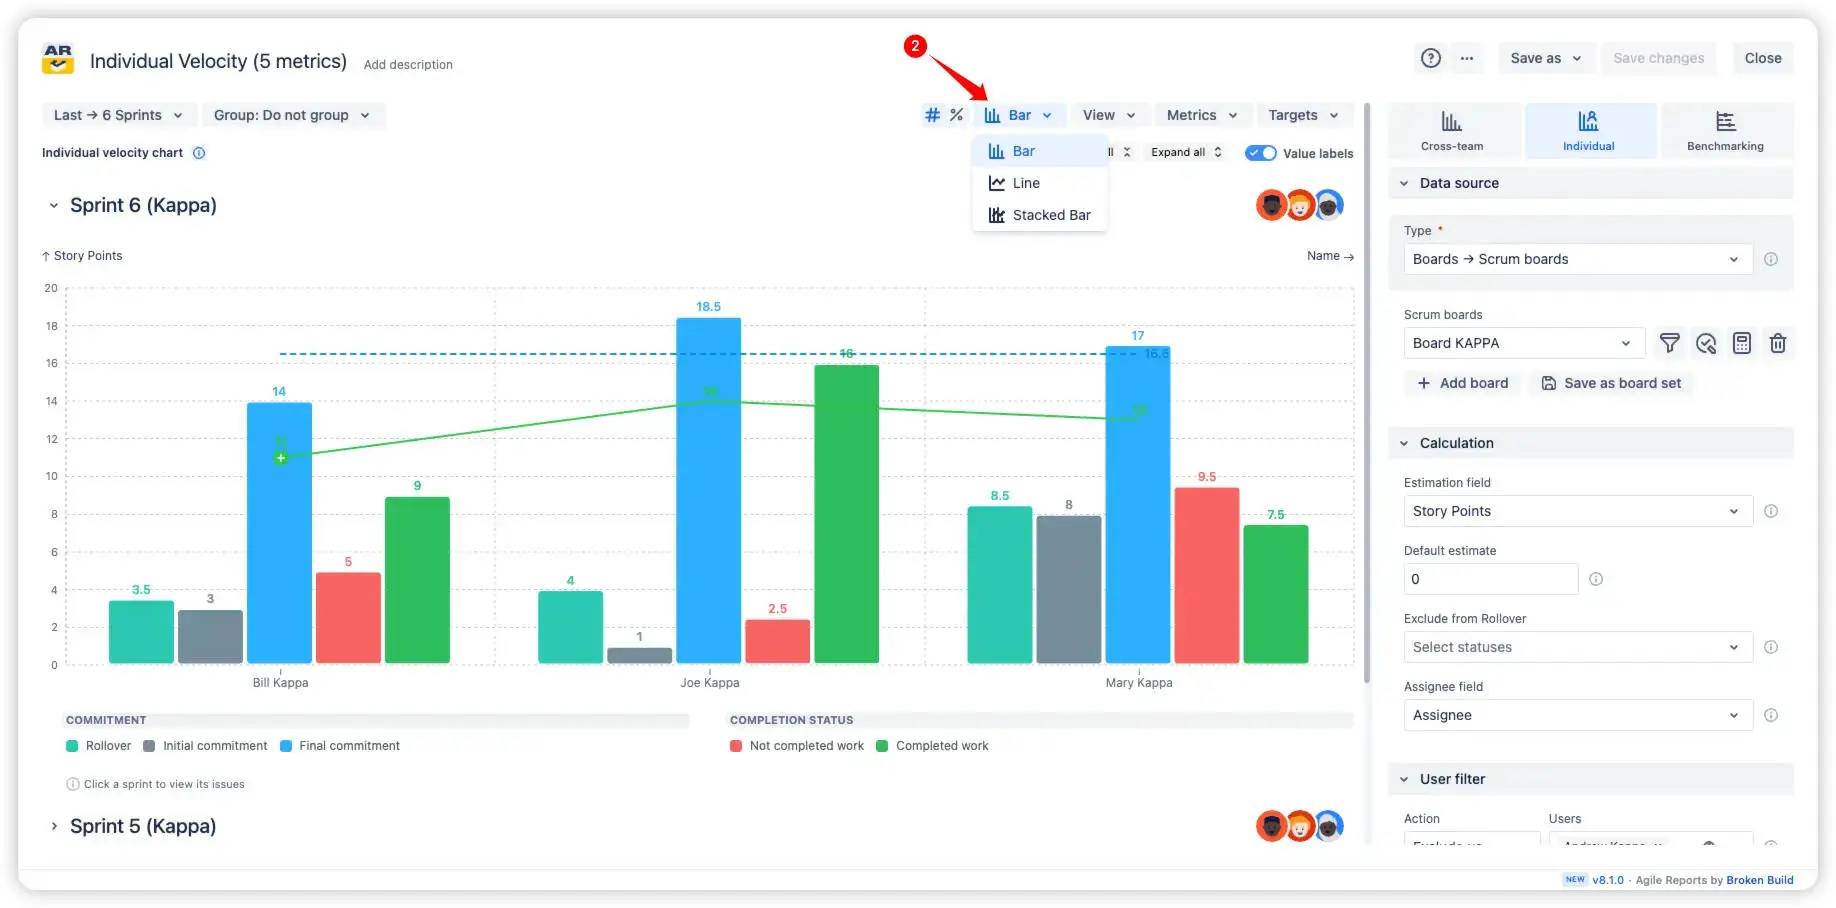
2. Flexible Individual velocity chart types
Choose the visualization that best fits your analysis by switching instantly between Bar, Line, and Stacked Bar charts. Bar charts make it easy to compare values interval by interval, line charts highlight trends and long-term patterns, and stacked bars show how multiple metrics combine - for example, completed work versus unfinished or rolled-over items. This flexibility ensures you always get the clearest view of your team’s performance.
Chart type form on the Individual velocity report chart gadget
What about native Jira Individual velocity
Jira does not provide an individual velocity report out of the box. There is no built-in chart on the Jira Dashboard that displays detailed user-level metrics, such as initial and final commitment, completed work per sprint, or rollover items.
Even if you try to approximate this with Jira’s standard reports, they lack the key functionality: you cannot drill down by user, set targets, apply flexible filters, or switch between different chart views.
Our gadget fills this gap by providing a fully interactive, configurable individual velocity chart that displays user performance, supports multiple view modes, includes target lines, and allows you to filter and analyze data in the way your team needs.
Advantages of using Individual velocity chart
The Individual velocity chart provides in-depth insight into each team member’s performance, going far beyond what Jira offers natively. Key advantages include:
Complete visibility into individual contributions - track initial and final commitments, completed work, rollover items, and unfinished work for every user.
Identify bottlenecks and workload imbalances - see which users are over- or under-committed and adjust planning accordingly.
Flexible view modes - switch between grouping sprints by user or users by sprint to analyze performance from multiple perspectives.
Target lines for goal tracking - set absolute or relative targets per user and compare actual results to expected performance.
Advanced filtering - focus on active users, exclude inactive or unassigned work, and select specific team members to include or exclude.
Customizable chart types - choose Bar, Line, or Stacked Bar charts to visualize metrics in the way that best fits your analysis.
Support for data-driven planning and retrospectives - use accurate metrics to inform sprint planning, performance reviews, and process improvements.
With these features, team leads, project managers, and stakeholders can measure, compare, and improve individual and team performance - all from a single interactive dashboard chart.
The Agile Reports and Gadgets app also provides Individual velocity chart functionality along with many other reports and charts.
Frequently Asked Questions
1. What is Jira individual velocity?
Jira Individual velocity measures how much work a single team member completes per sprint, typically in story points or hours. It helps identify productivity patterns, workload balance, and individual contribution to overall delivery.
In native Jira, there is no built-in individual velocity chart. Standard reports focus on team-level metrics and do not provide user-level insights such as completed work per person, commitments, or rollover. There is also no support for drill-down, targets, or flexible filtering by assignee.
With Agile Velocity Charts by Broken Build, teams can track individual velocity with a fully interactive and configurable chart. It provides visibility into each team member’s performance, including initial and final commitments, completed work, rollover, and unfinished items.
The app supports multiple view modes (by user or by sprint), target lines for goal tracking, and advanced filtering to include or exclude specific users. With customizable chart types and detailed breakdowns, teams can analyze performance from different perspectives and make data-driven decisions for planning, balancing workload, and improving delivery efficiency — directly in Jira.
2. Does Jira have a built-in Velocity chart per user?
No - Jira does not provide a native chart that tracks user-level commitments versus completion, nor does it support flexible filtering and visualization.
3. What would I see on the Individual velocity chart in Jira?
The Individual velocity chart in Jira shows each team member’s performance over selected sprints, including initial and final commitments, completed work, rollover items, and unfinished tasks. You can view the data in two modes: group sprints by user, which highlights each user’s performance over multiple sprints, or group users by sprint, which shows all users’ contributions within a single sprint. Both views allow you to drill down into individual metrics for detailed analysis.
4. How is the Initial Commitment metric calculated?
Initial Commitment counts all work items assigned to a user at the start of the sprint, before any work begins or scope changes occur.
5. Can I filter work items related to inactive users?
Yes. The User Filter allows you to include or exclude inactive users, unassigned issues, or specific team members, focusing the report on relevant data.
6. How to check individual velocity in Jira?
Native Jira doesn’t offer user-level velocity tracking - only team velocity. With the Agile Velocity Chart Gadget, you can unlock an Individual velocity chart that shows each member’s commitments, completed and unfinished work, and rollover items, all in one interactive Jira dashboard view.


.svg)


.png)
.png)
