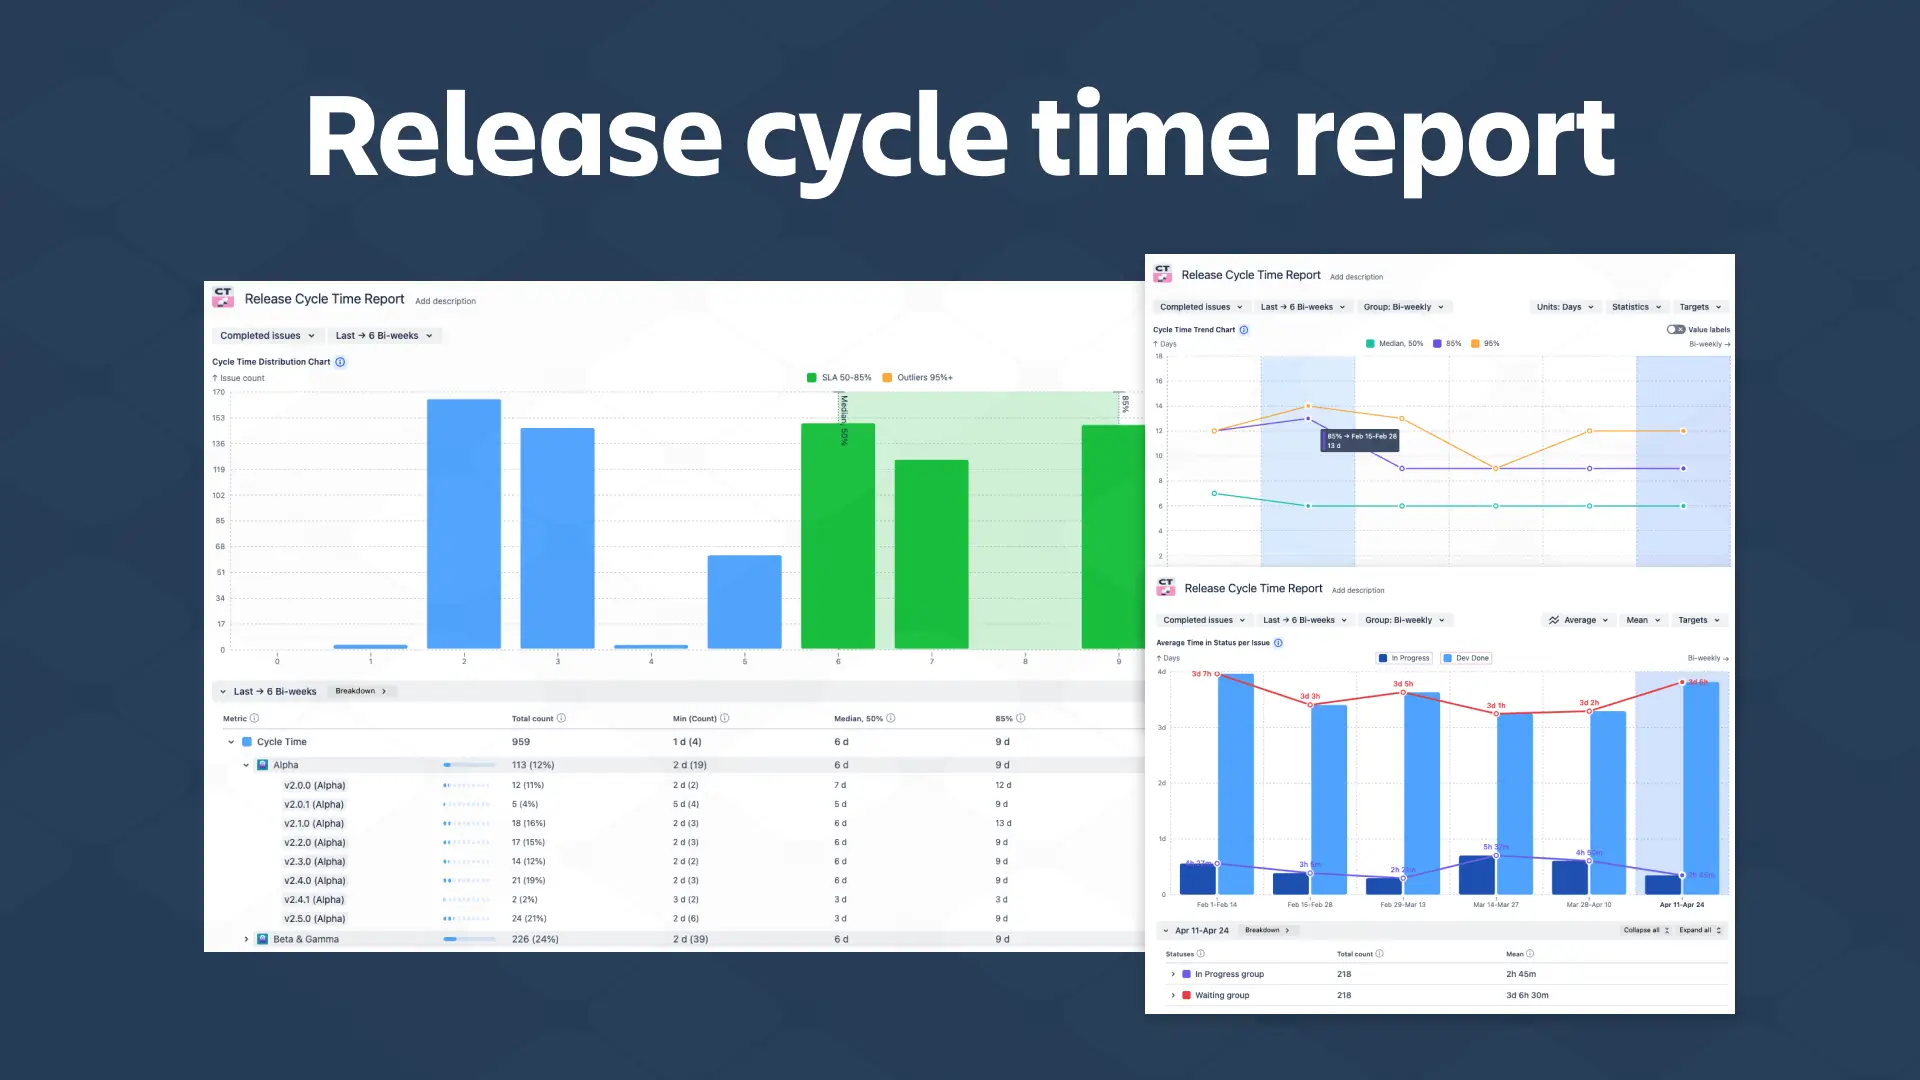
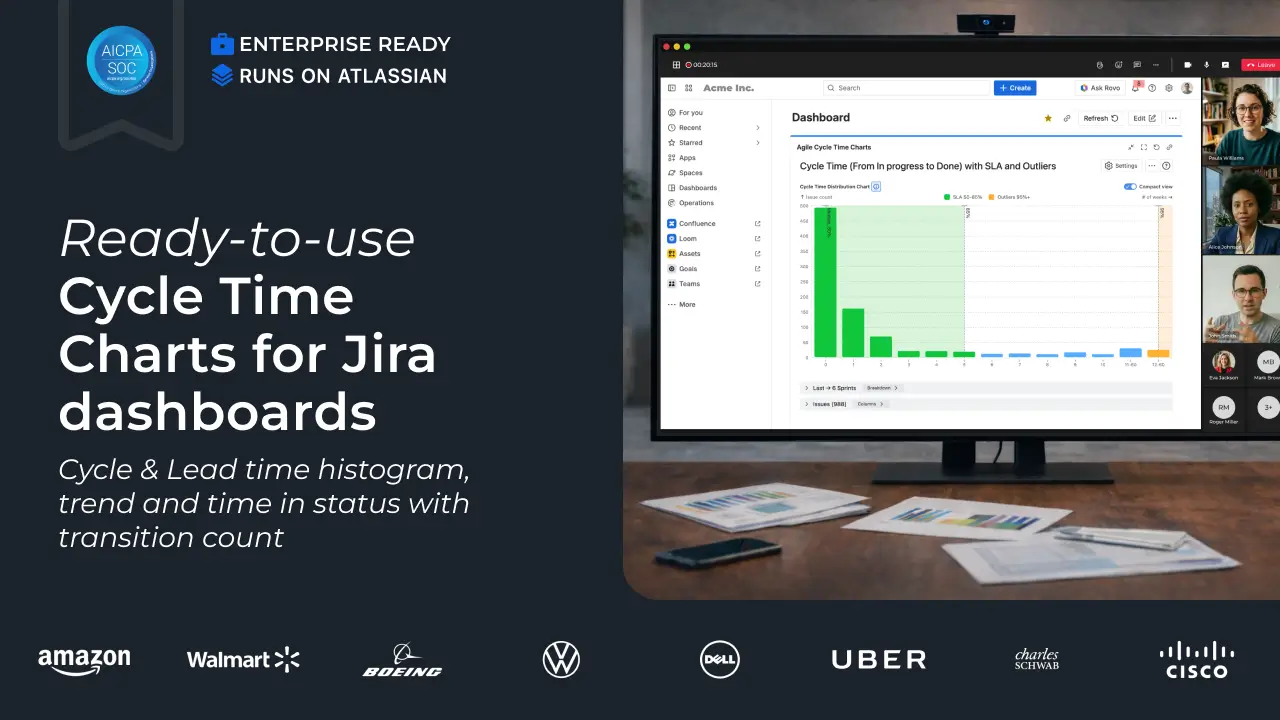
Agile Cycle Time Charts for Jira Dashboard
With the advanced cycle time reporting in Jira, you can:
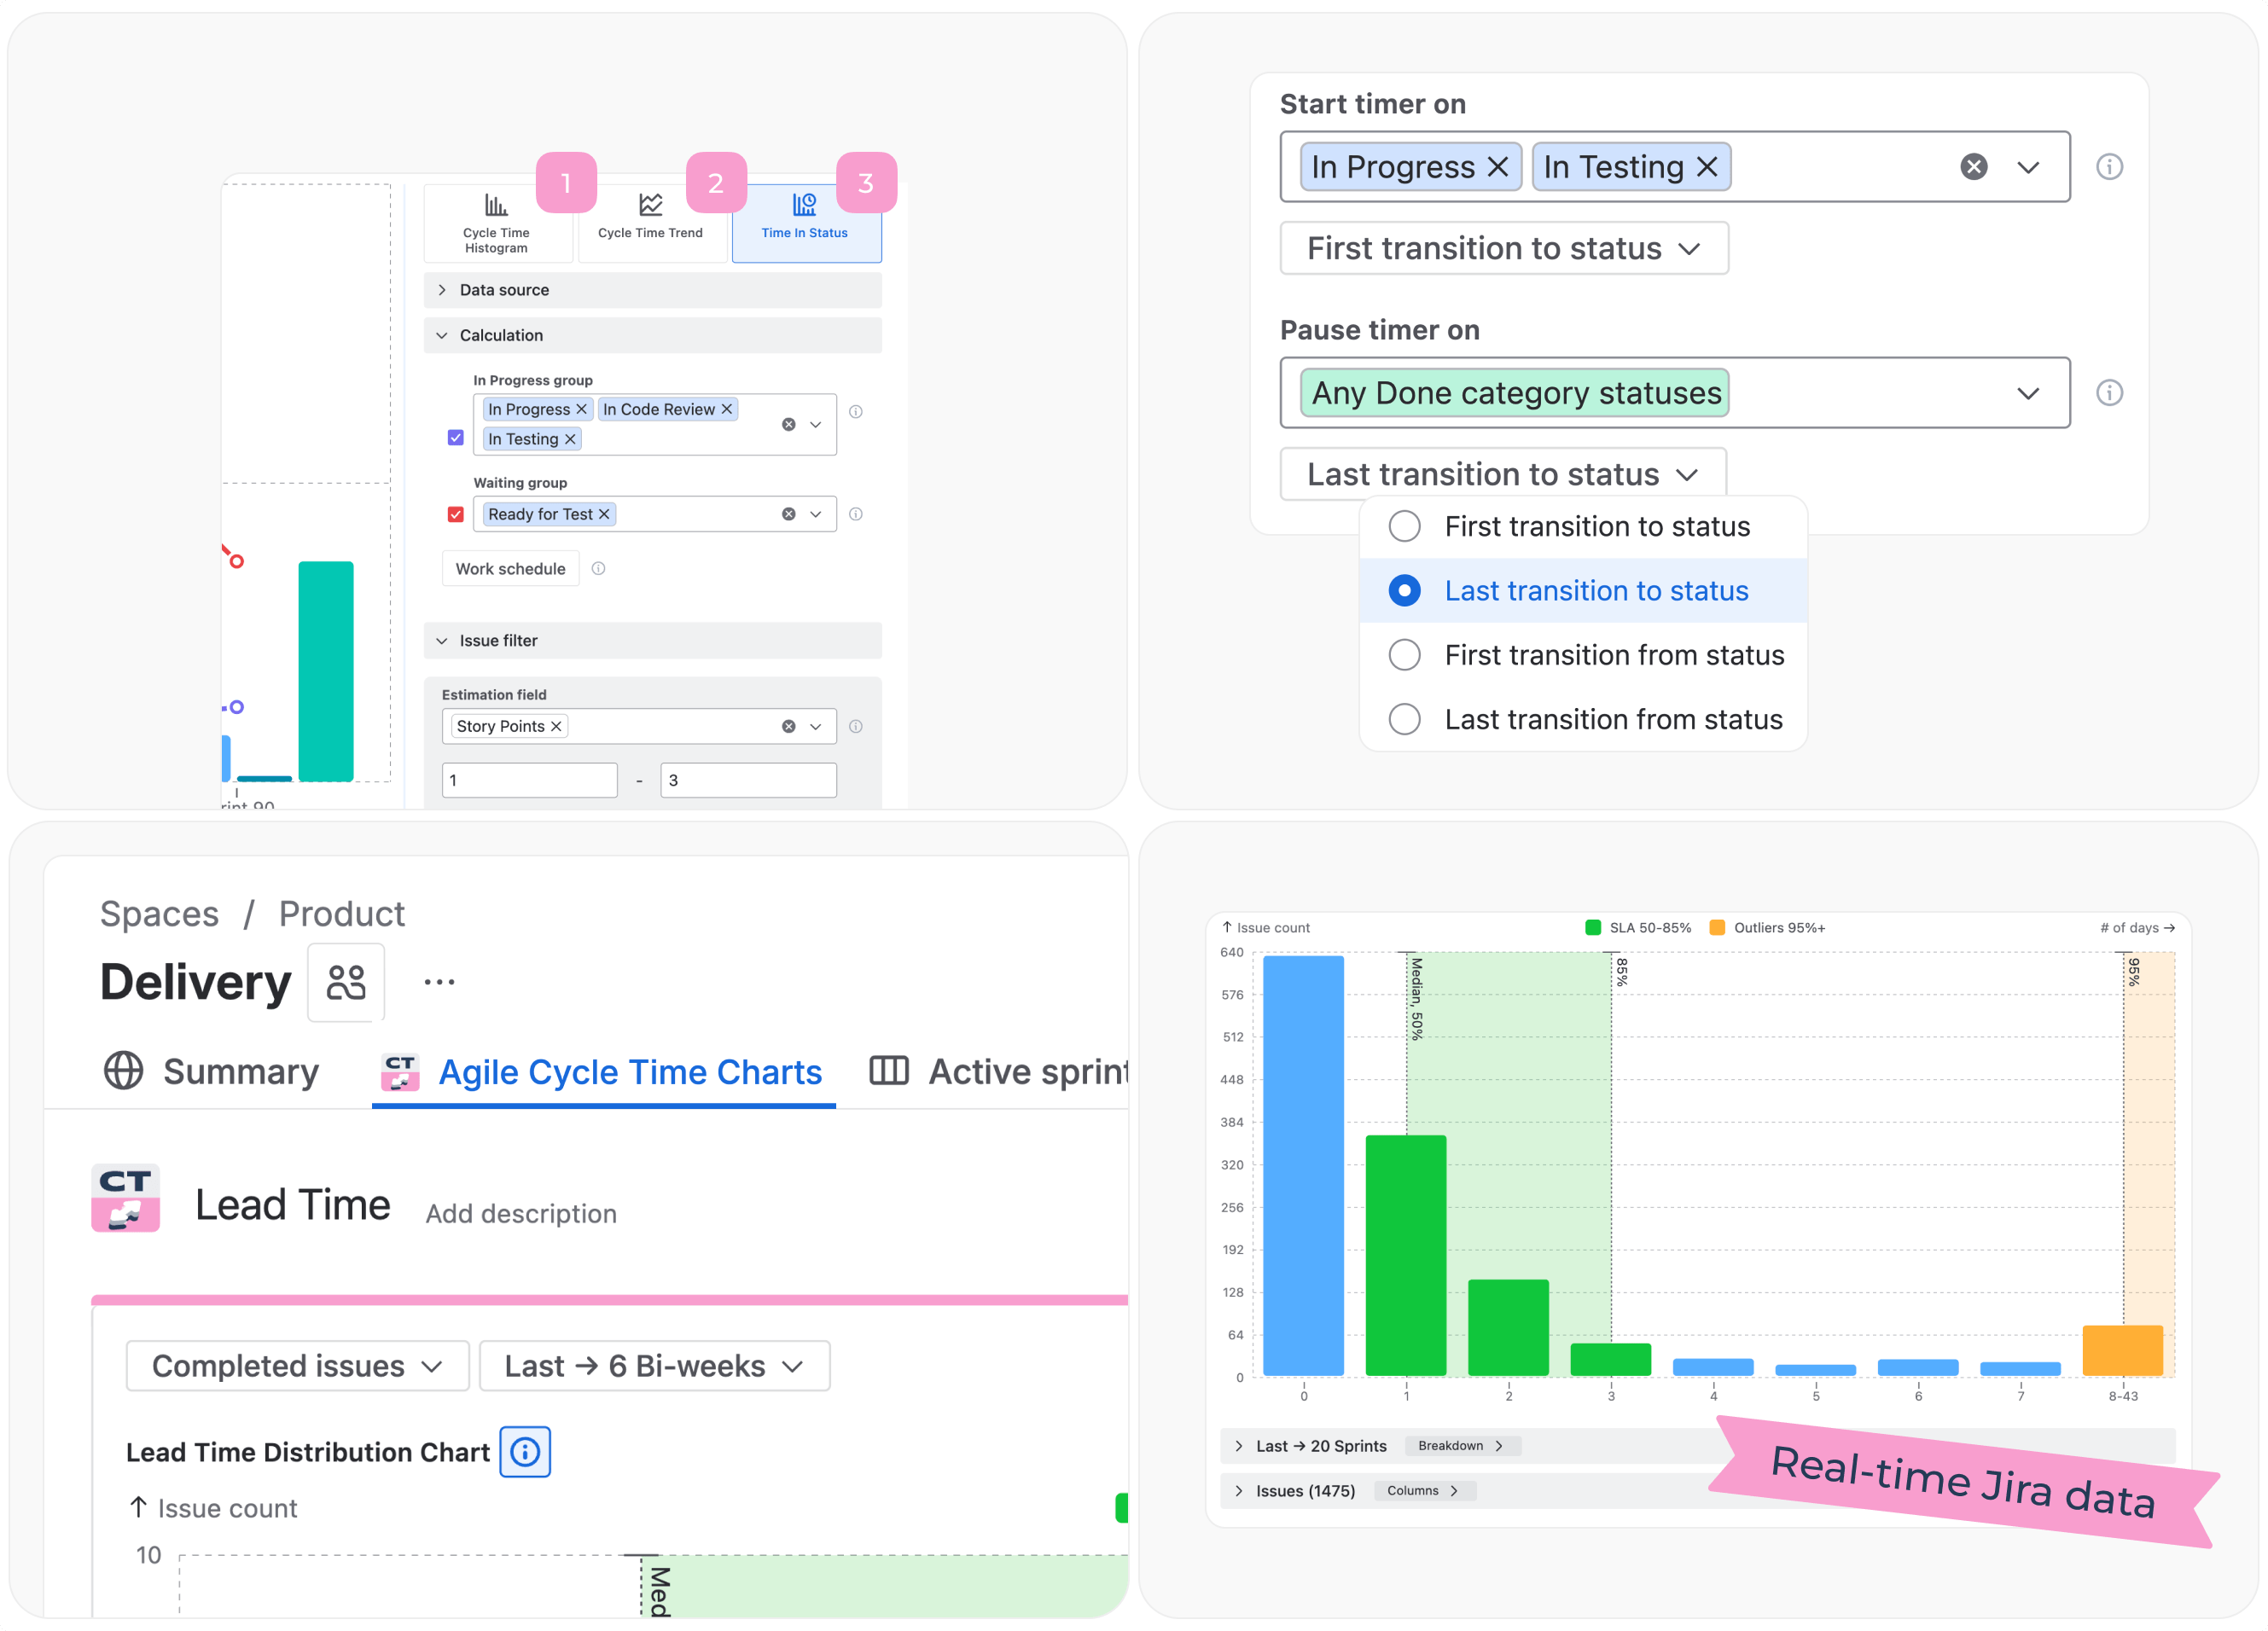
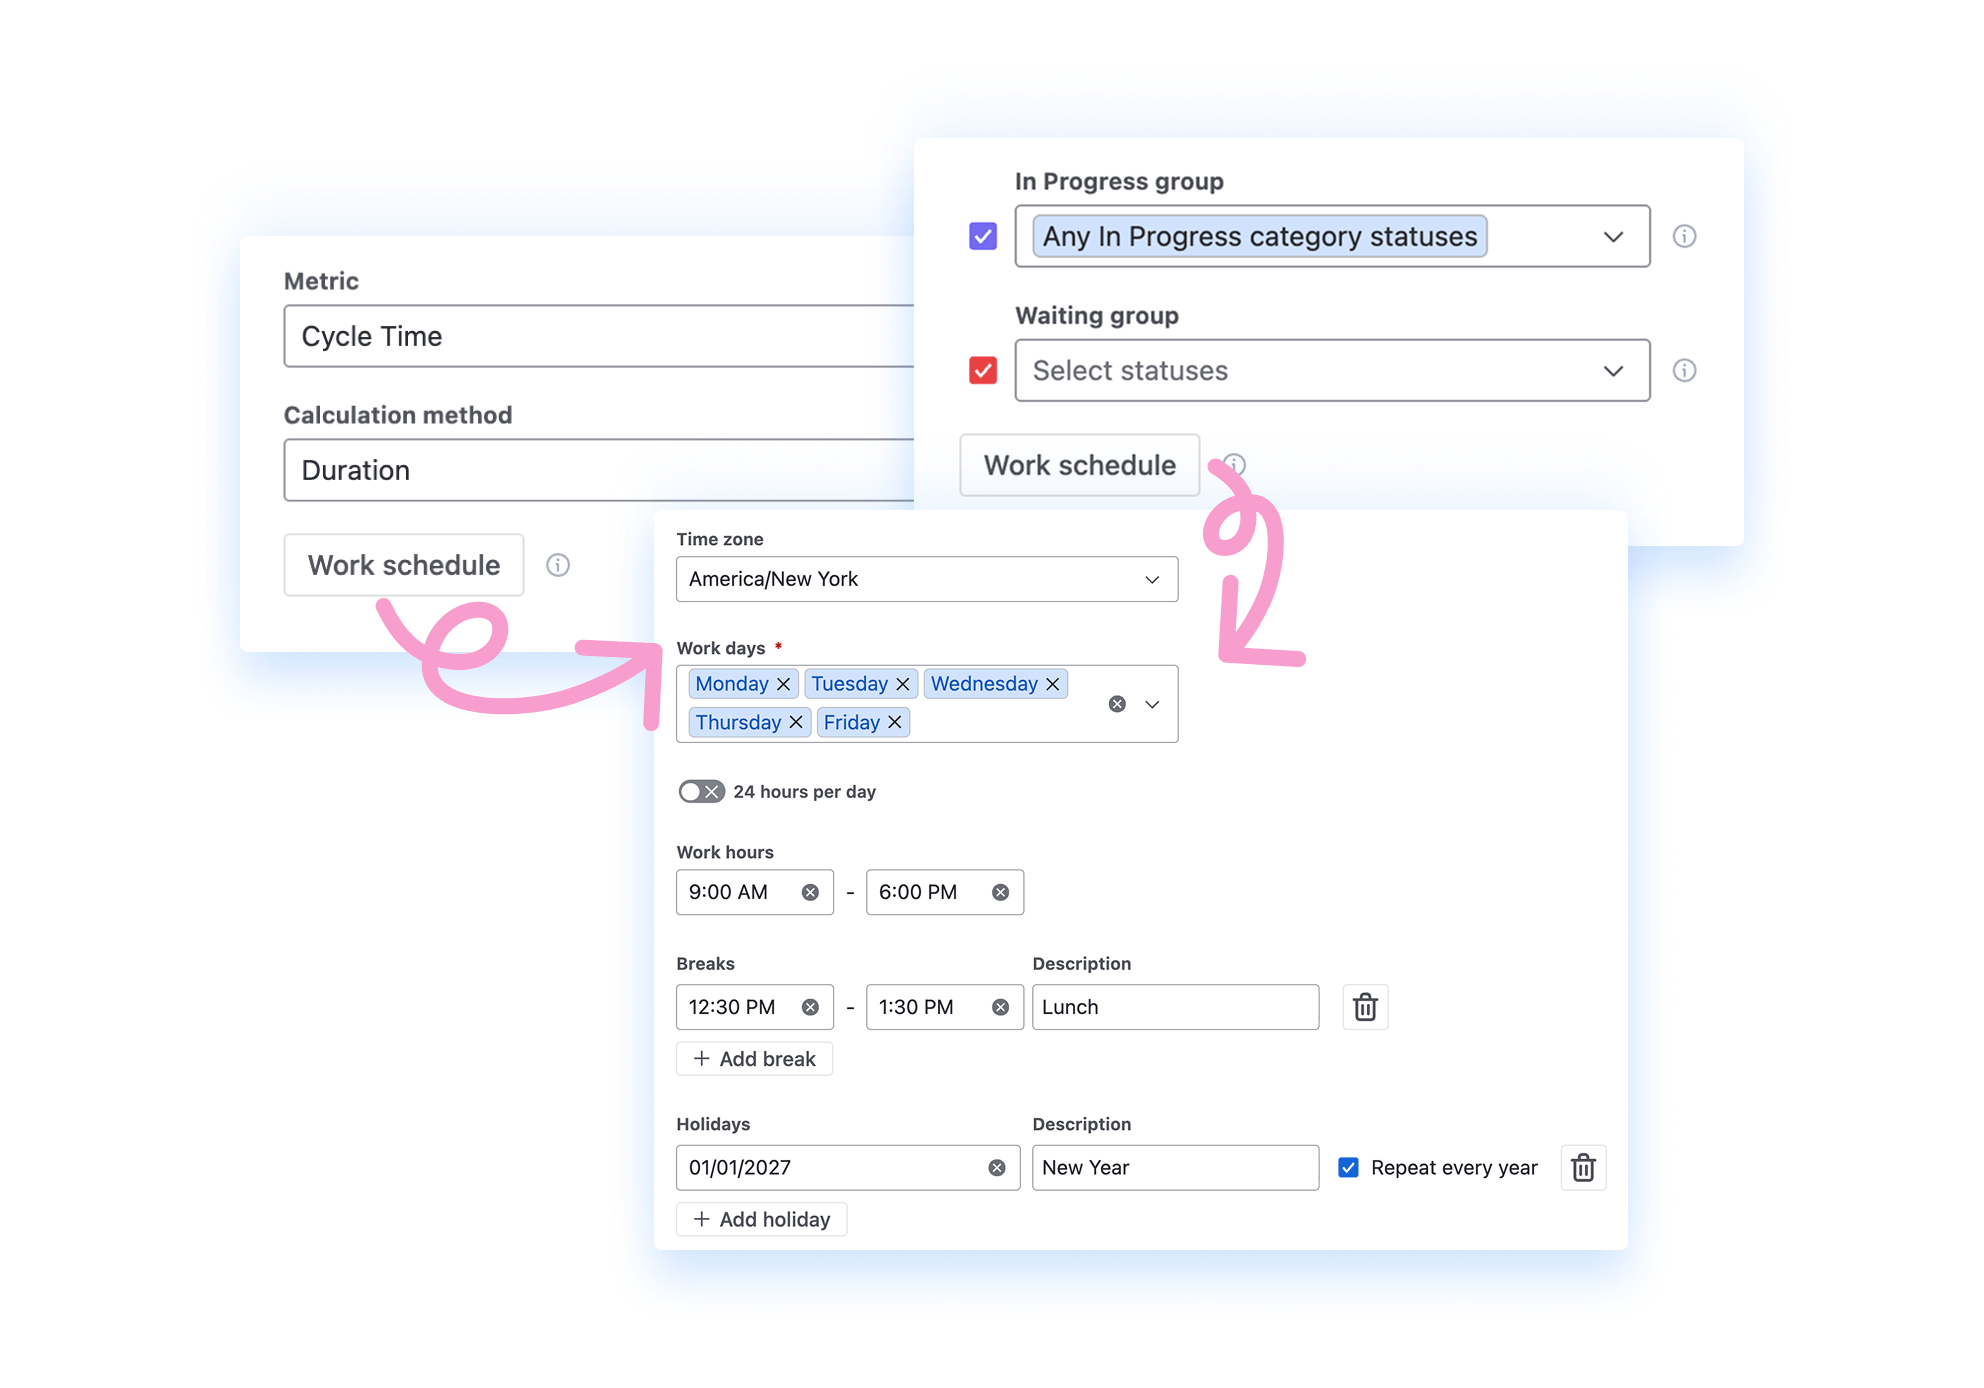
- Know how long work really takes – measure cycle time or lead time with configurable timer rules that match your actual workflow
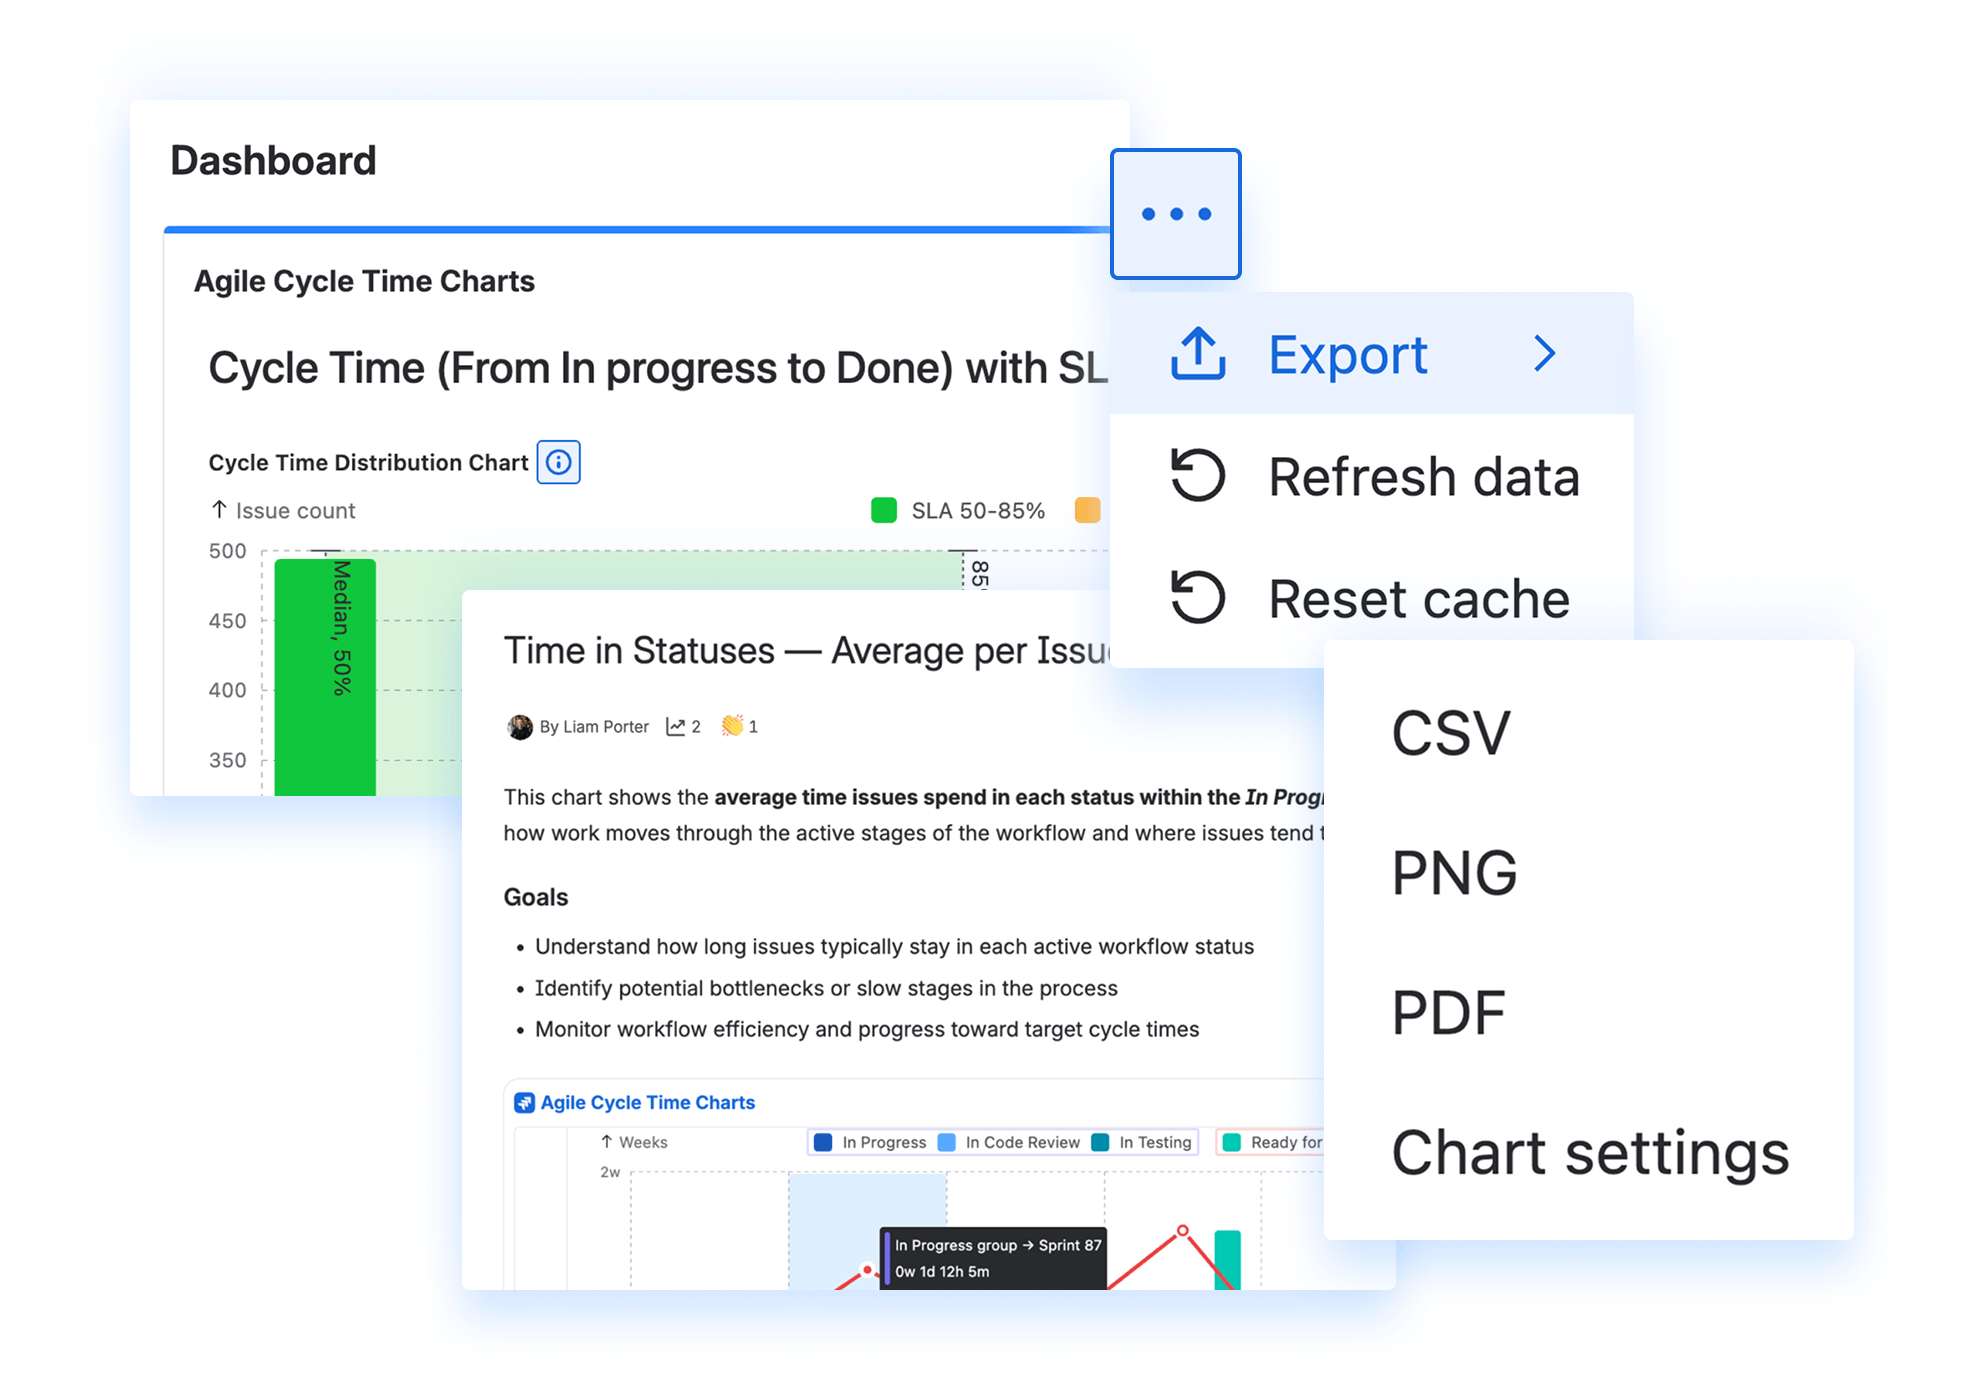
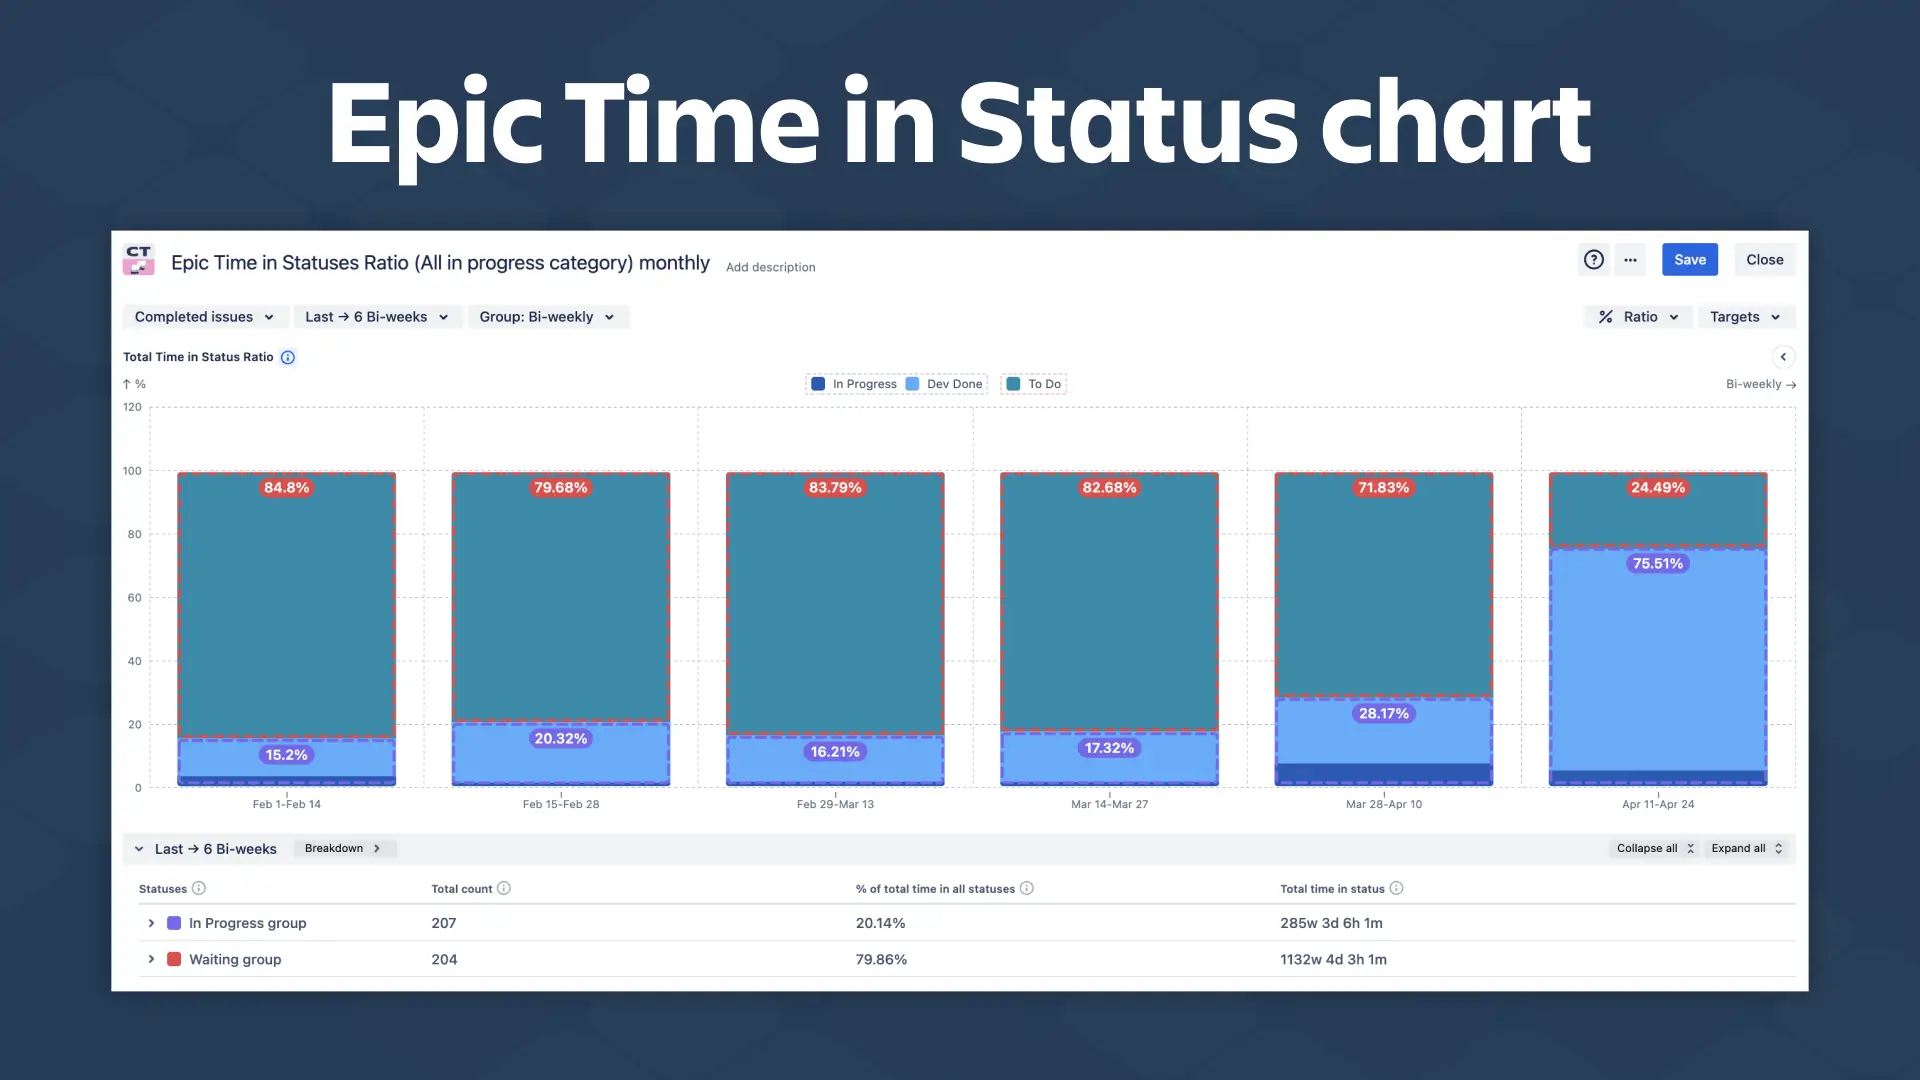
- Find where work gets stuck – see which statuses consume the most time and where issues wait the longest
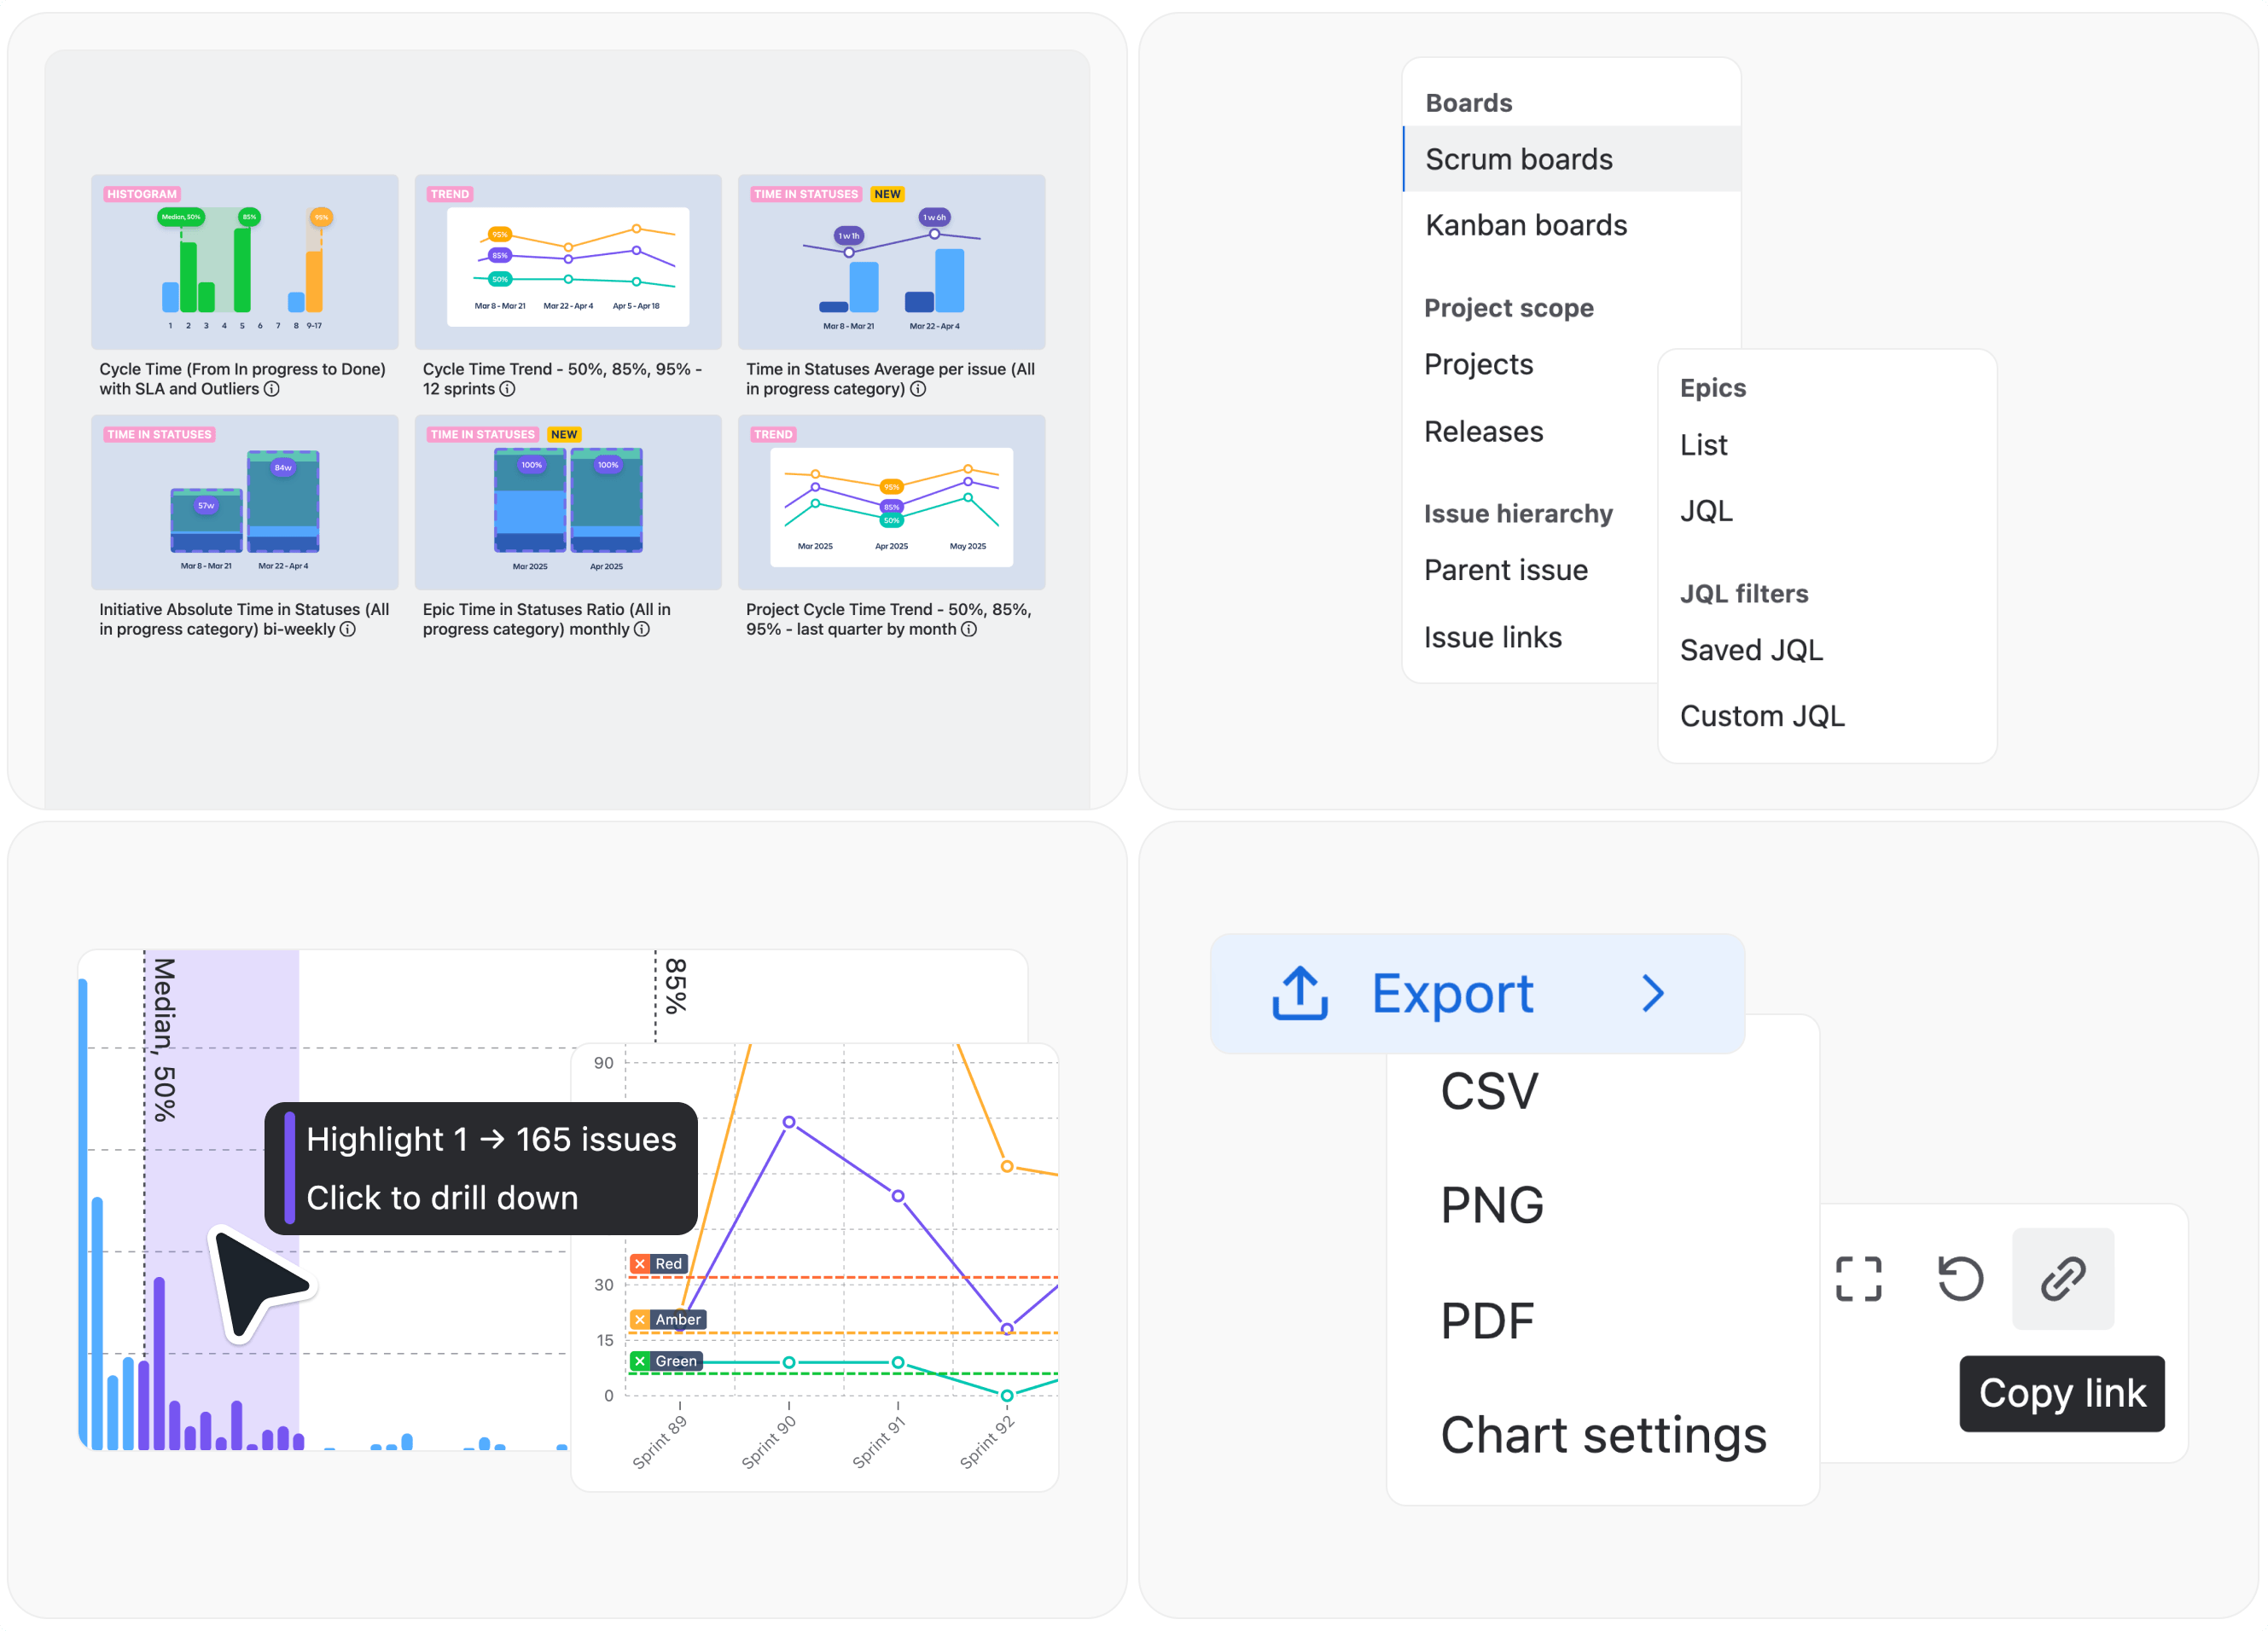
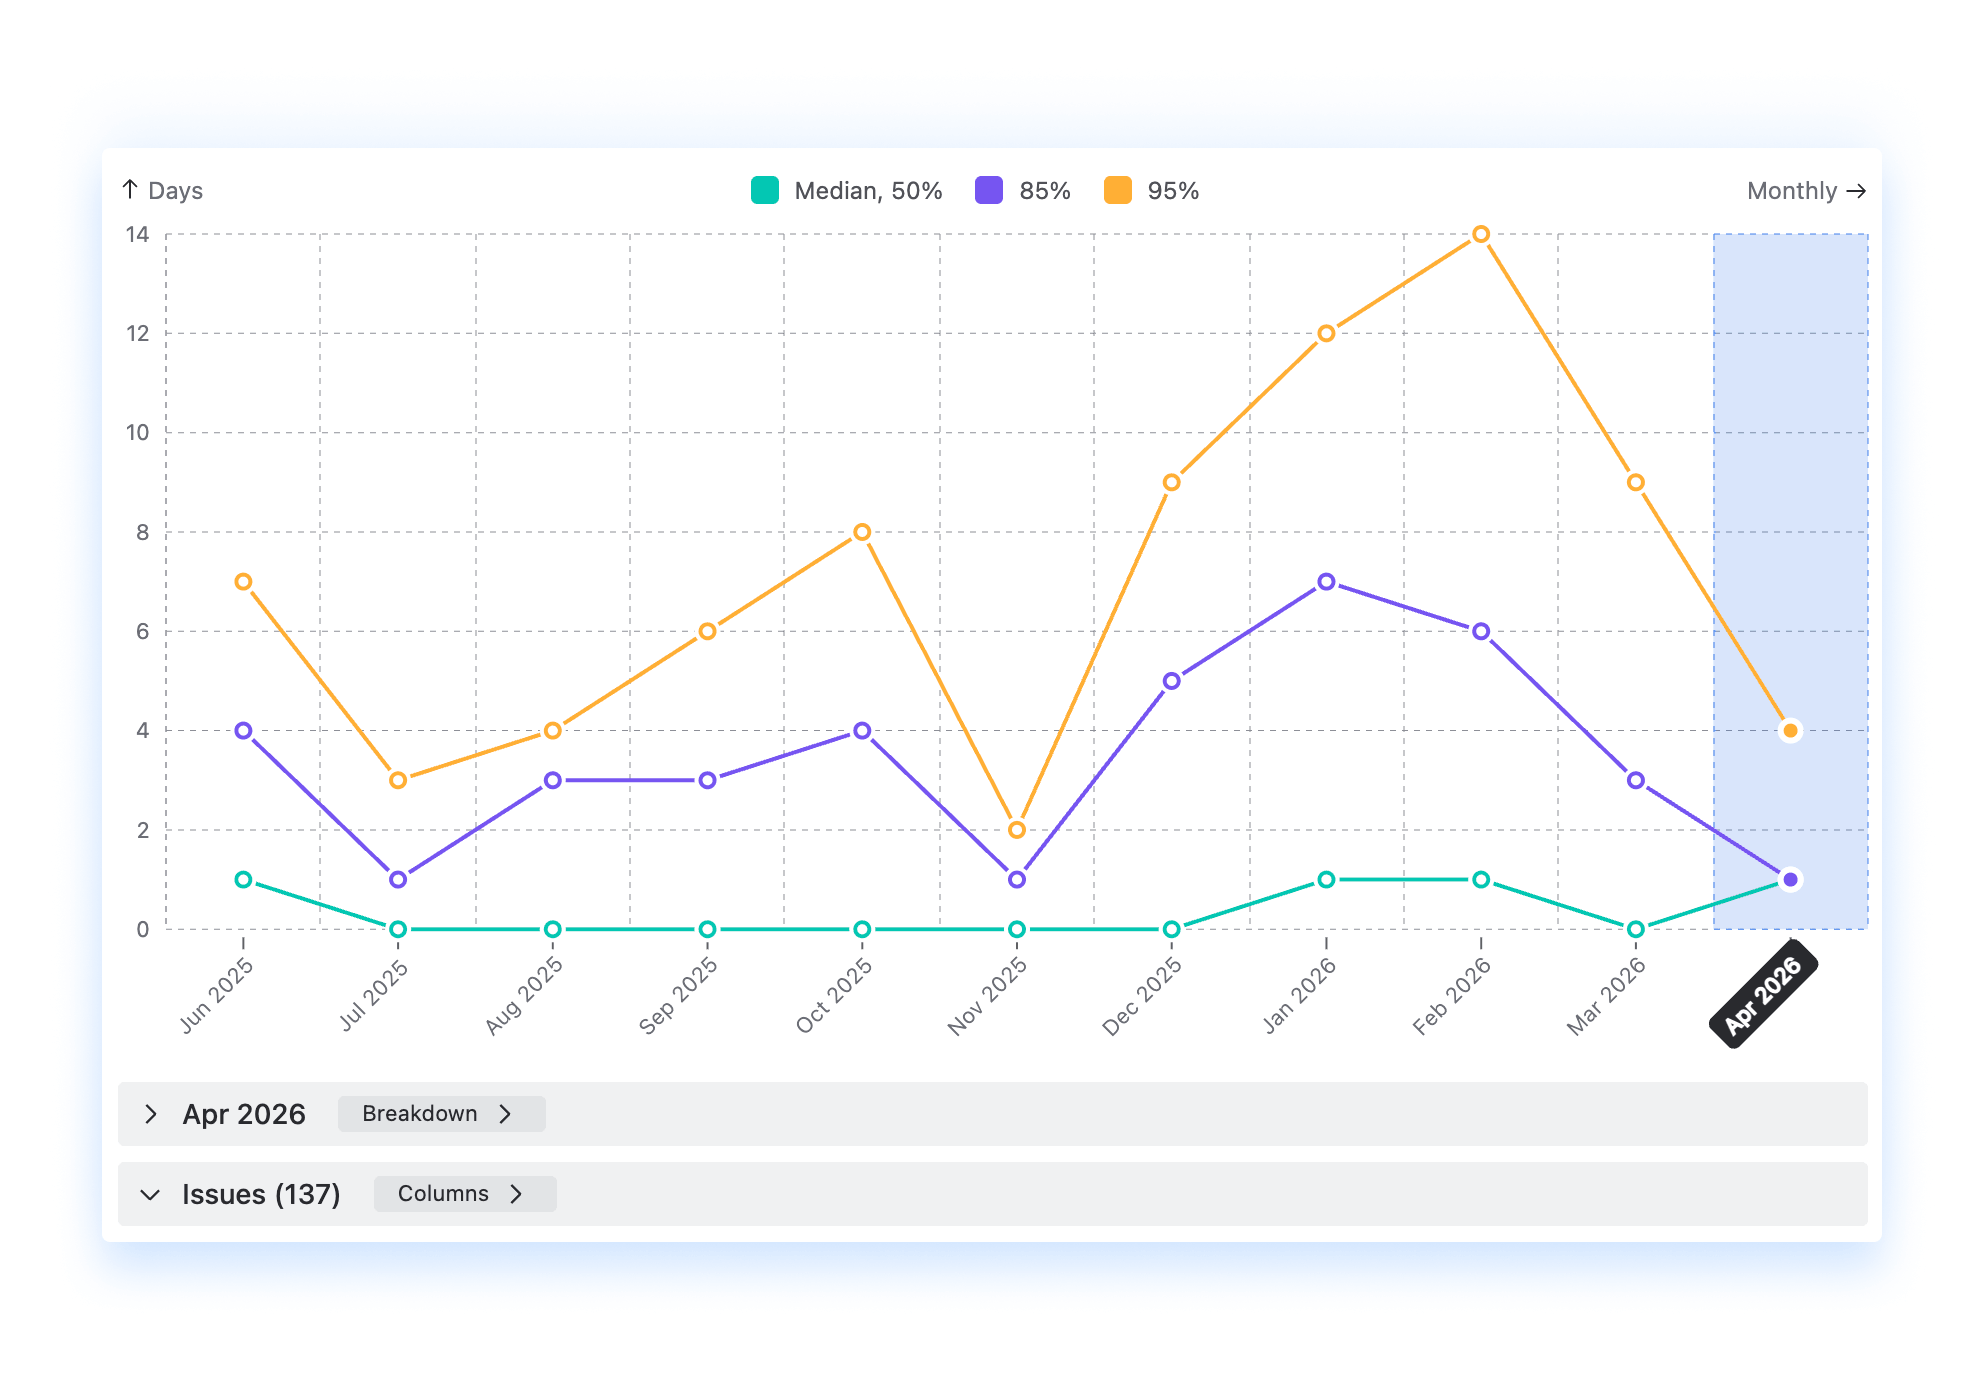
- Spot patterns and track trends – assess delivery predictability with the histogram, and monitor improvements across sprints or quarters
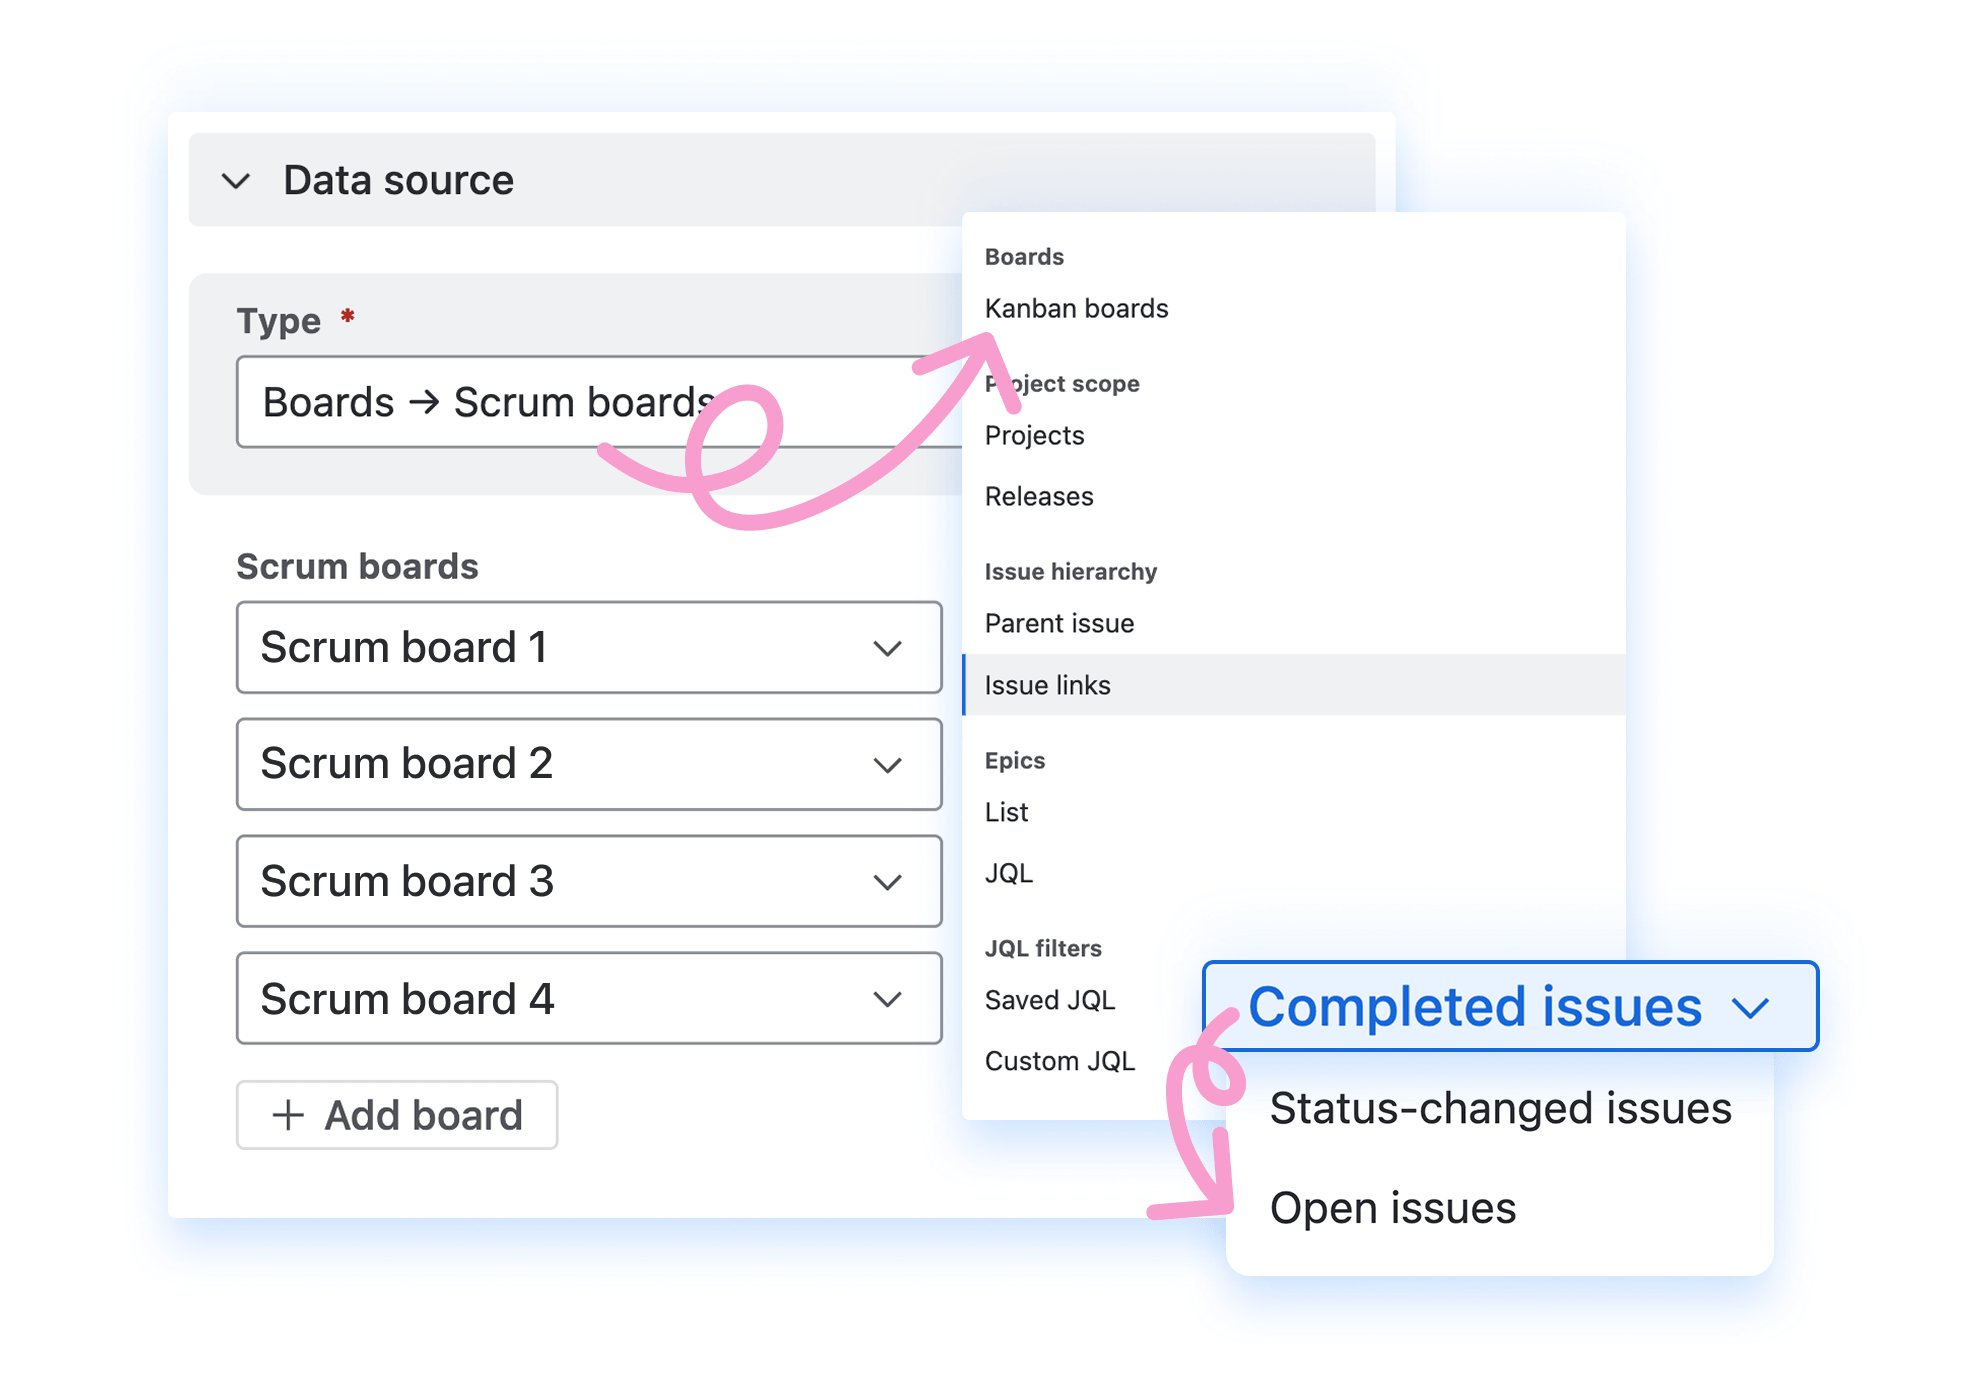
- Start in minutes, scale to portfolio – pick a template for quick setup, then aggregate data across boards, projects, and teams




















.png)