Agile Burnup Burndown Charts for Jira Dashboard
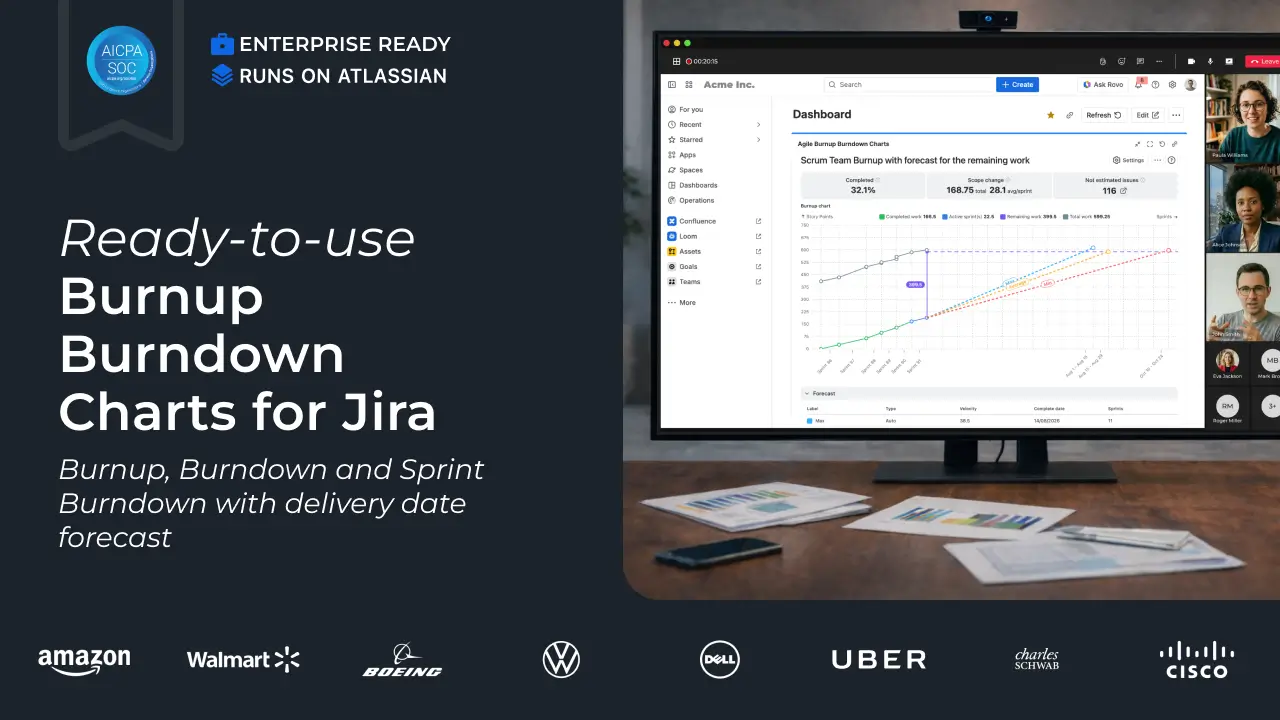
With the advanced burnup burndown reporting in Jira, you can:
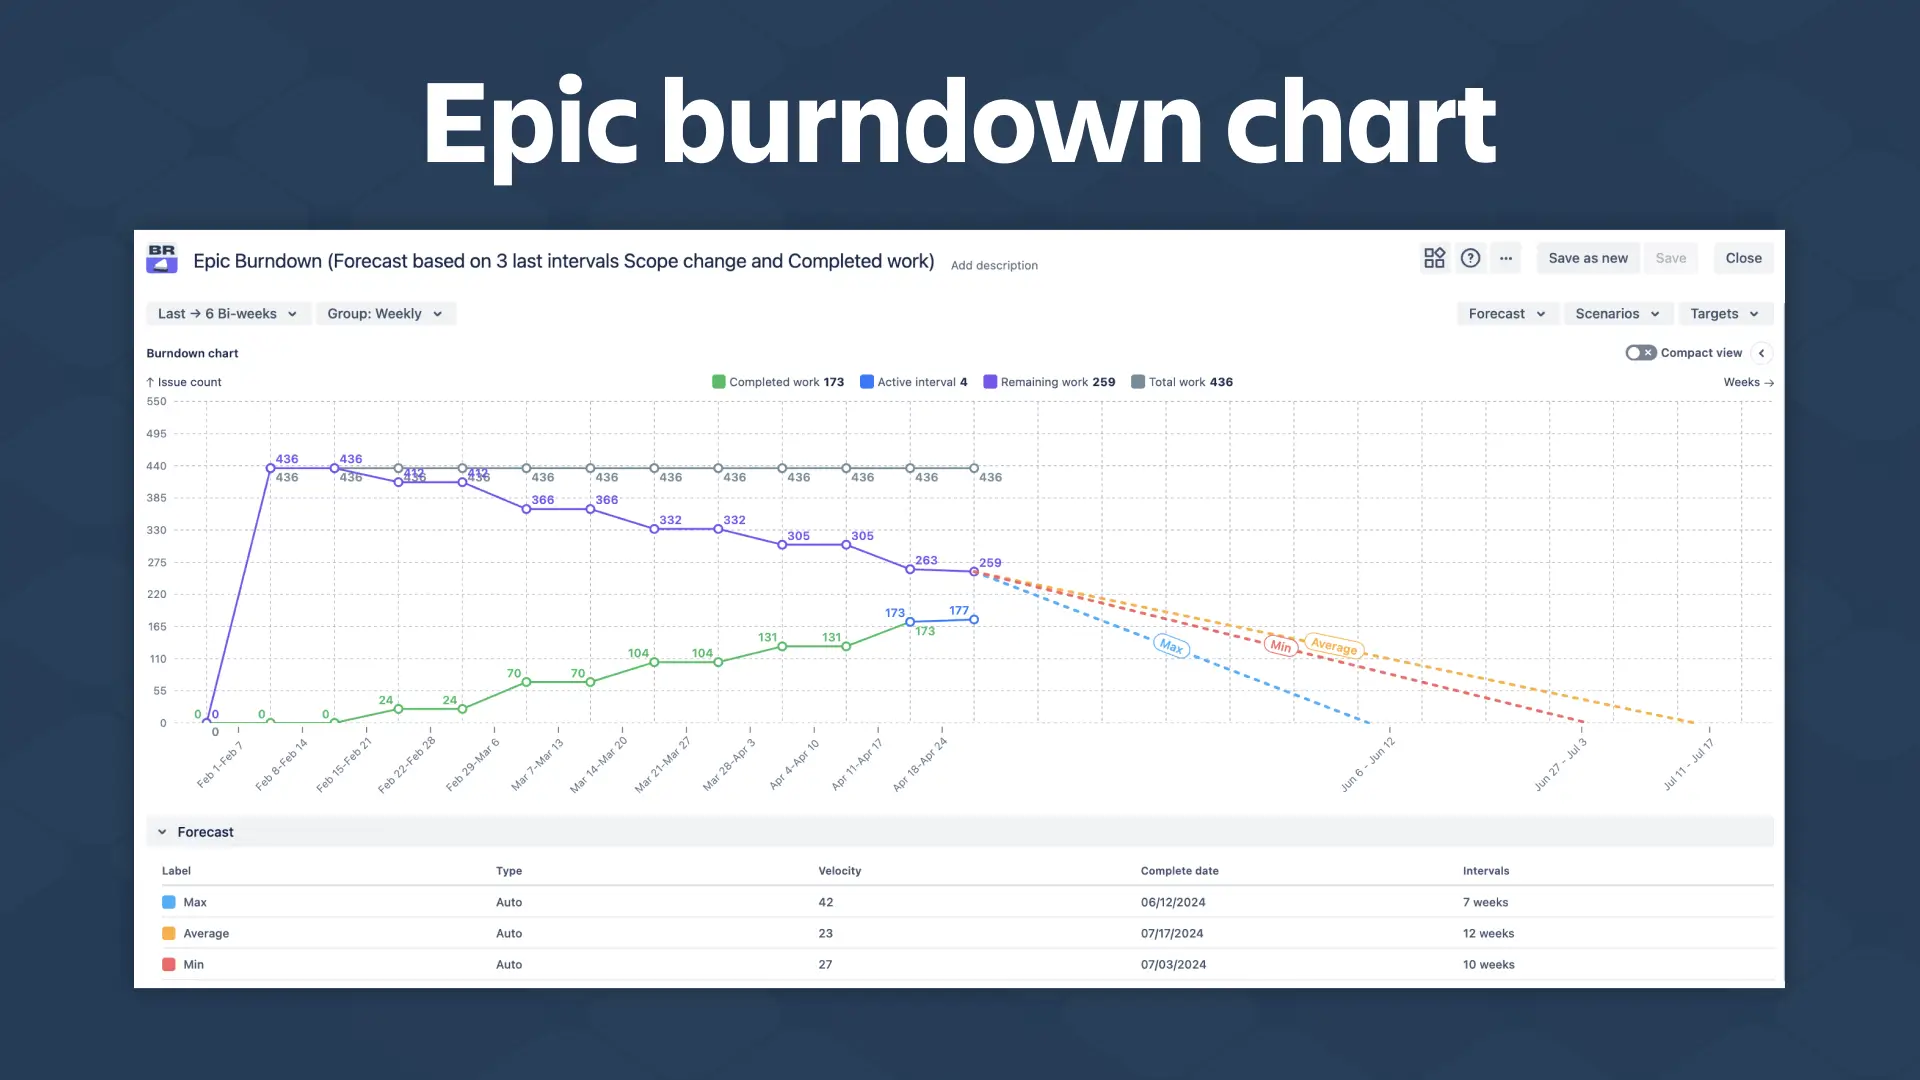
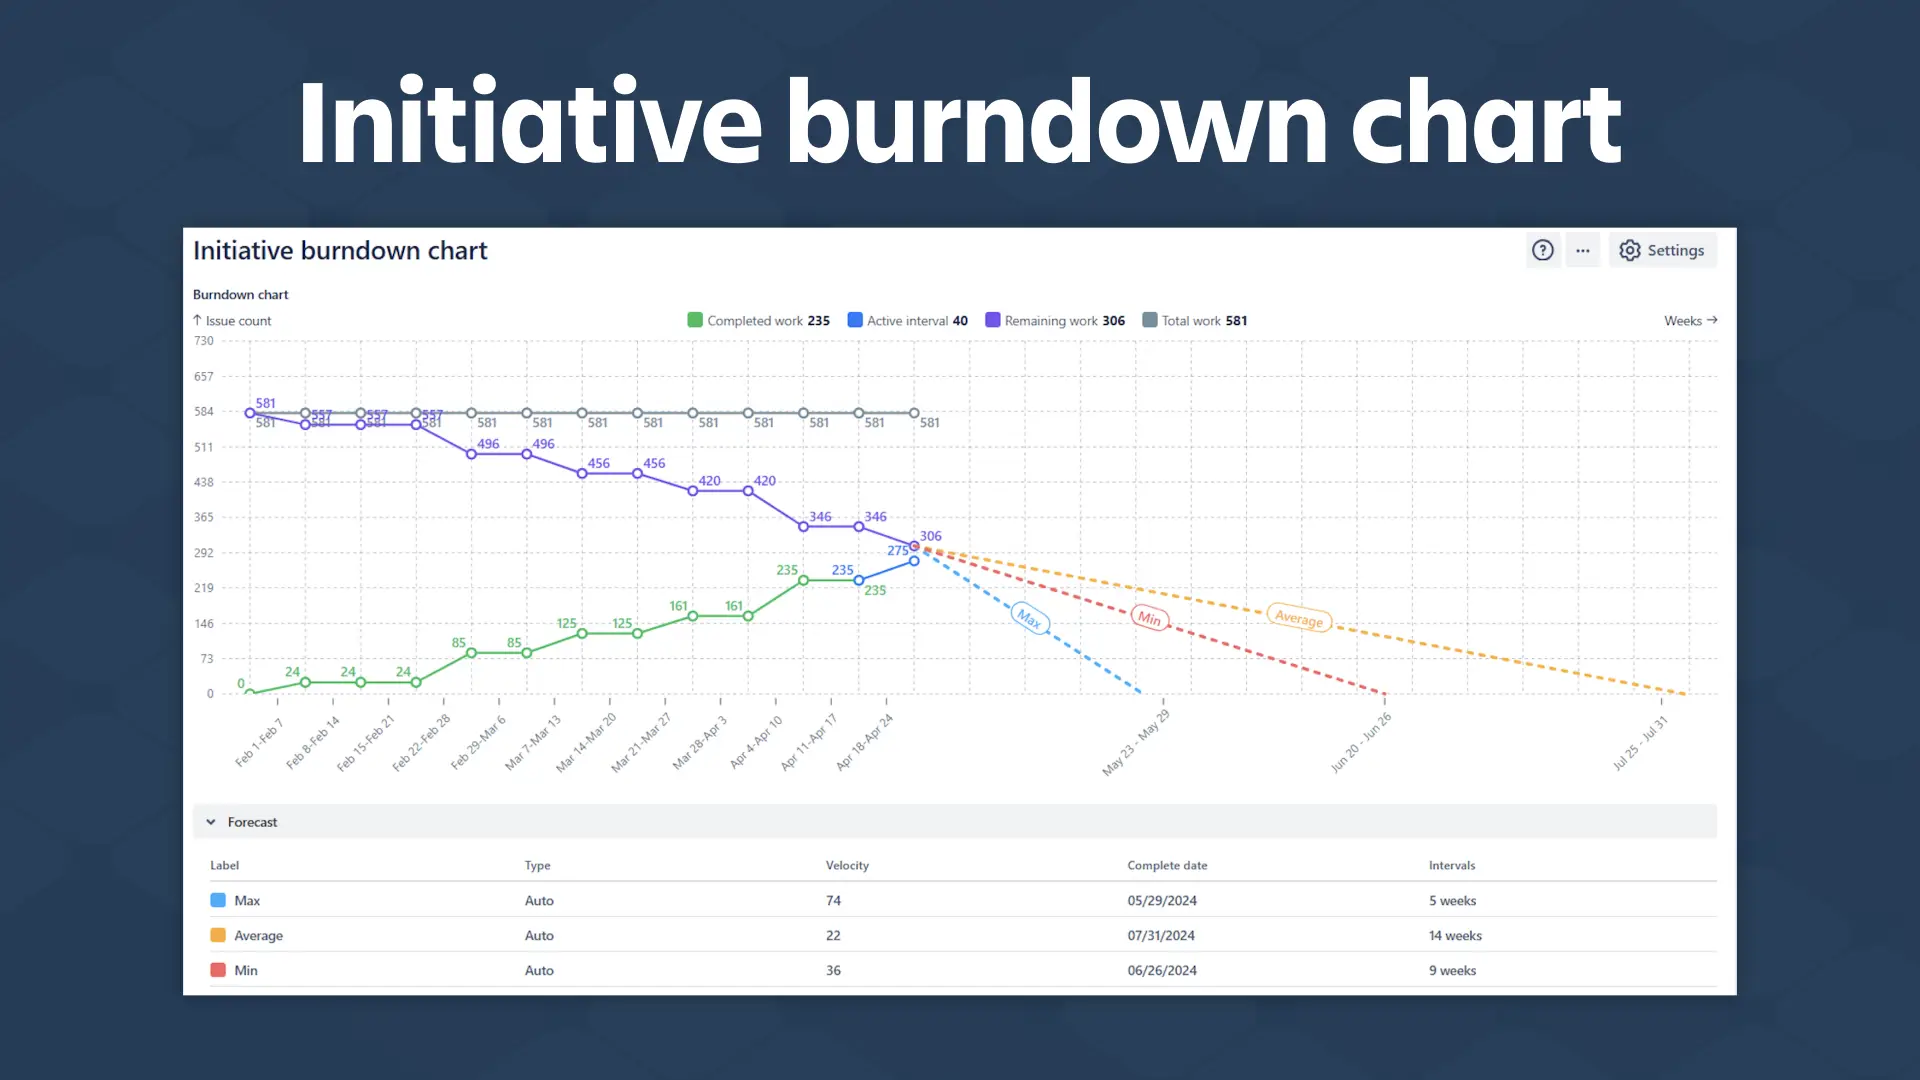
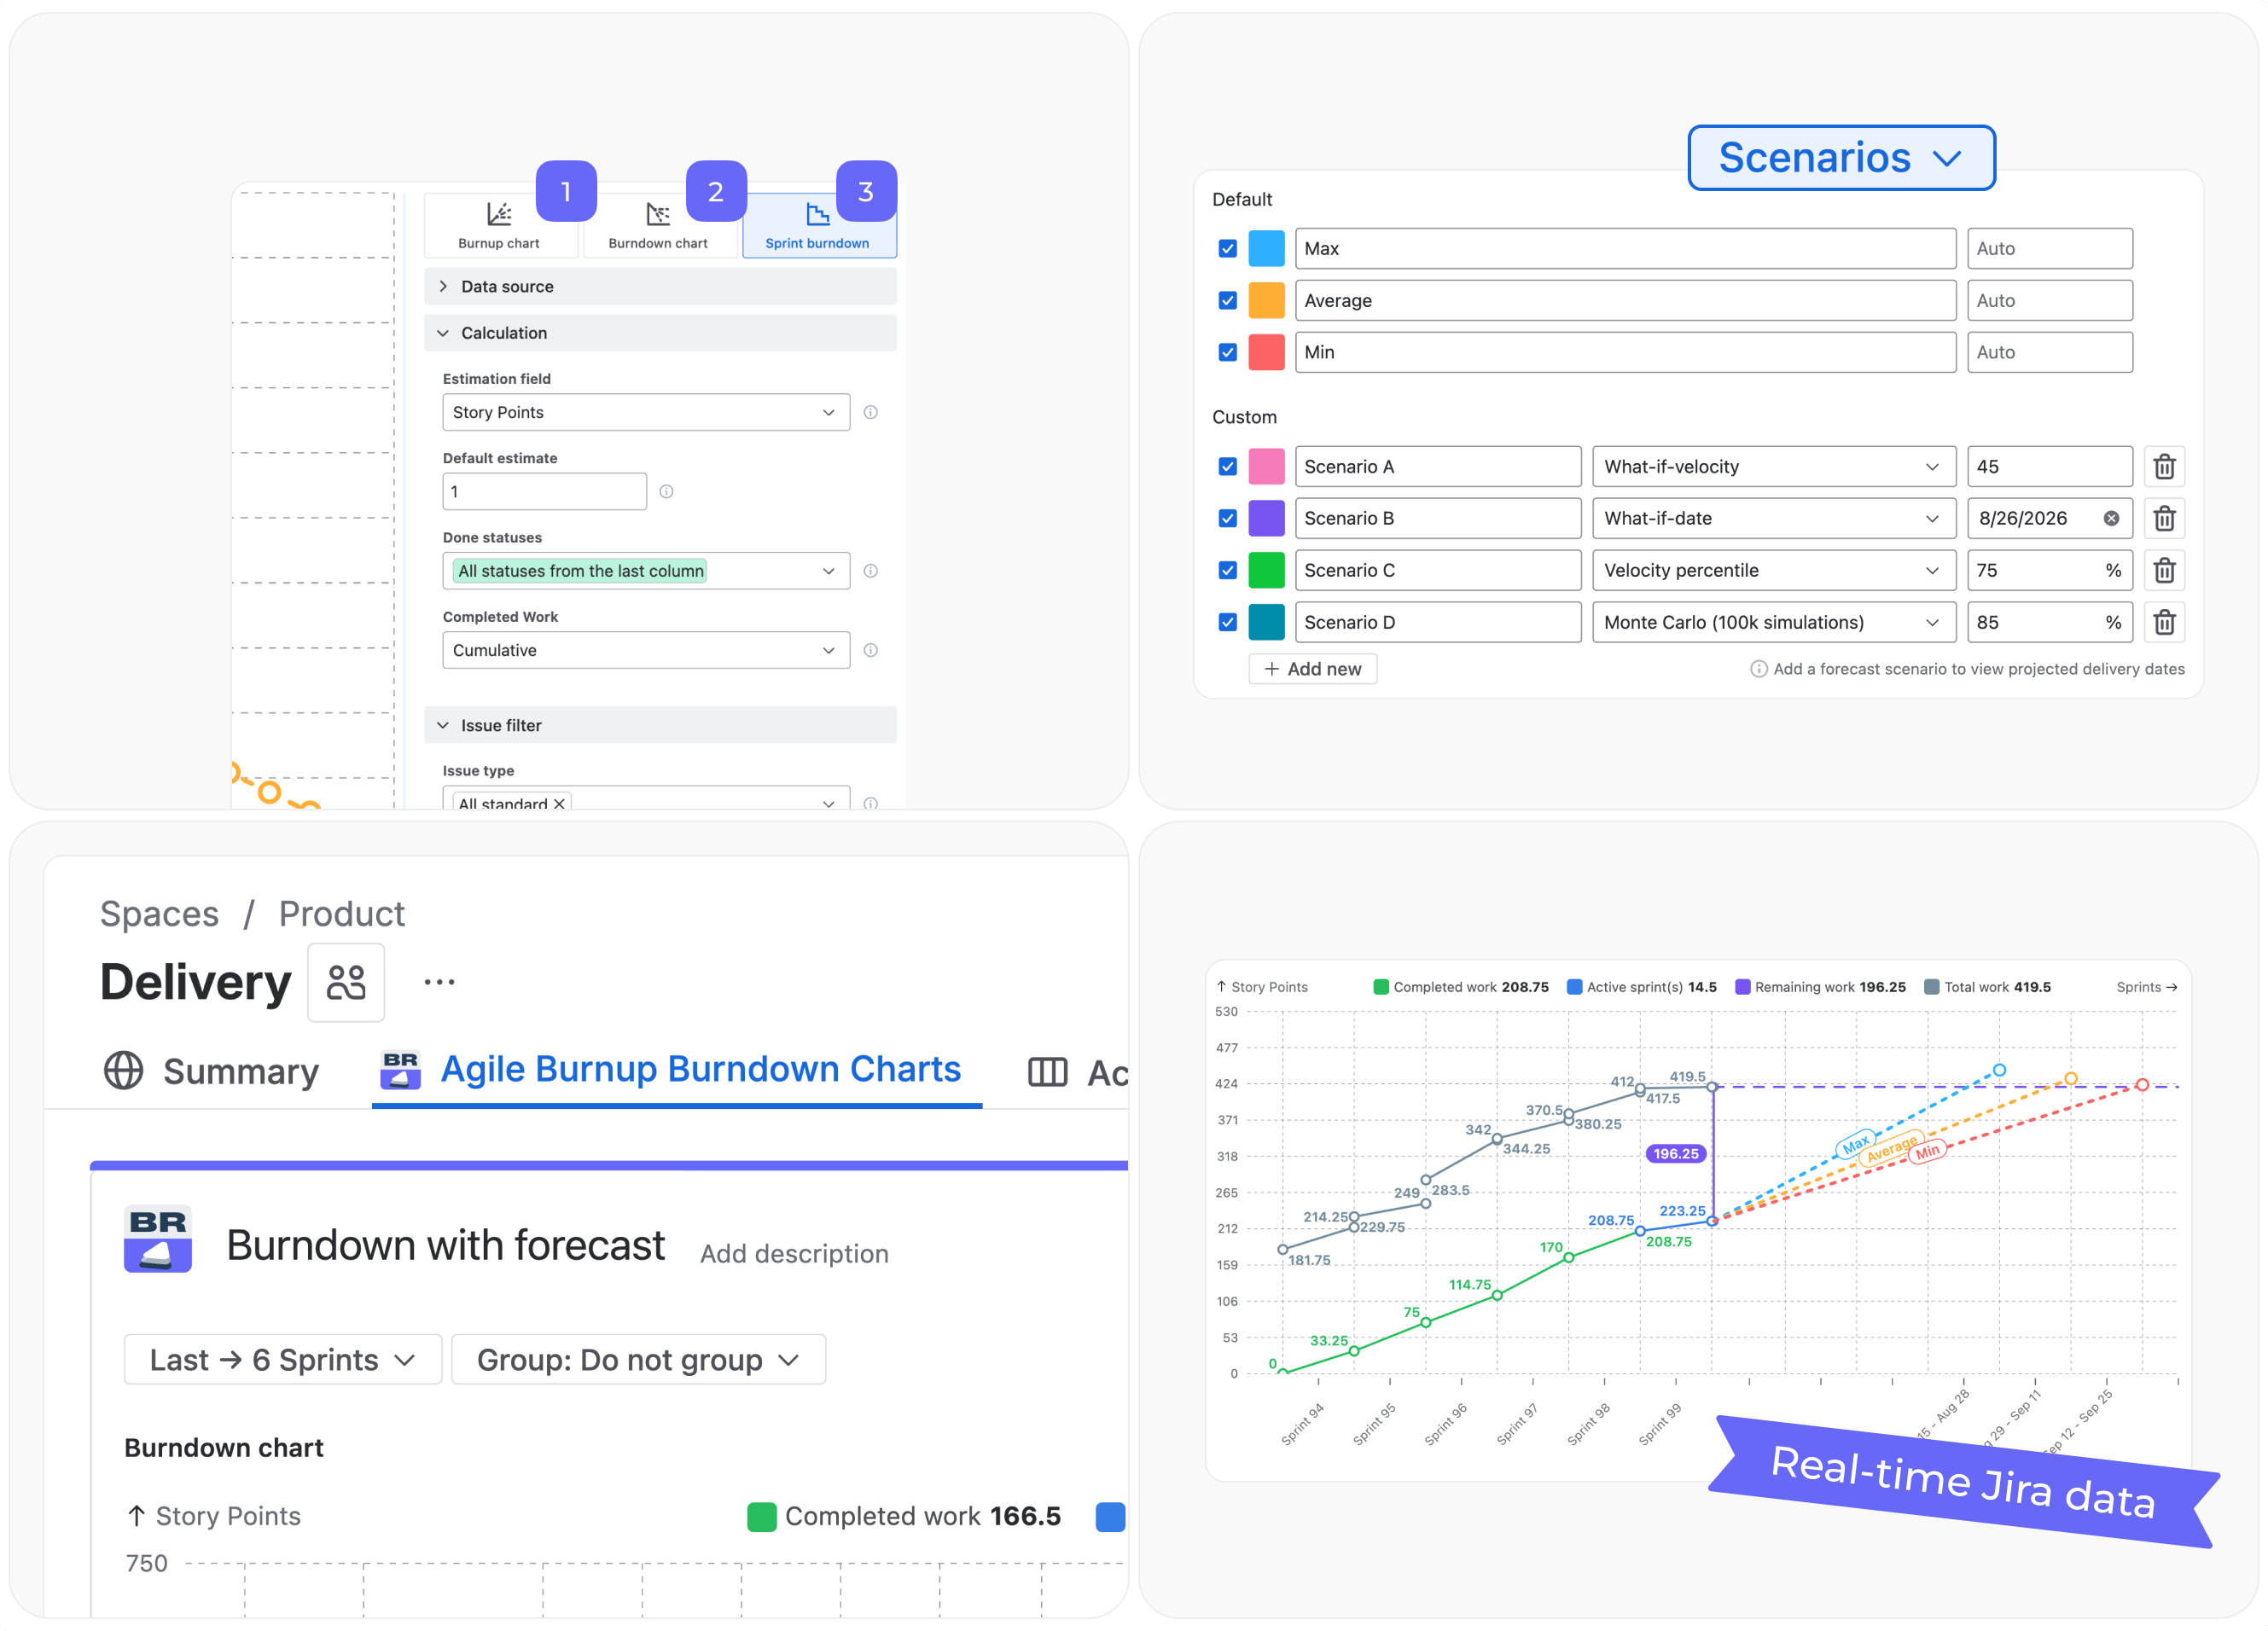
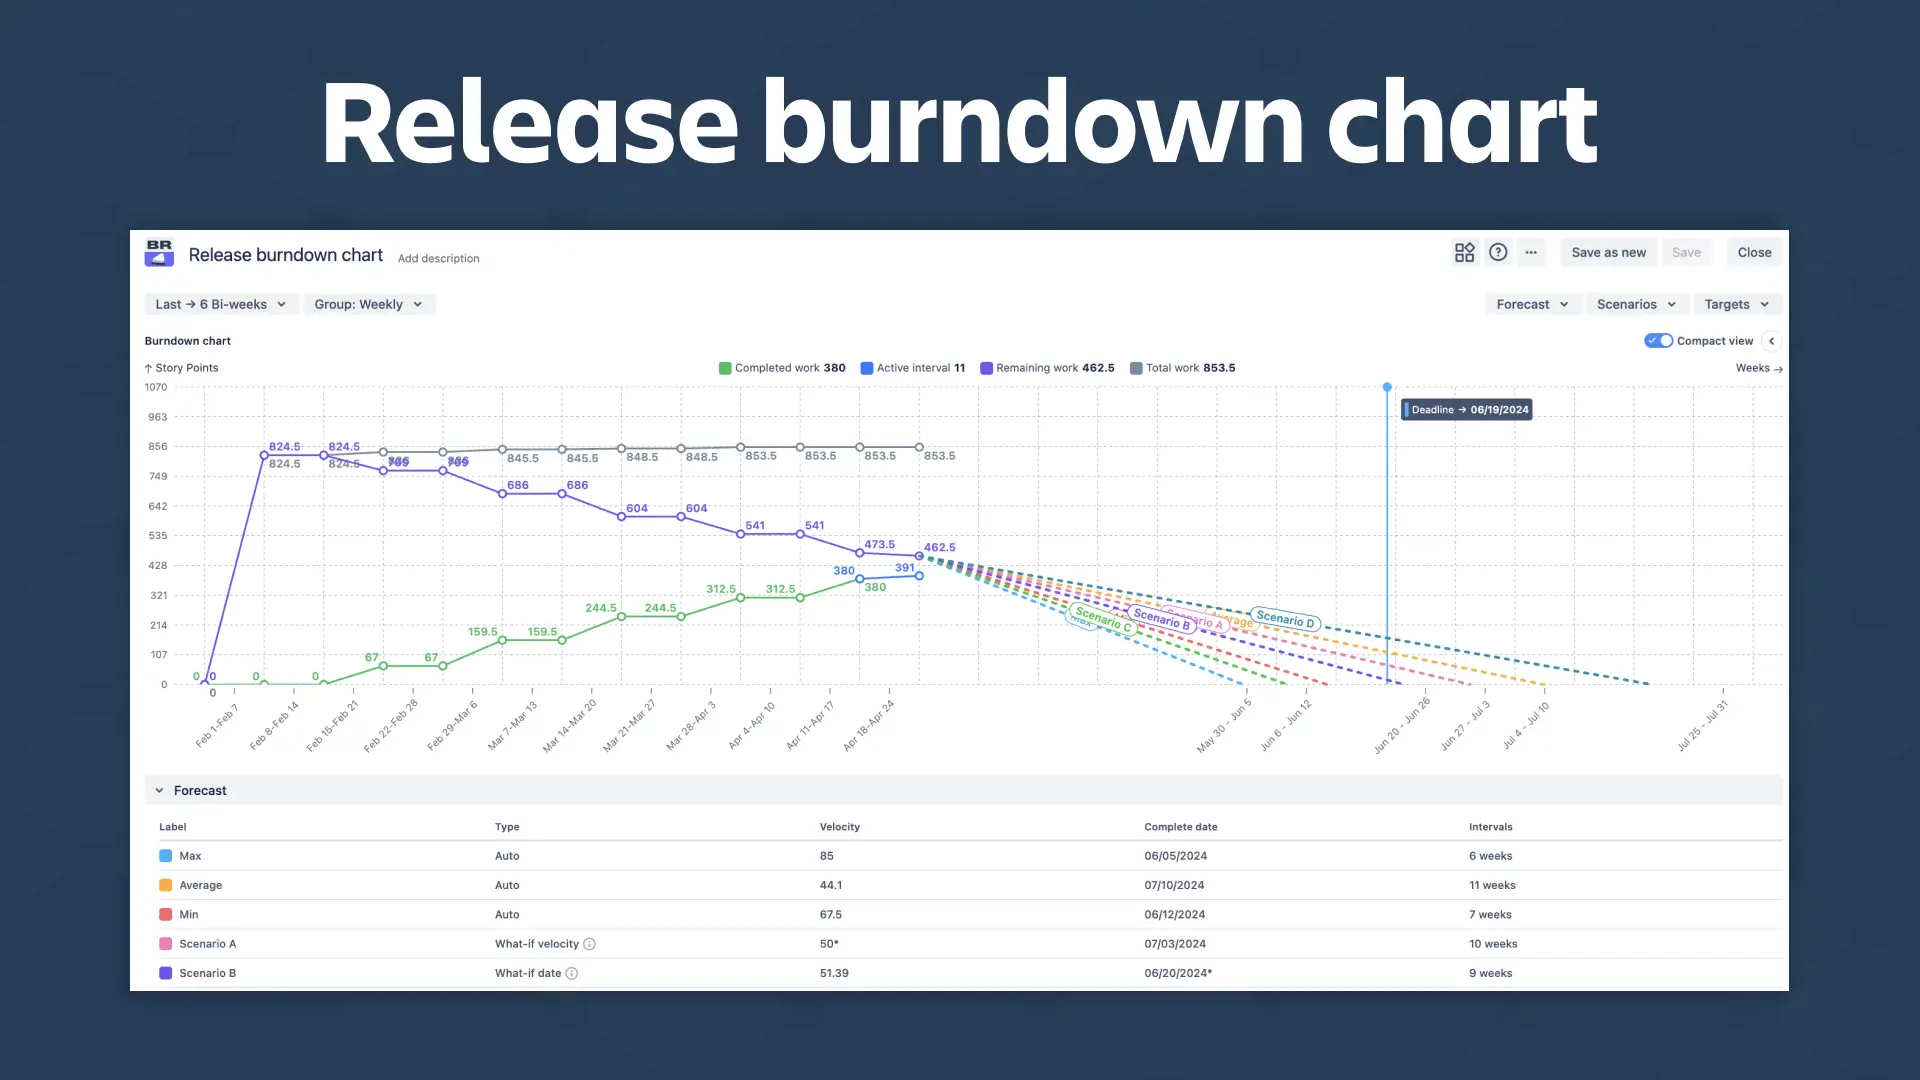
- Know if you'll deliver on time – forecast completion dates with Min/Average/Max scenarios and Monte Carlo simulations
- See scope changes as they happen – track completed, remaining, and total work over time in burnup or burndown view
- Spot delivery risks early – monitor completion %, scope change, and unestimated issues at a glance
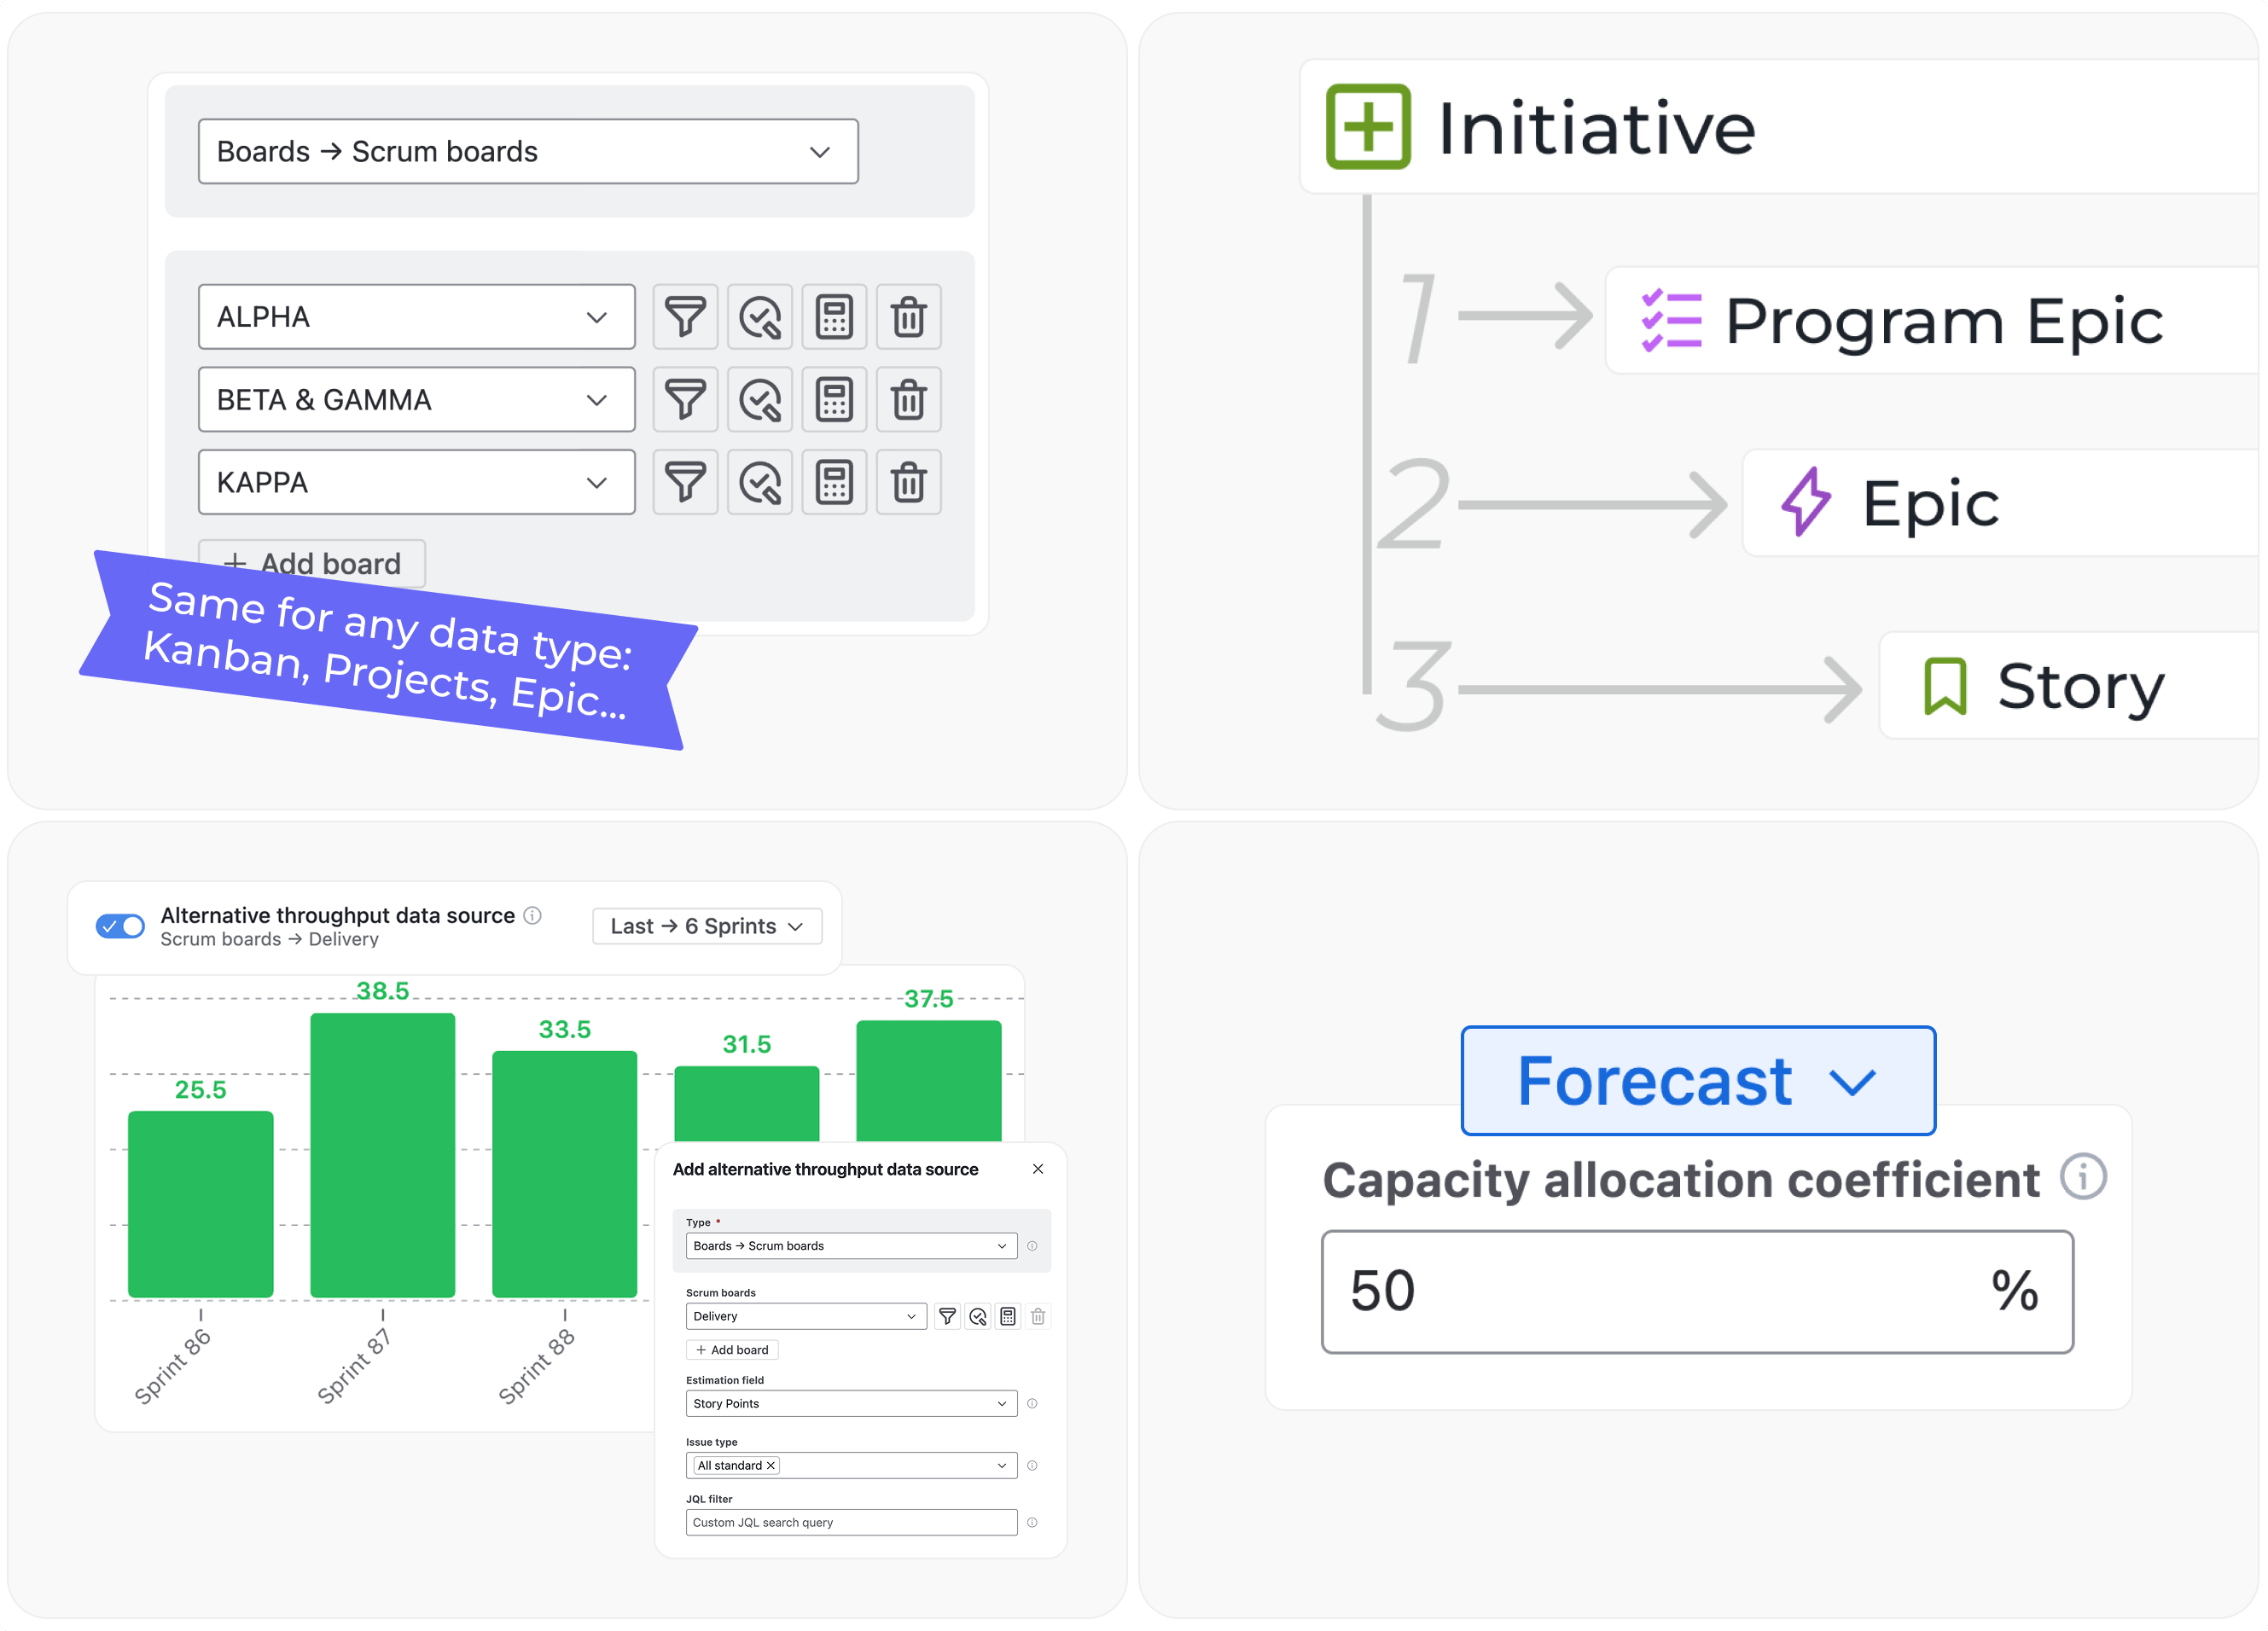
- Start in minutes, scale to portfolio – pick a template for quick setup, then aggregate data across boards, projects, and initiatives














.png)