Agile Throughput Charts
Turn delivery throughput data into actionable insights
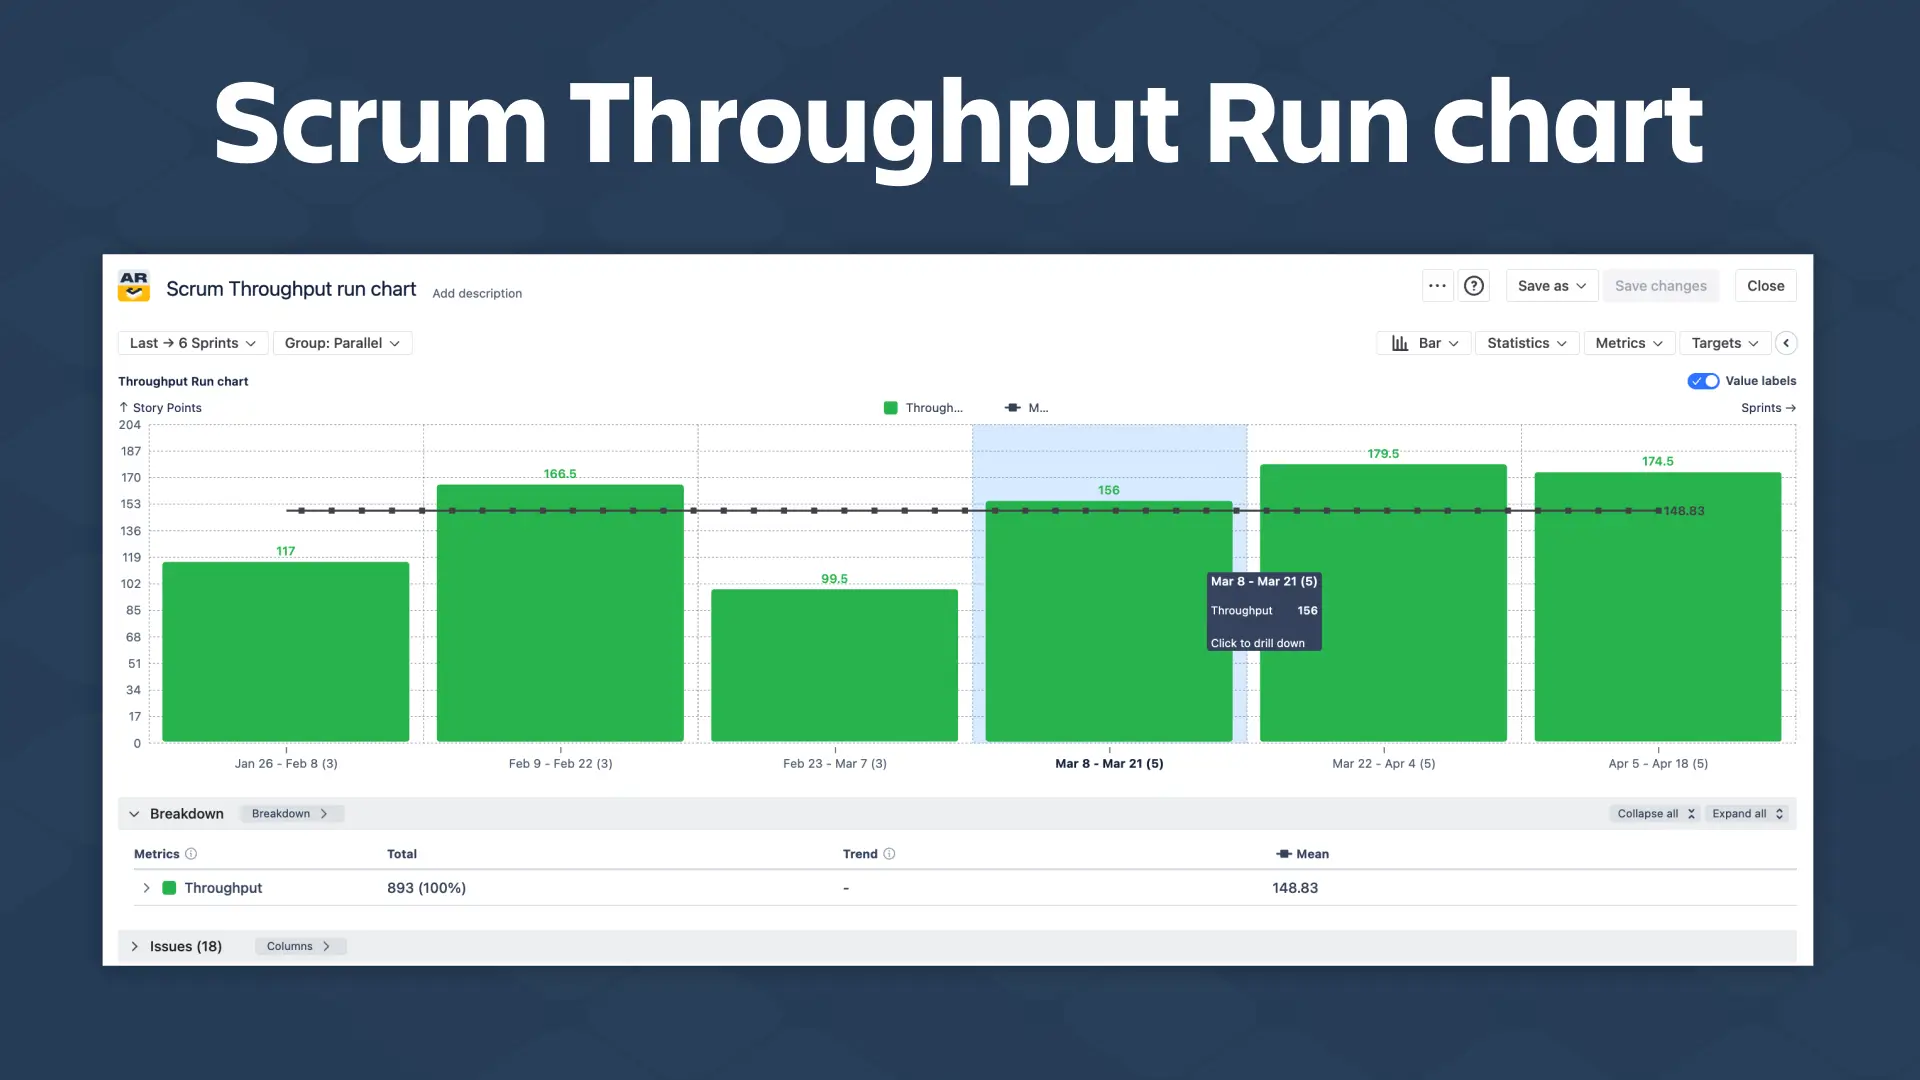
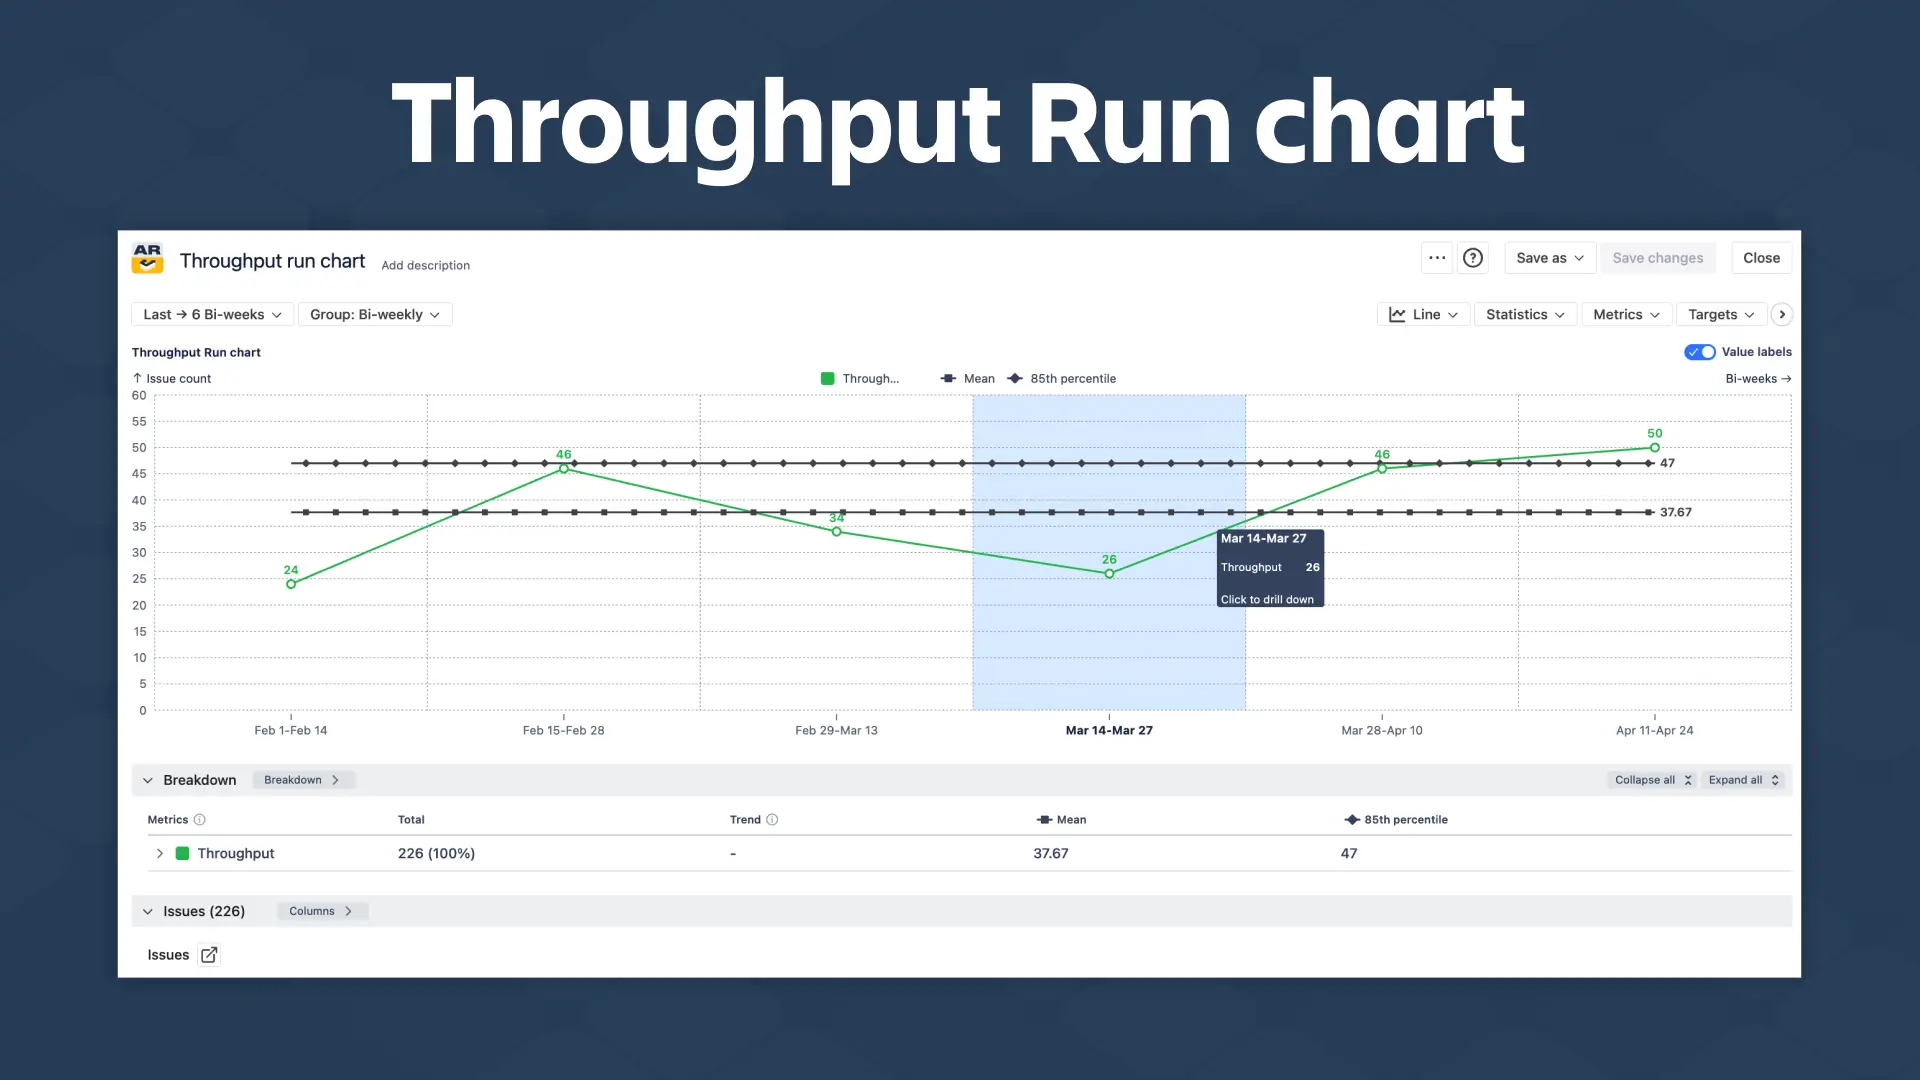
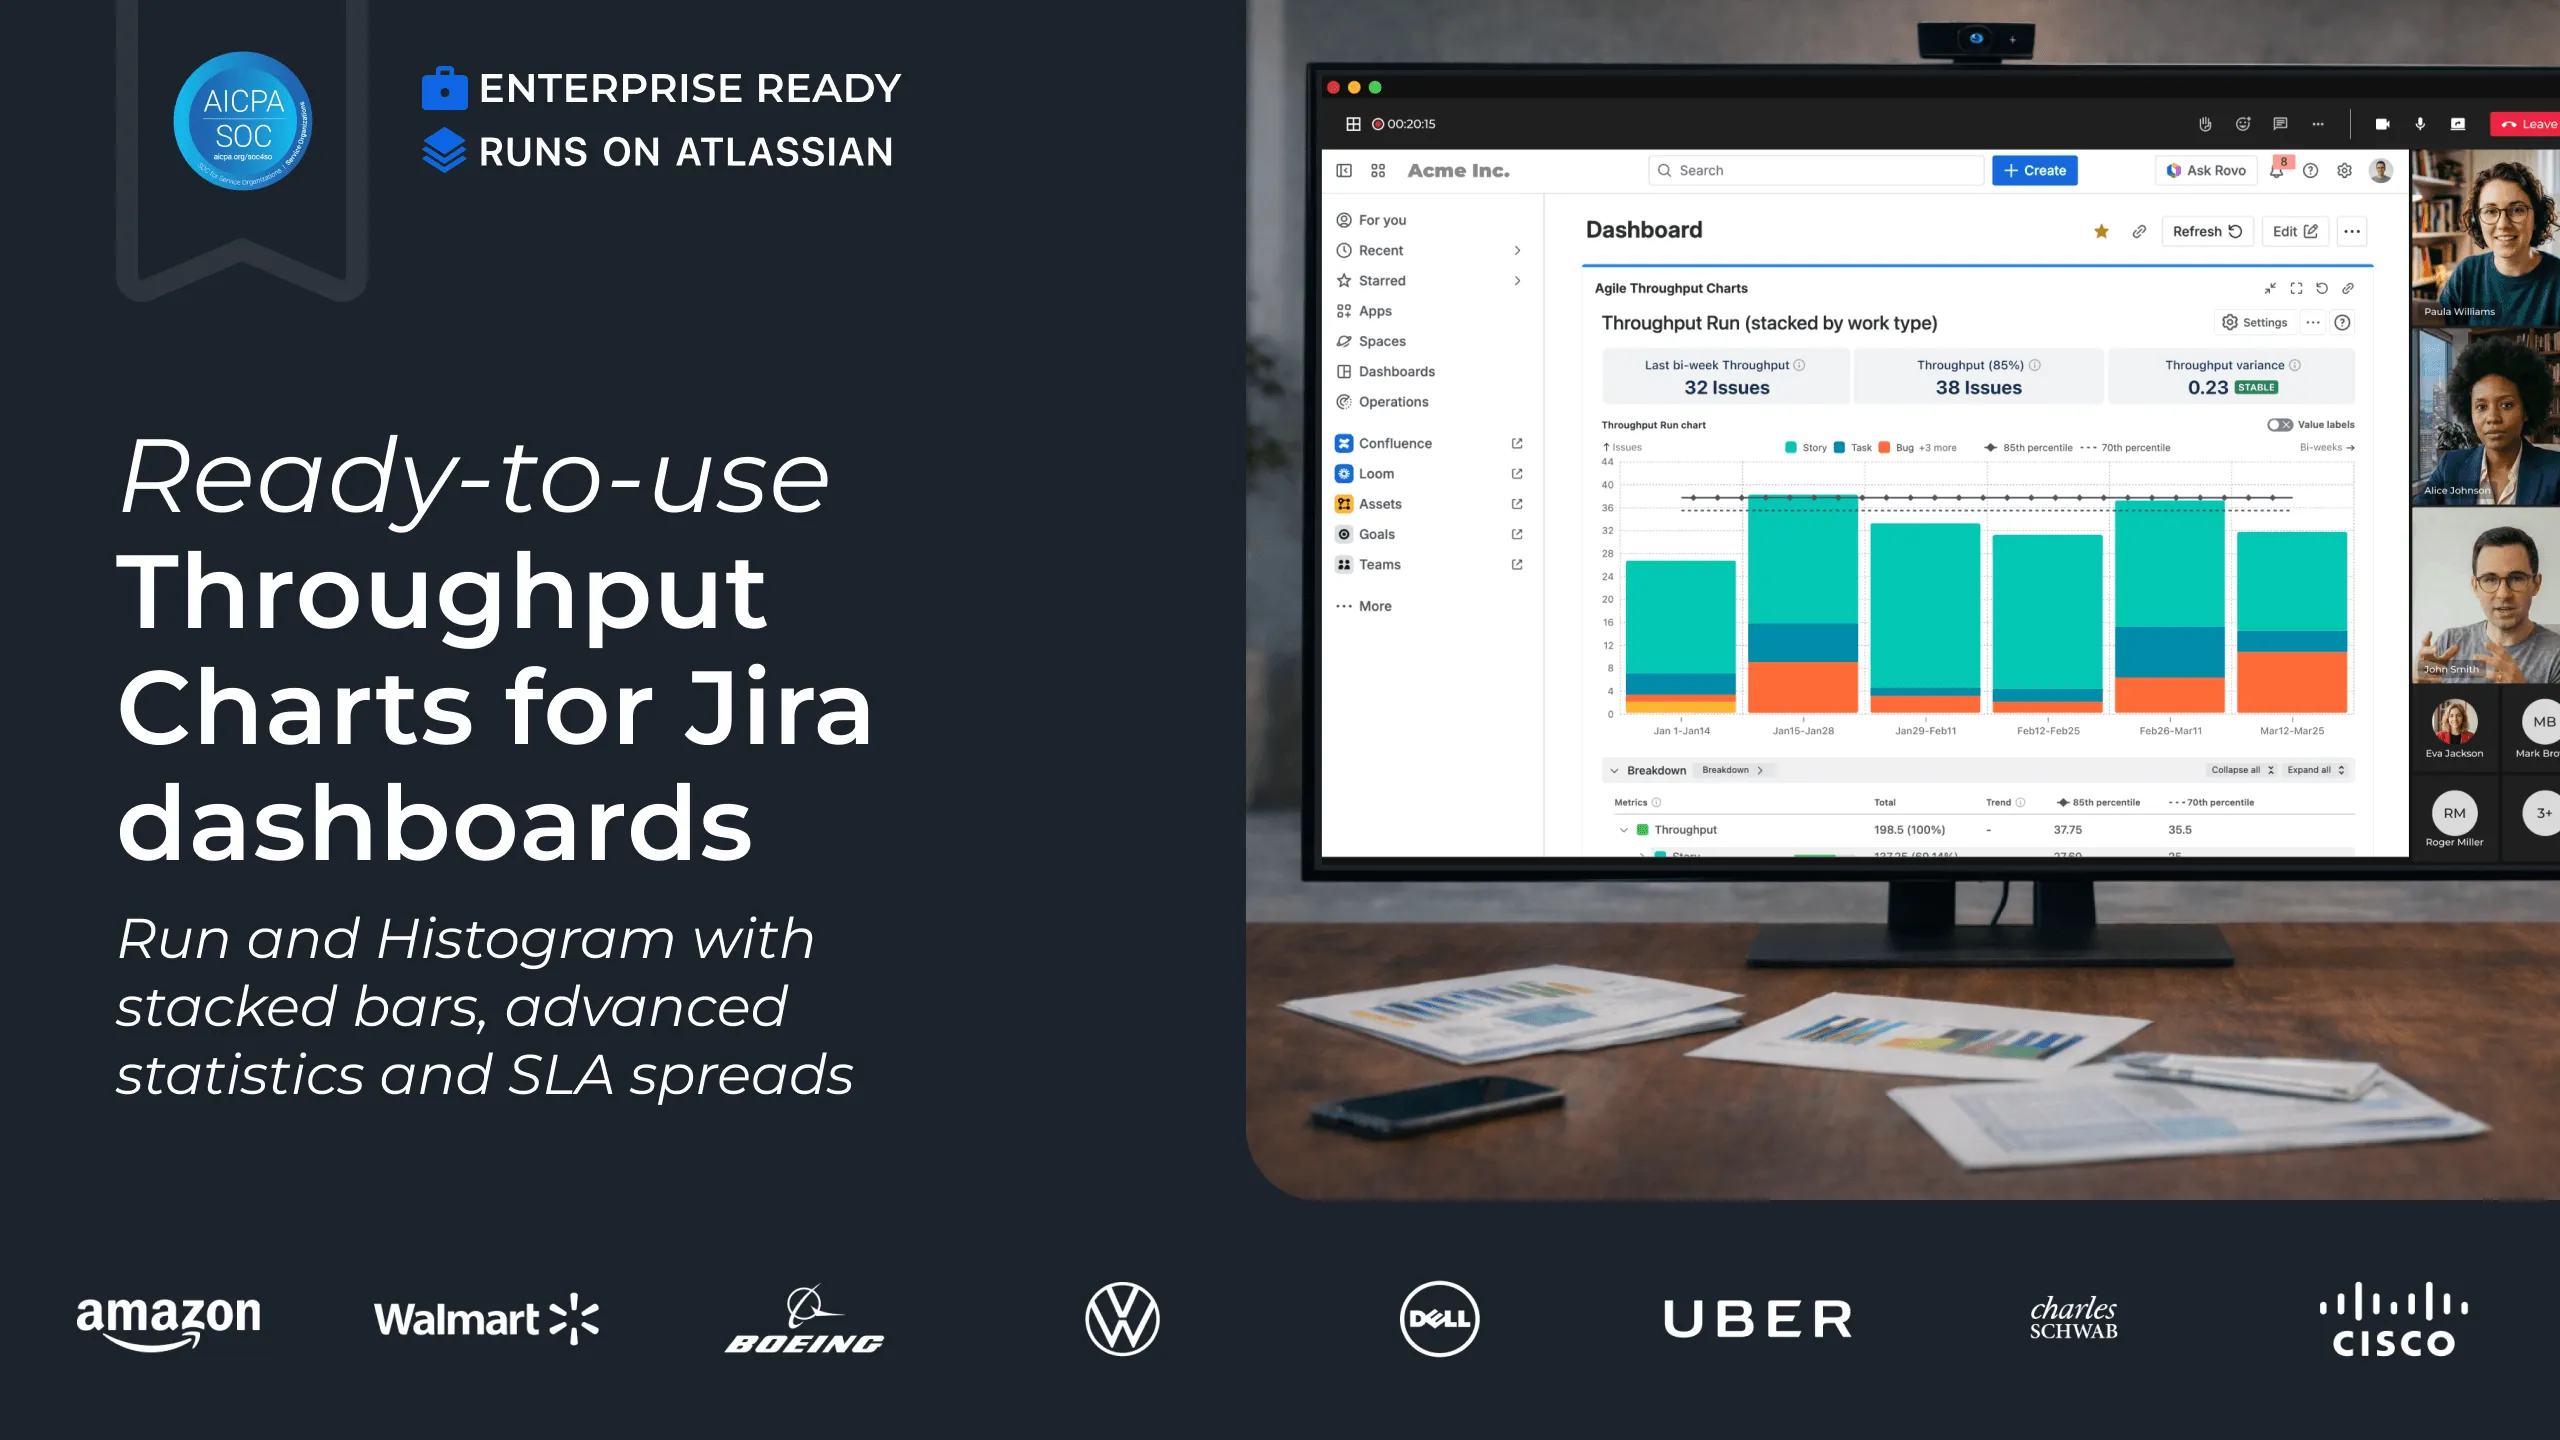
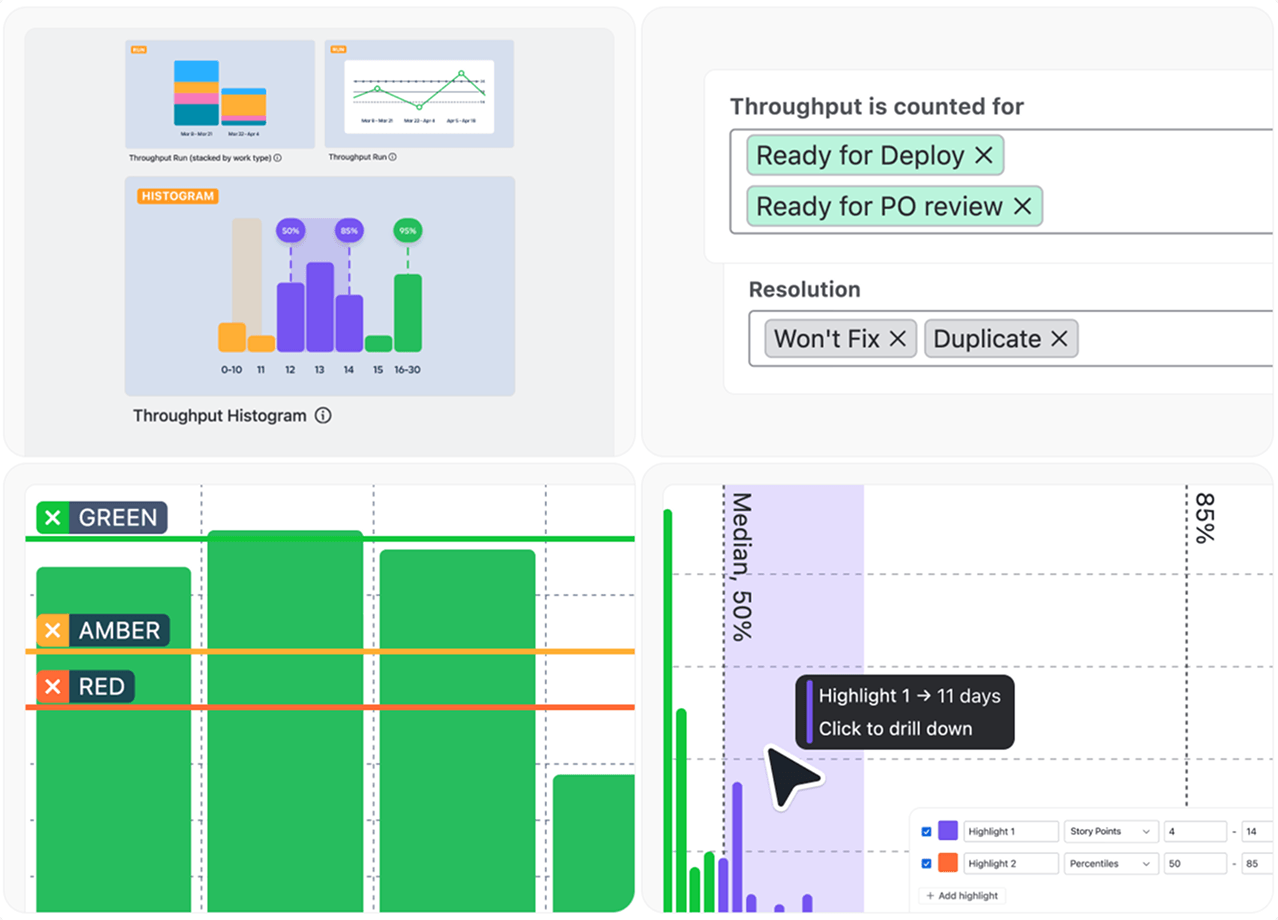
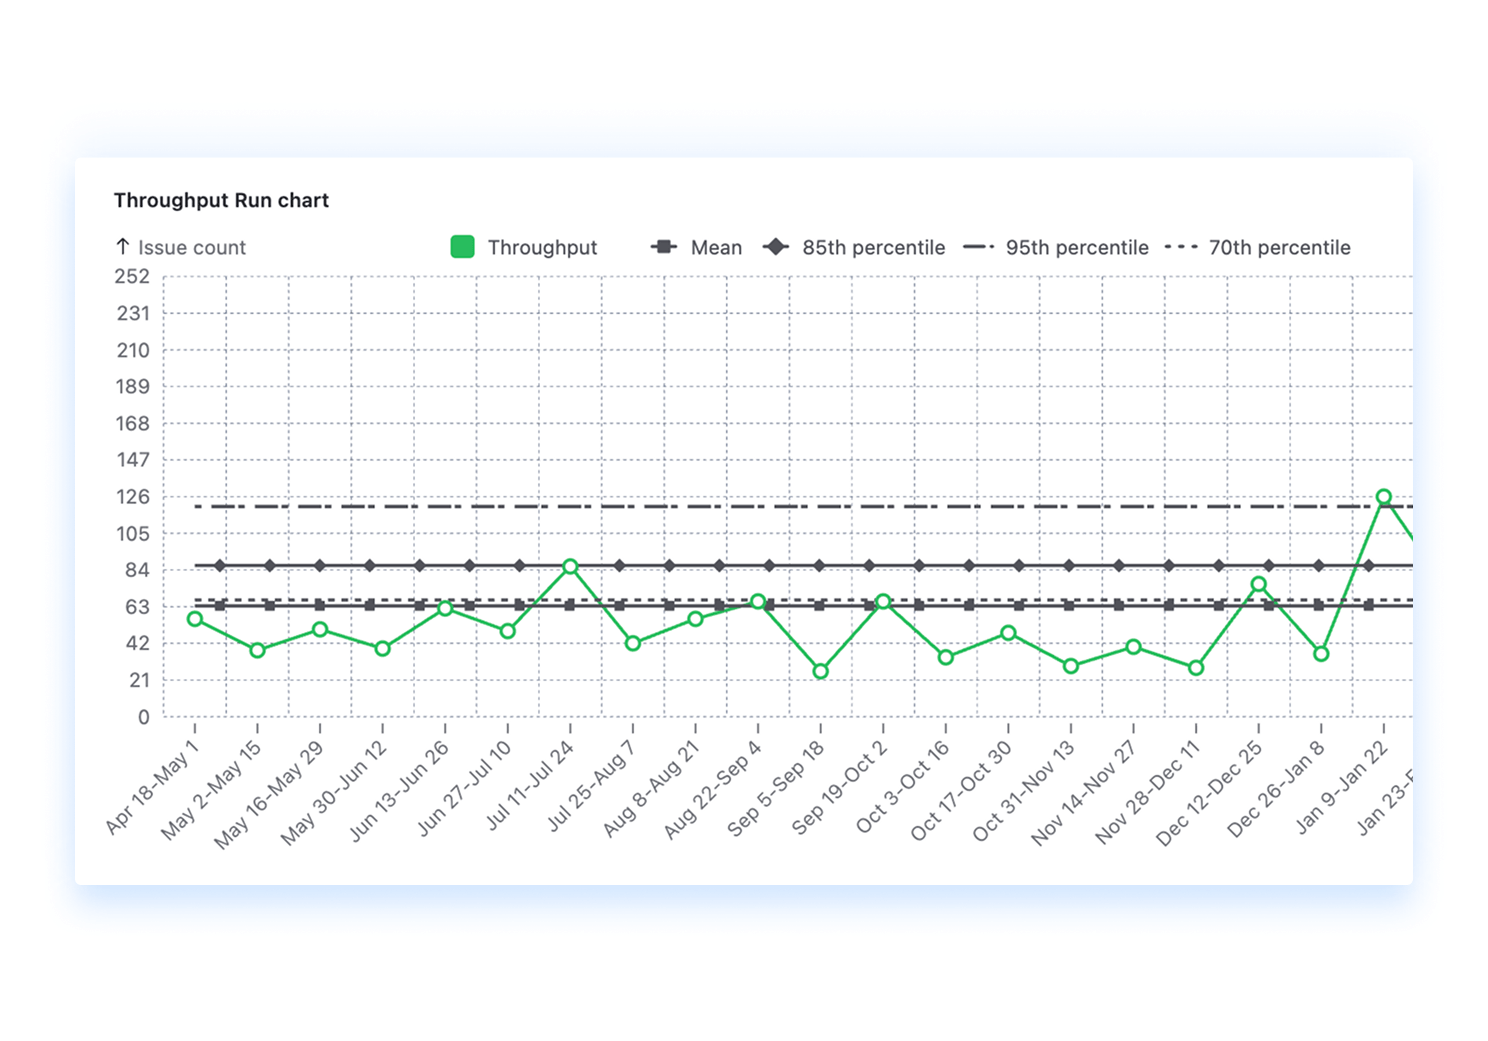
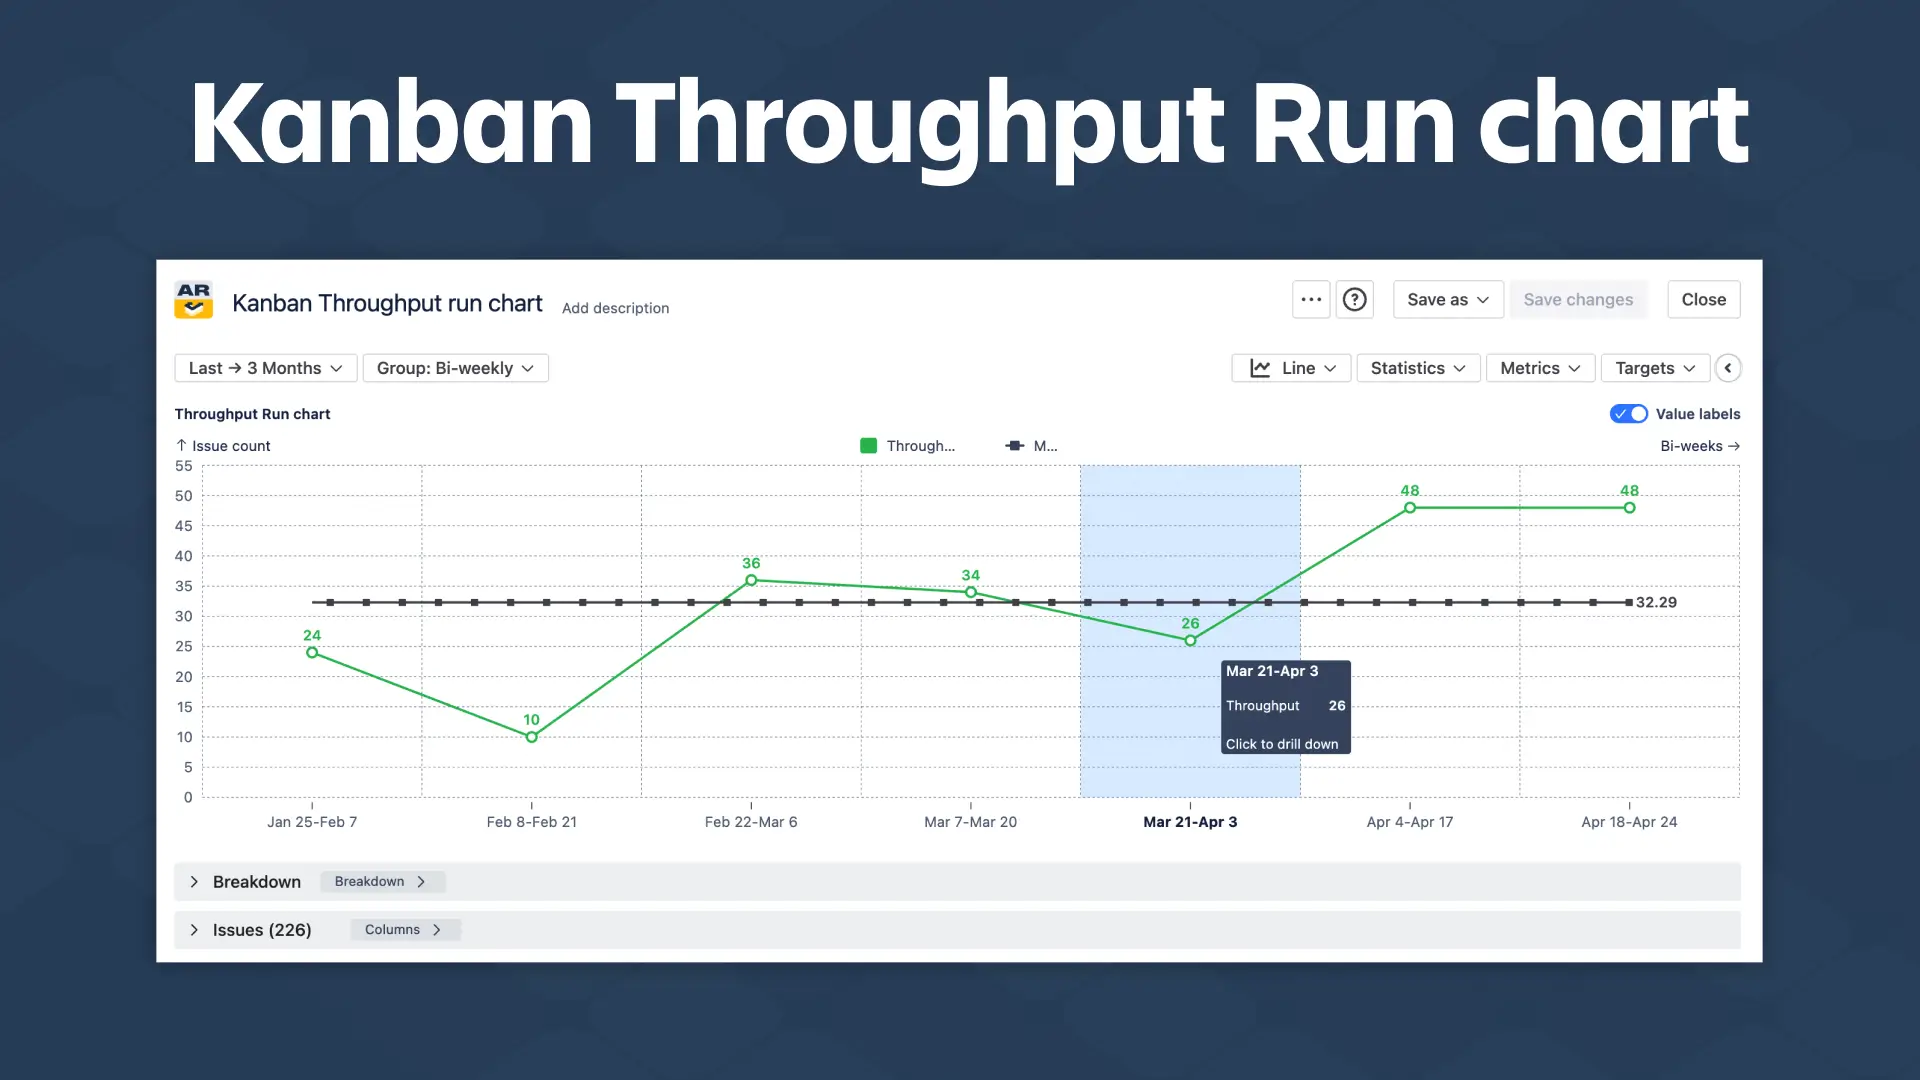
- Track how much work your team delivers over time using real historical throughput data from Jira
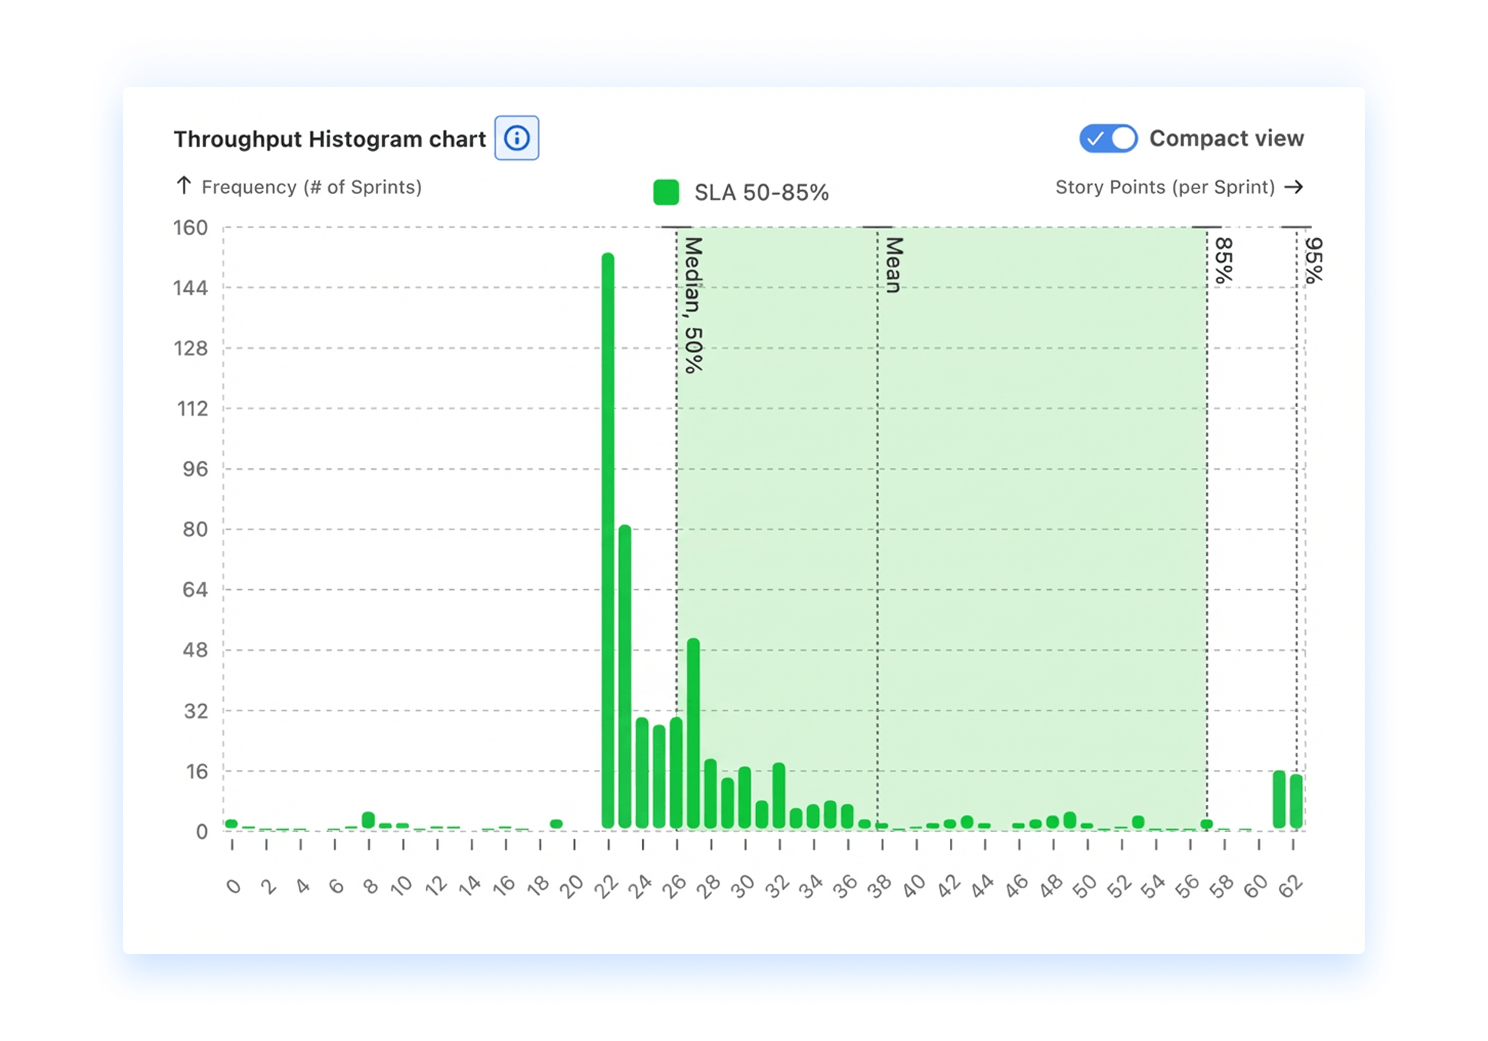
- Identify trends, stability, and variability with Throughput Run and Histogram charts to understand delivery patterns
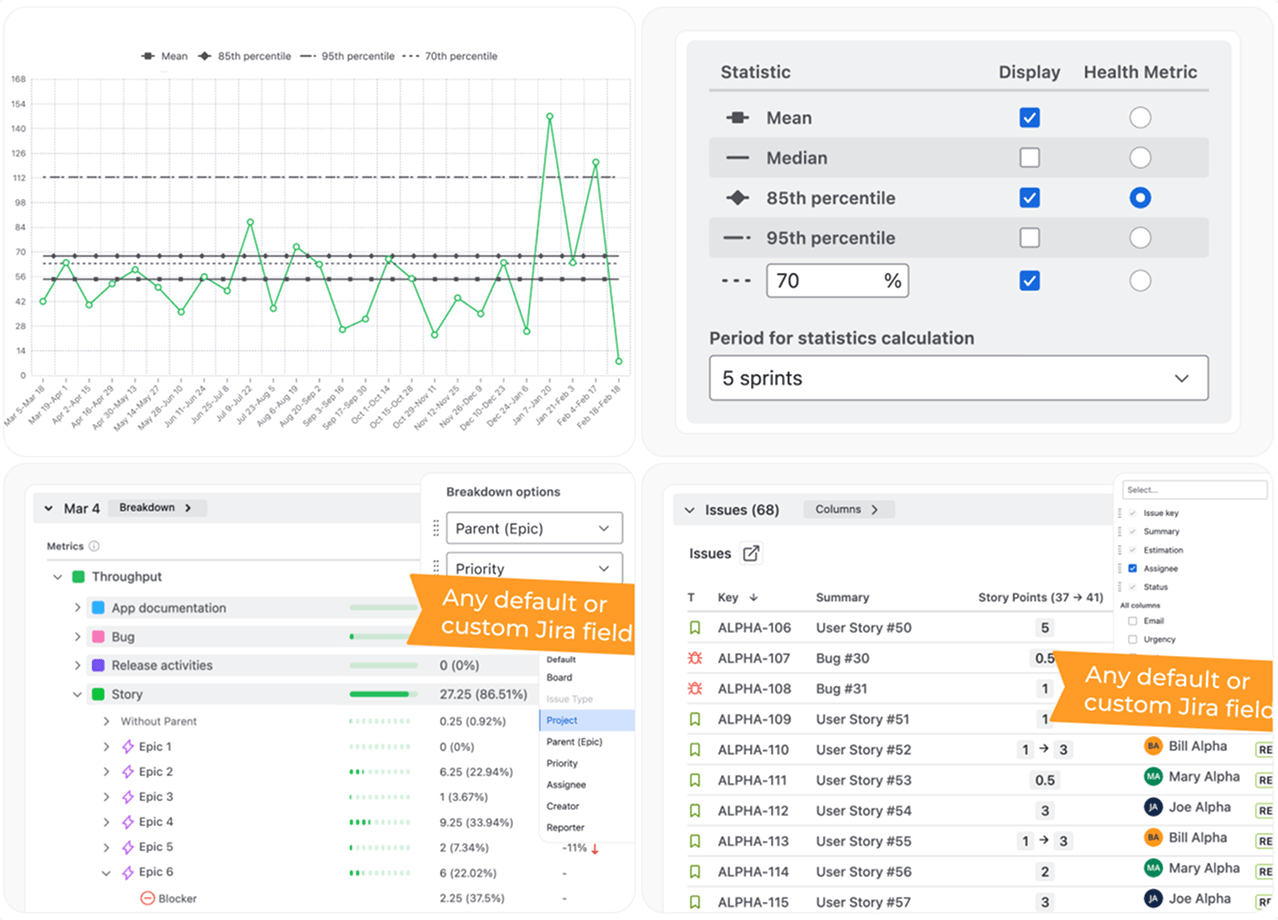
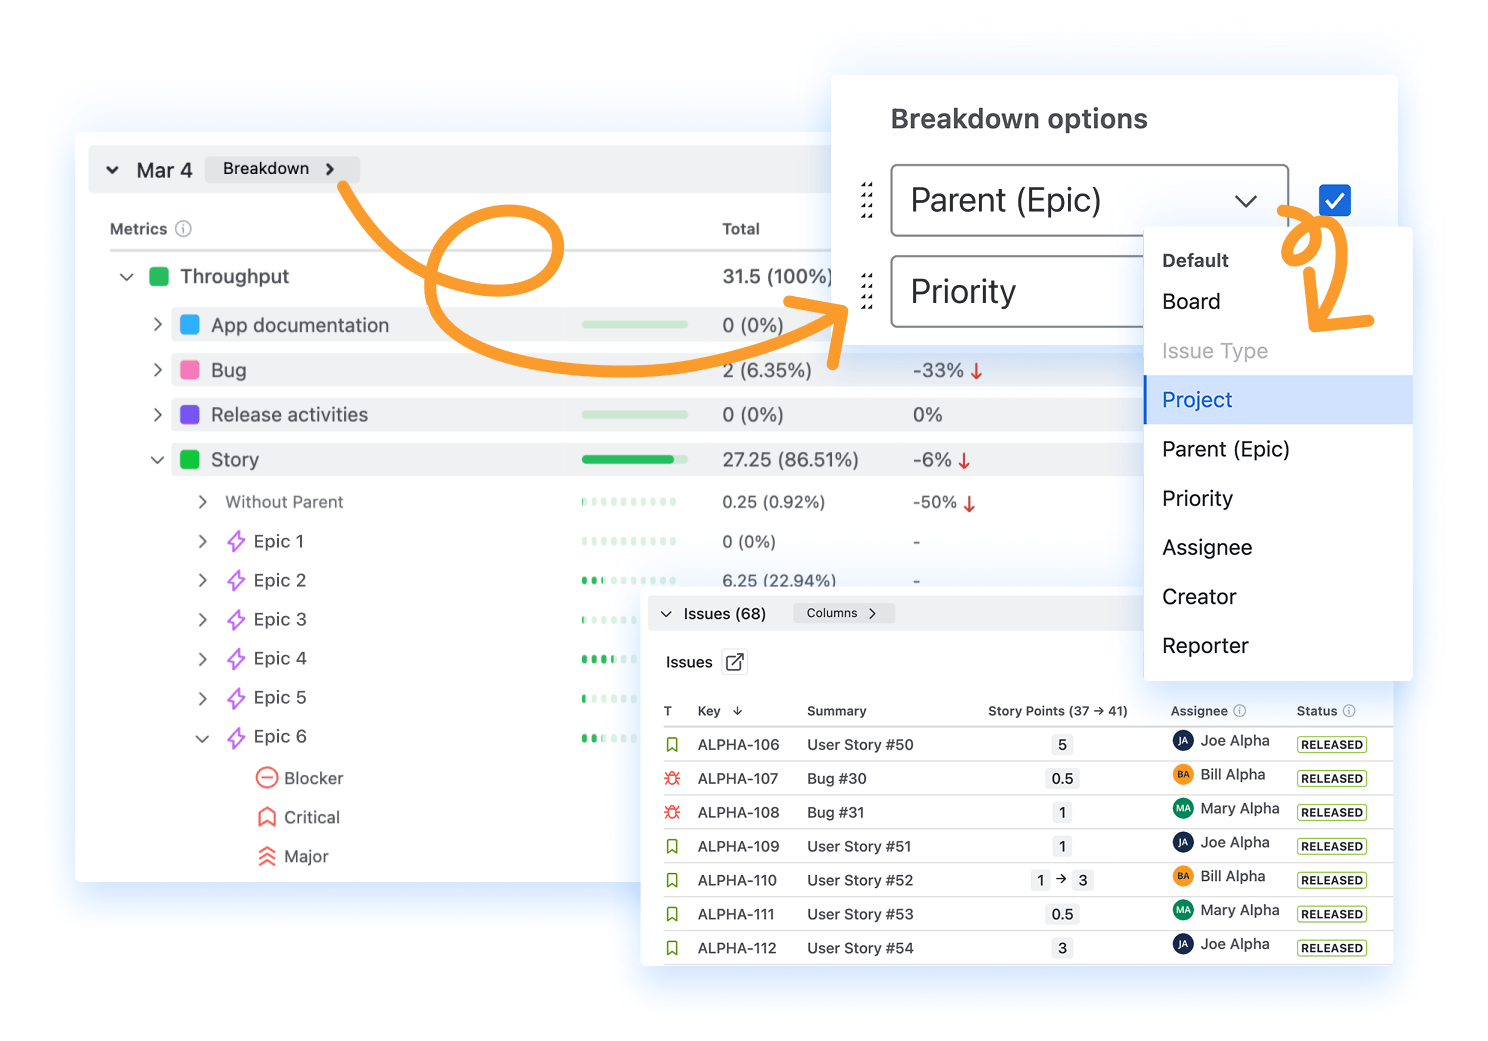
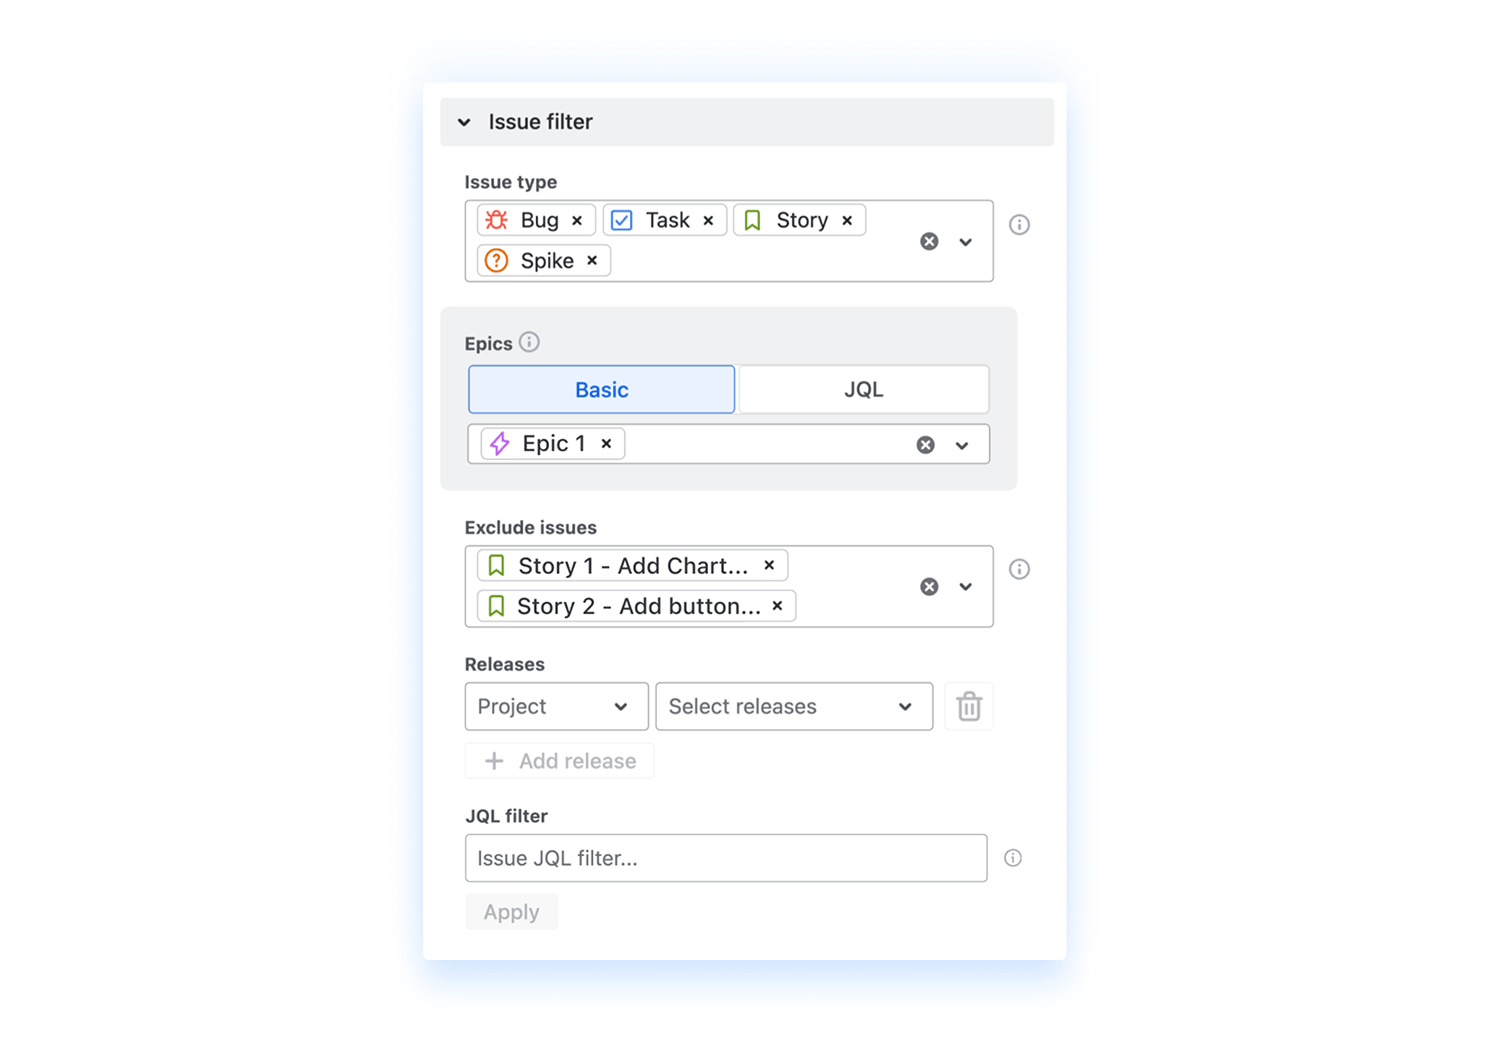
- See where capacity is spent across teams, issue types, or priorities with stacked views and breakdowns
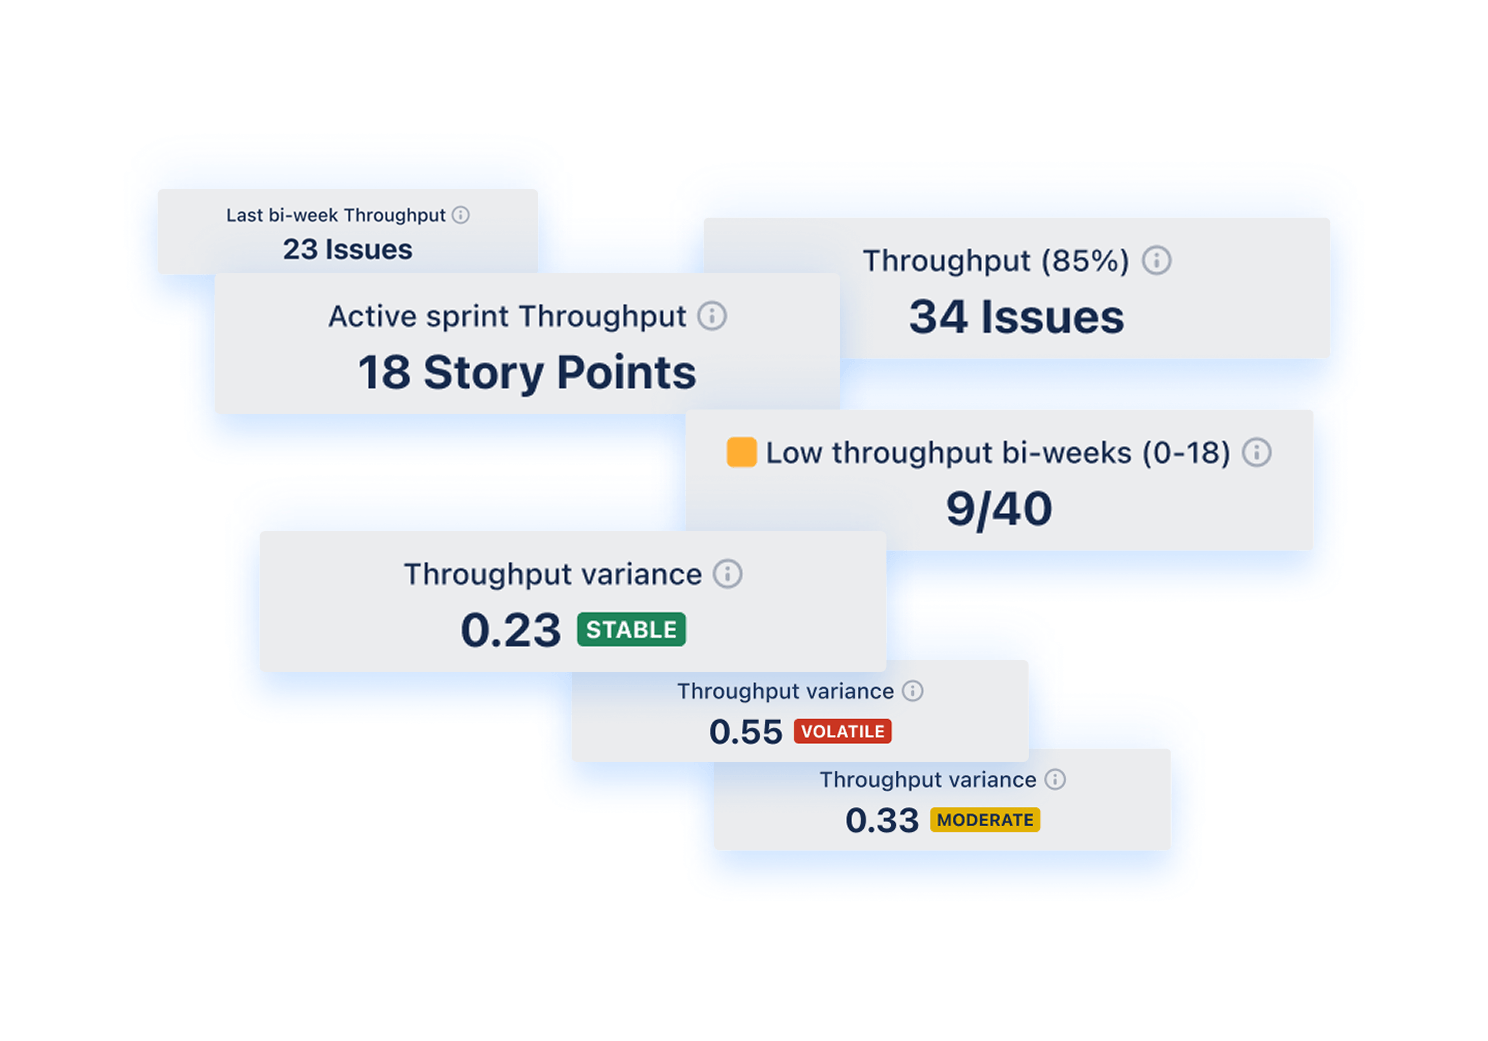
- Make confident planning decisions by analyzing throughput consistency, ranges, and performance signals


.png)
.png)