Agile Monte Carlo Charts
Turn historical delivery data into probability-based forecasts you can trust.
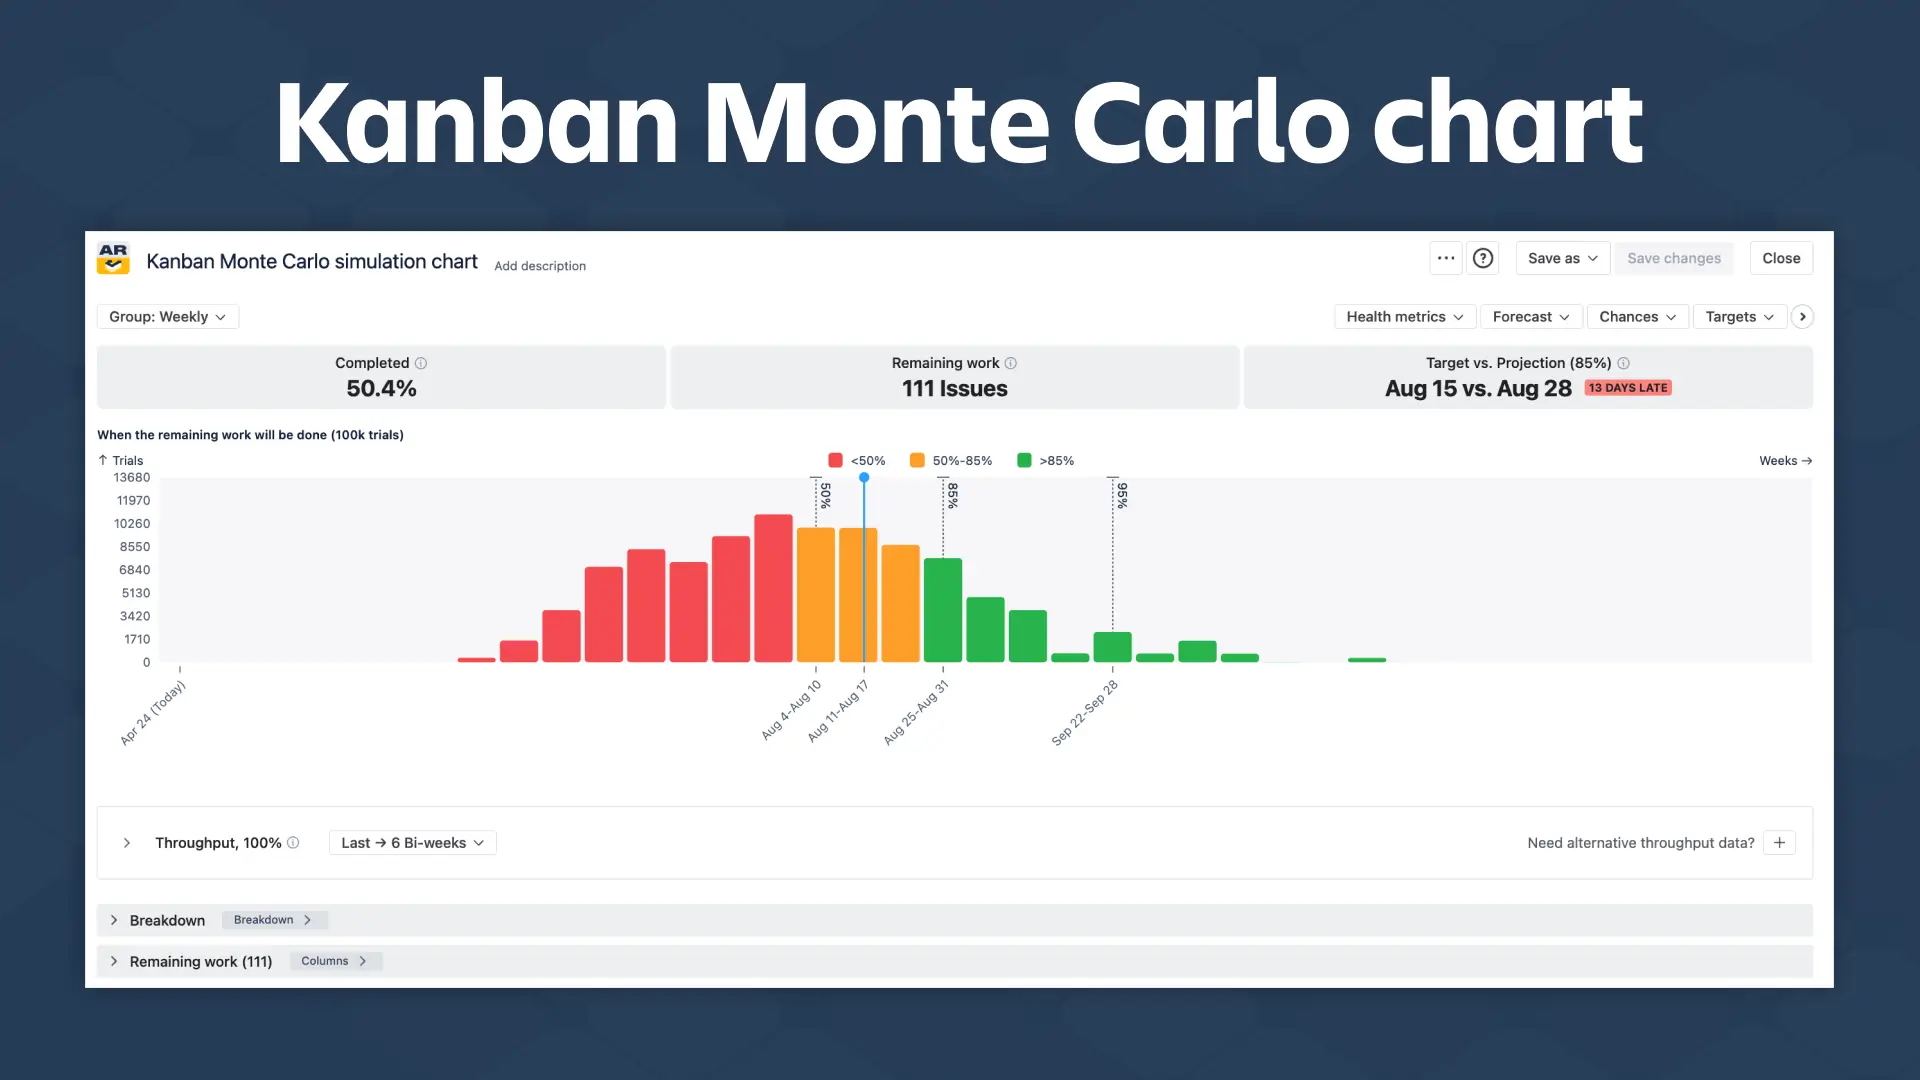
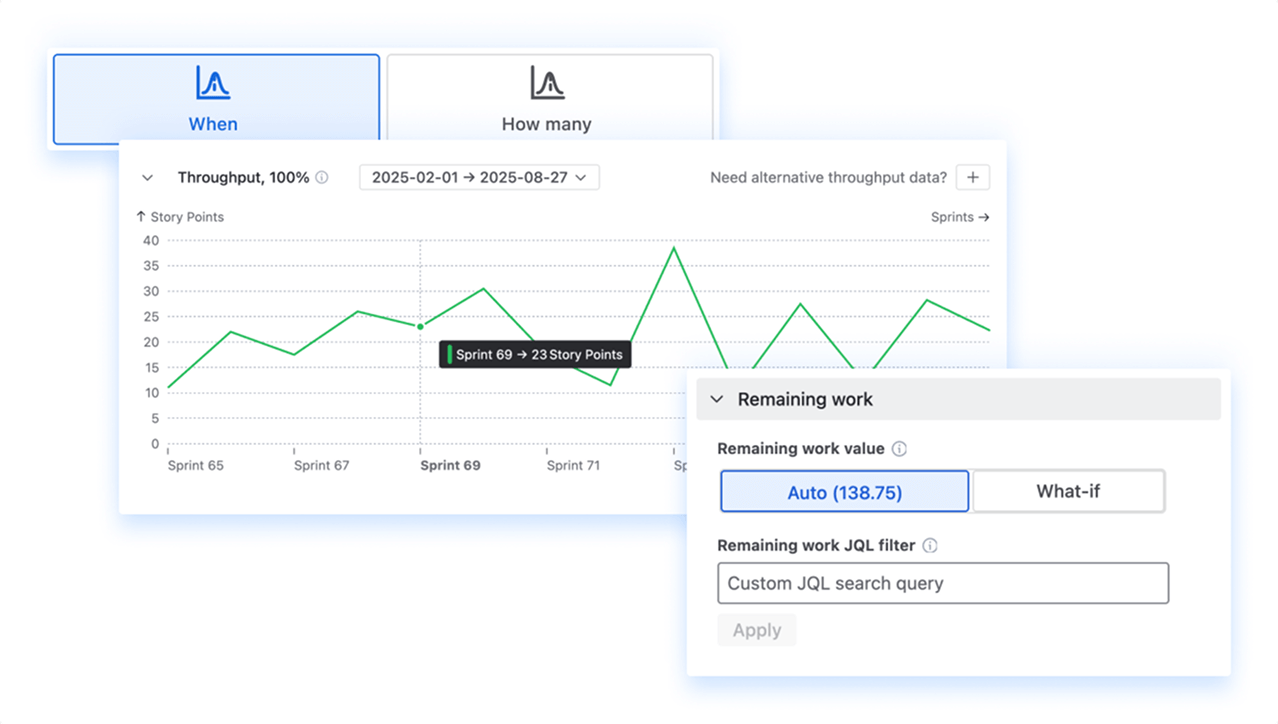
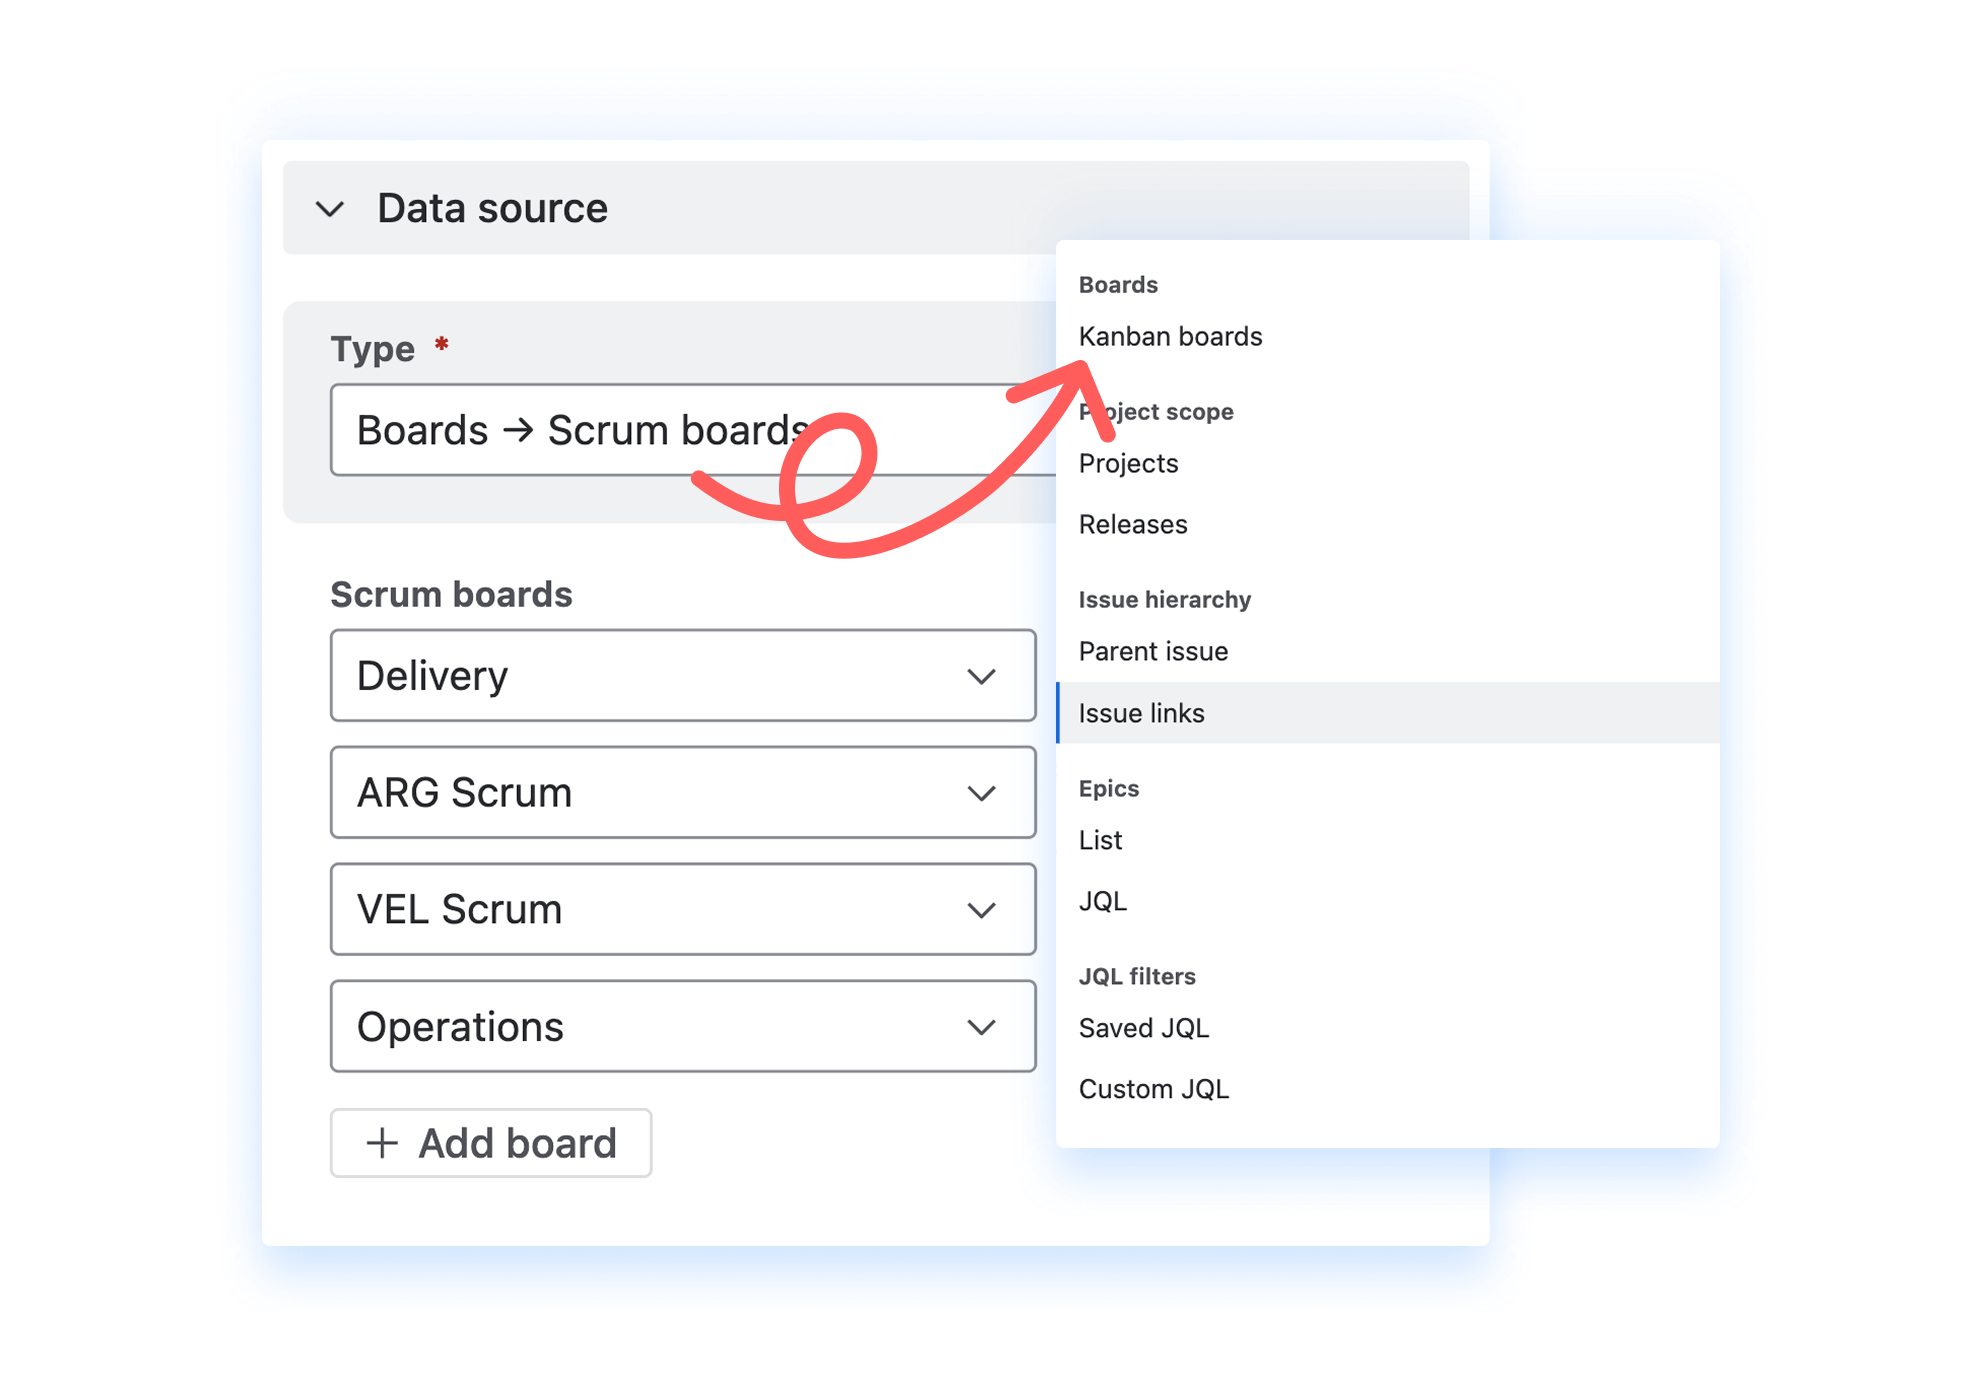
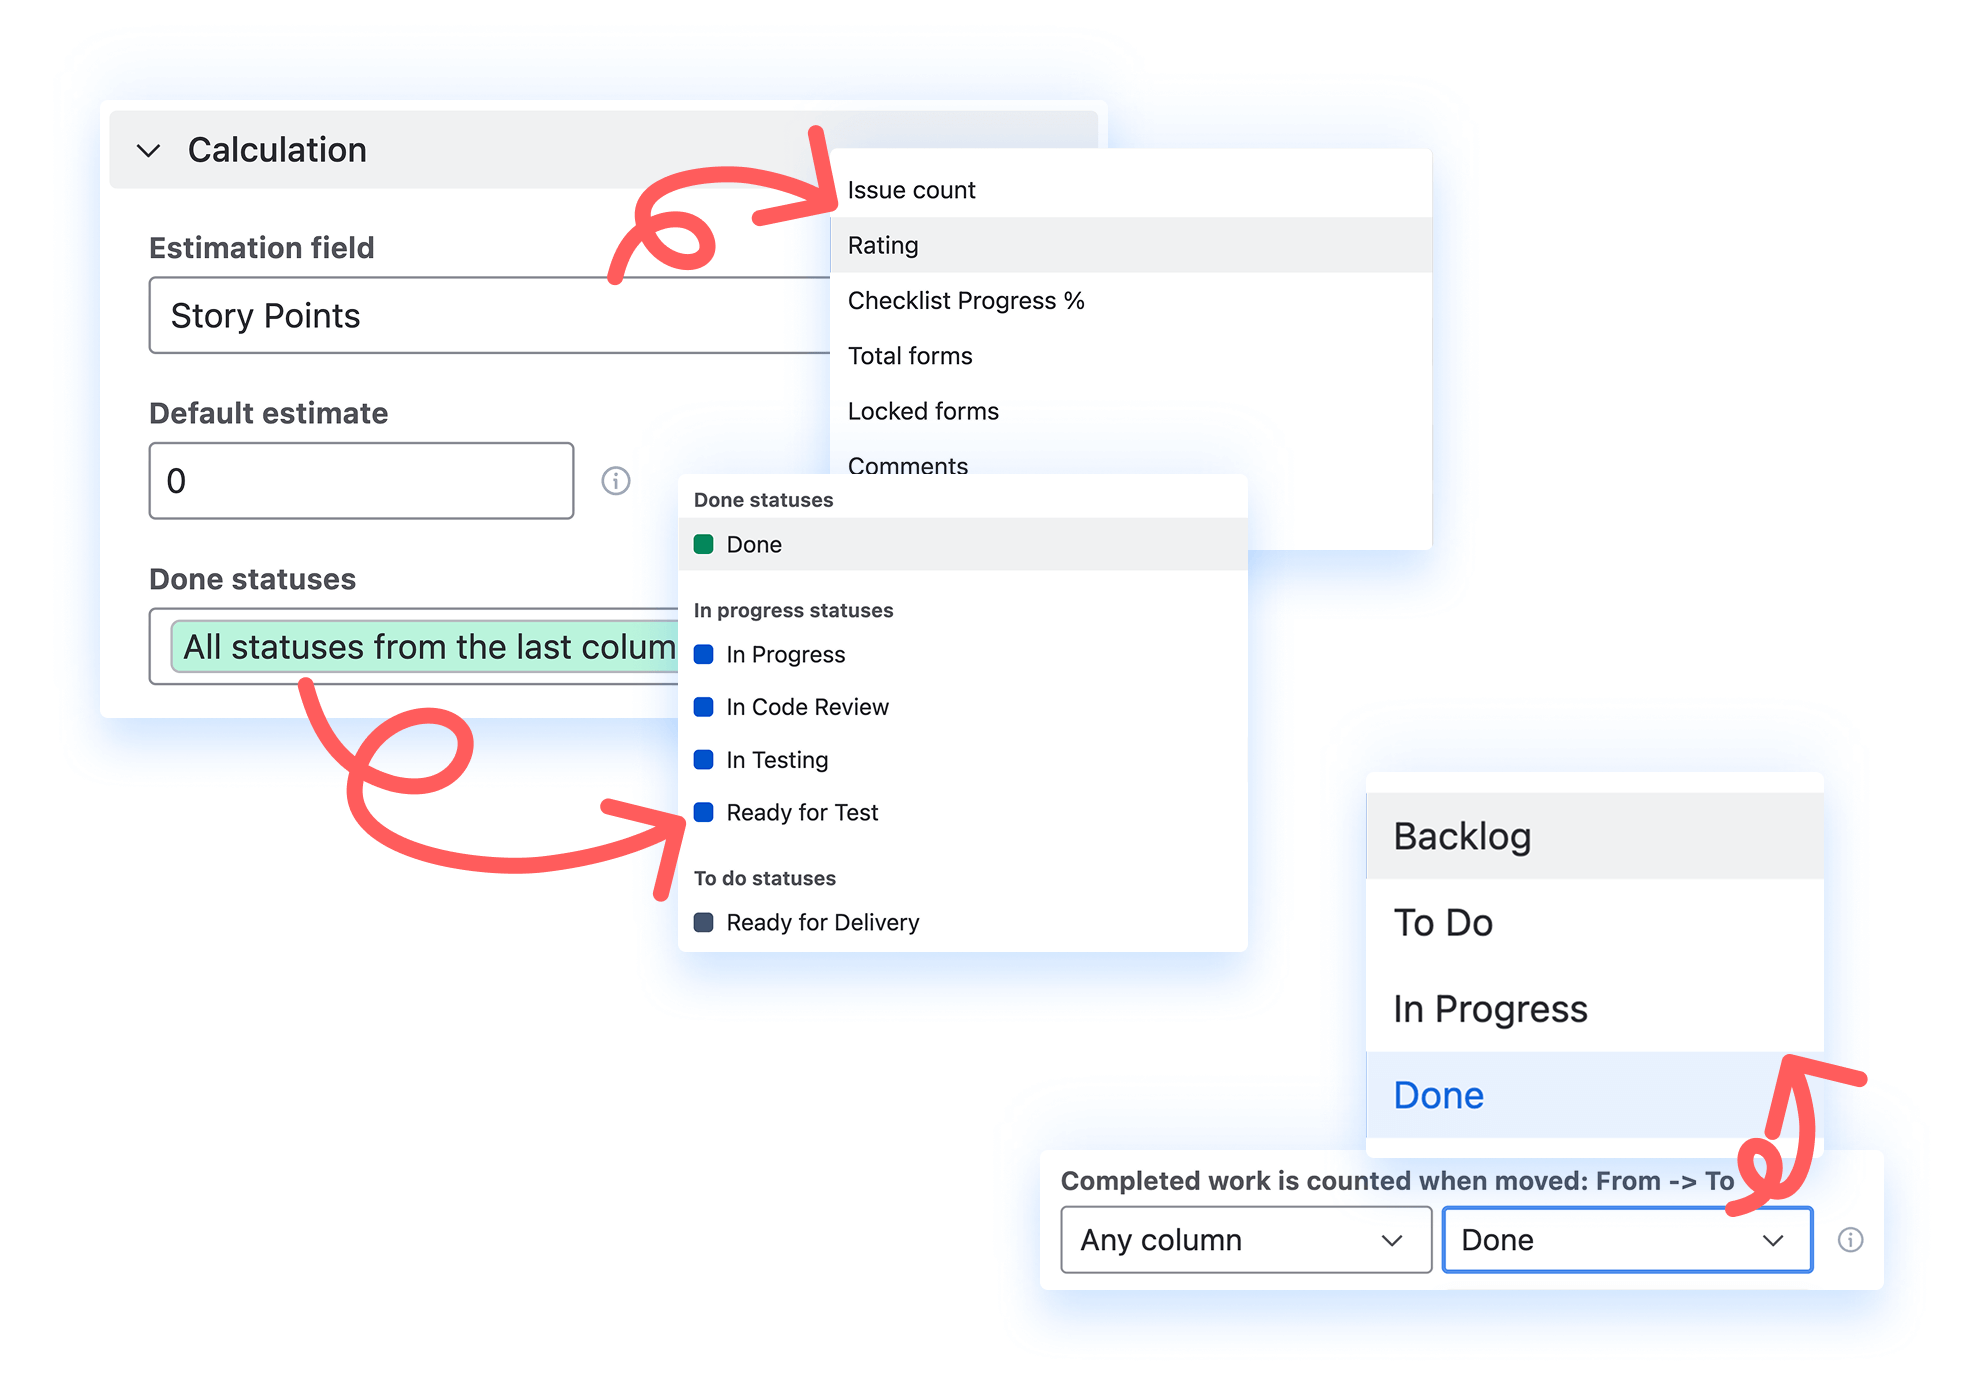
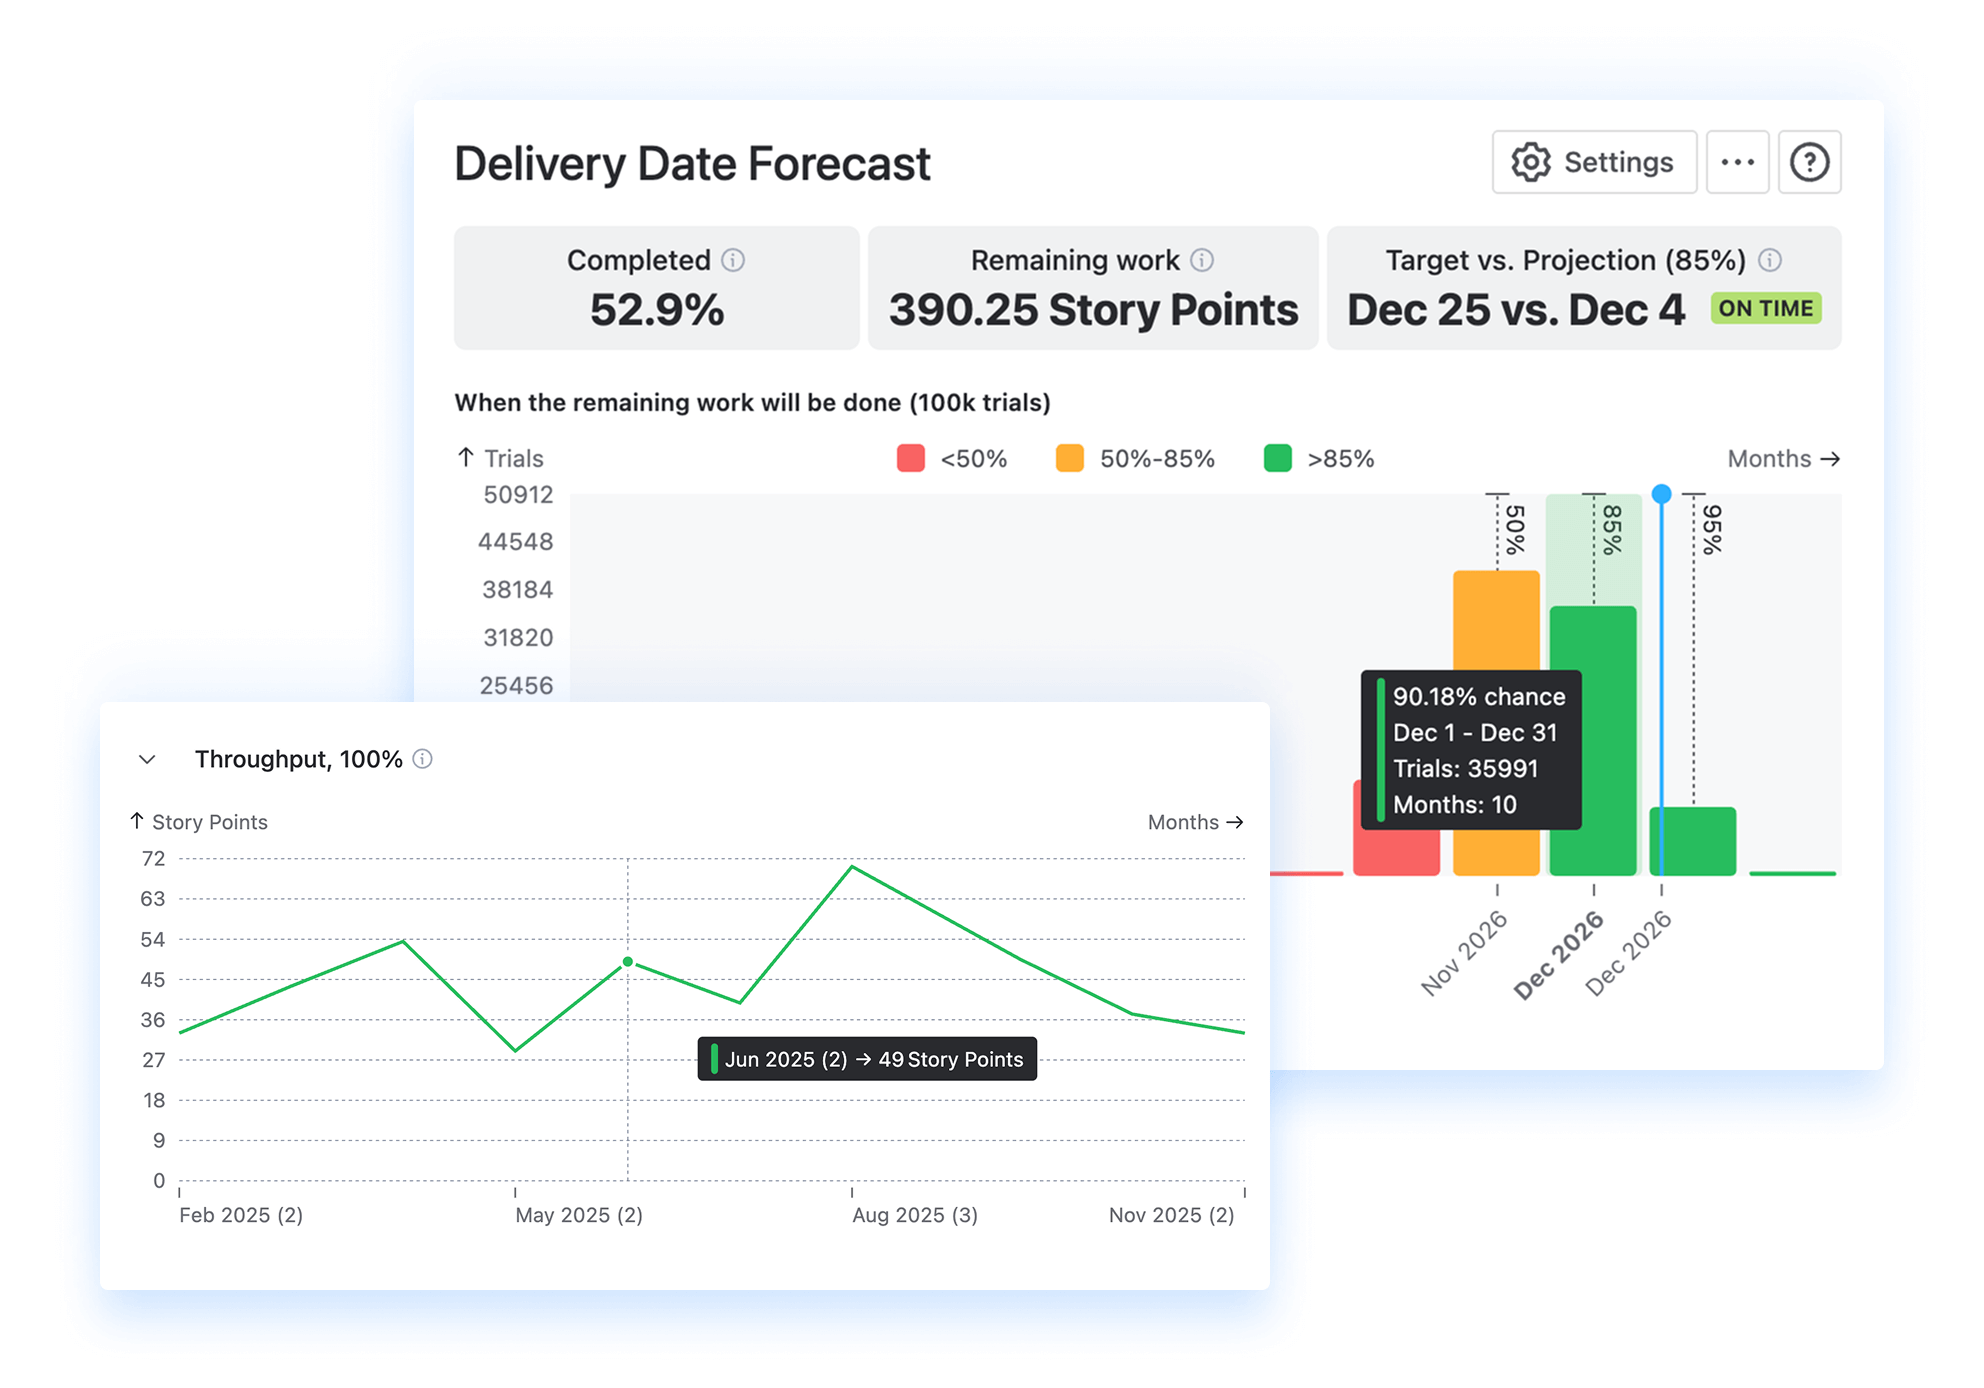
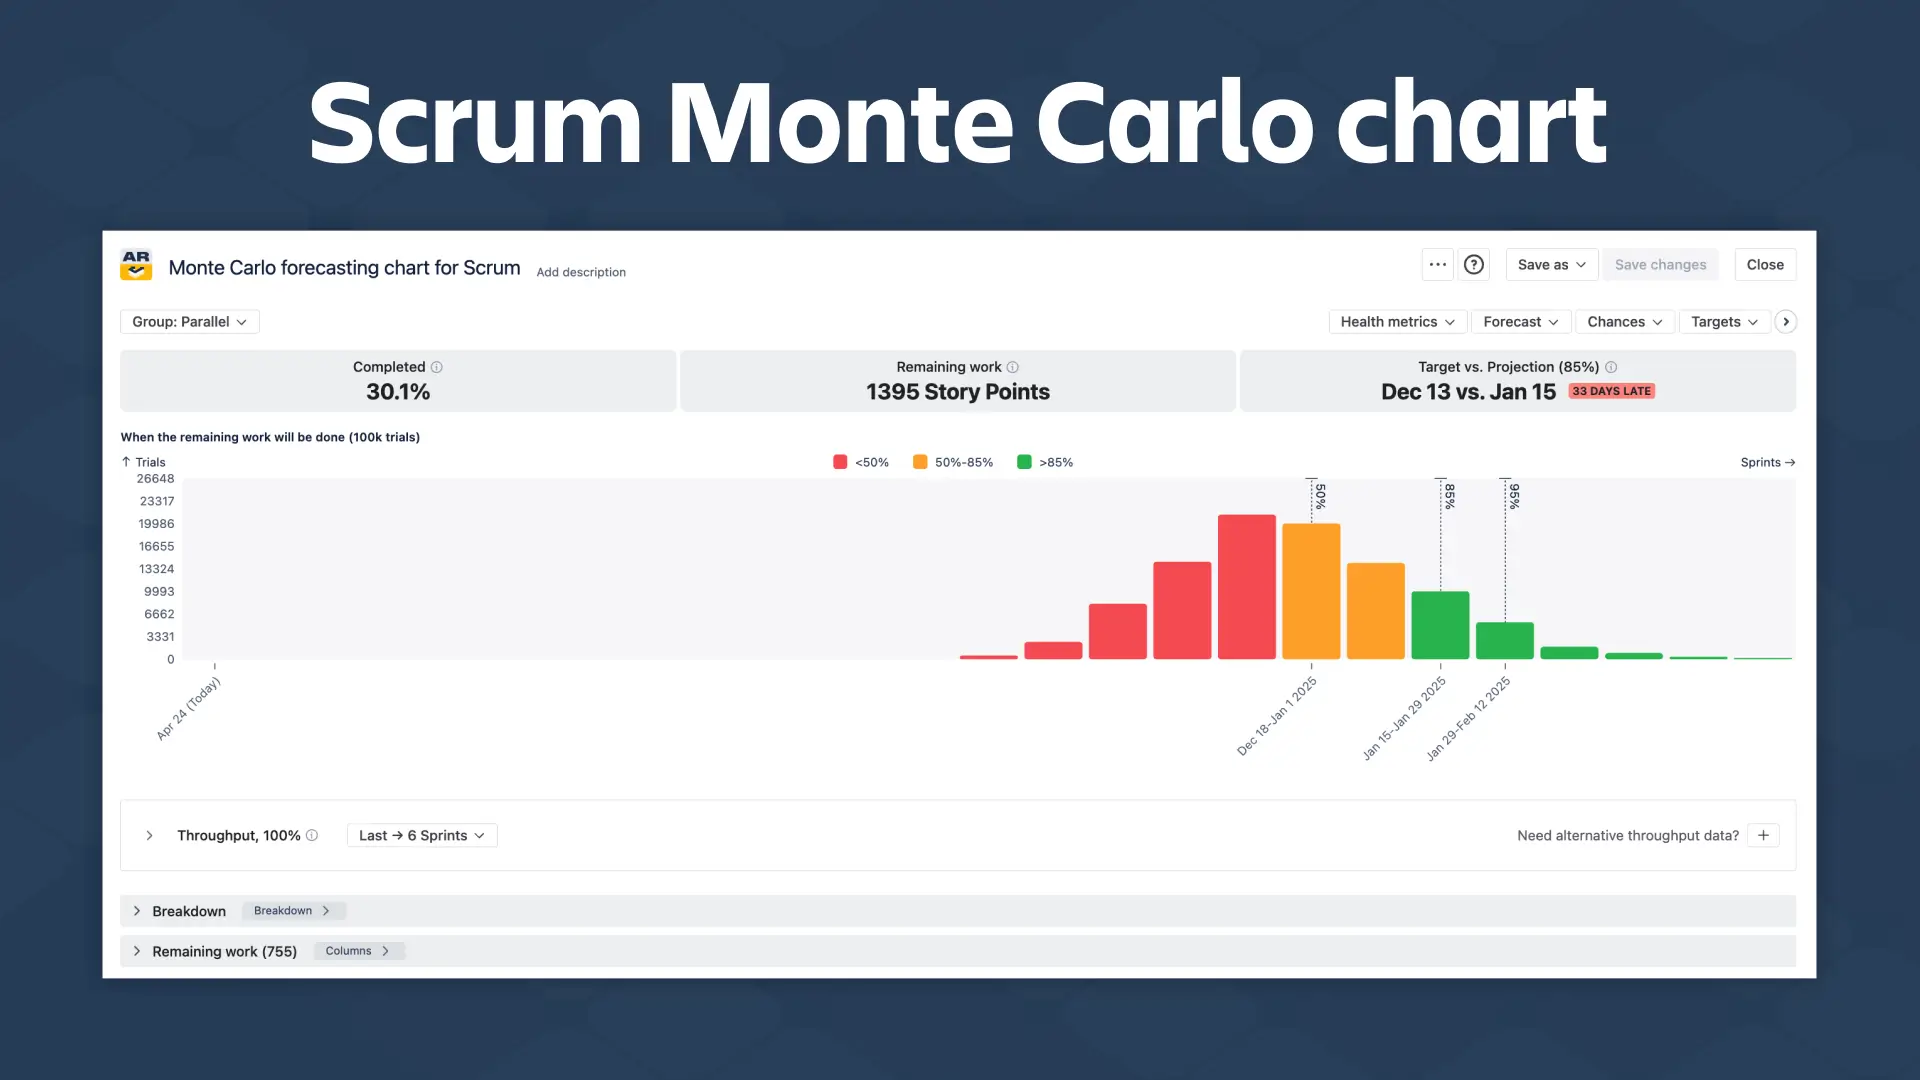
- Run probability-based Monte Carlo simulations to forecast delivery outcomes using your team’s real historical throughput
- Estimate delivery dates with the “When” chart or commit to scope confidently using the “How Many” chart
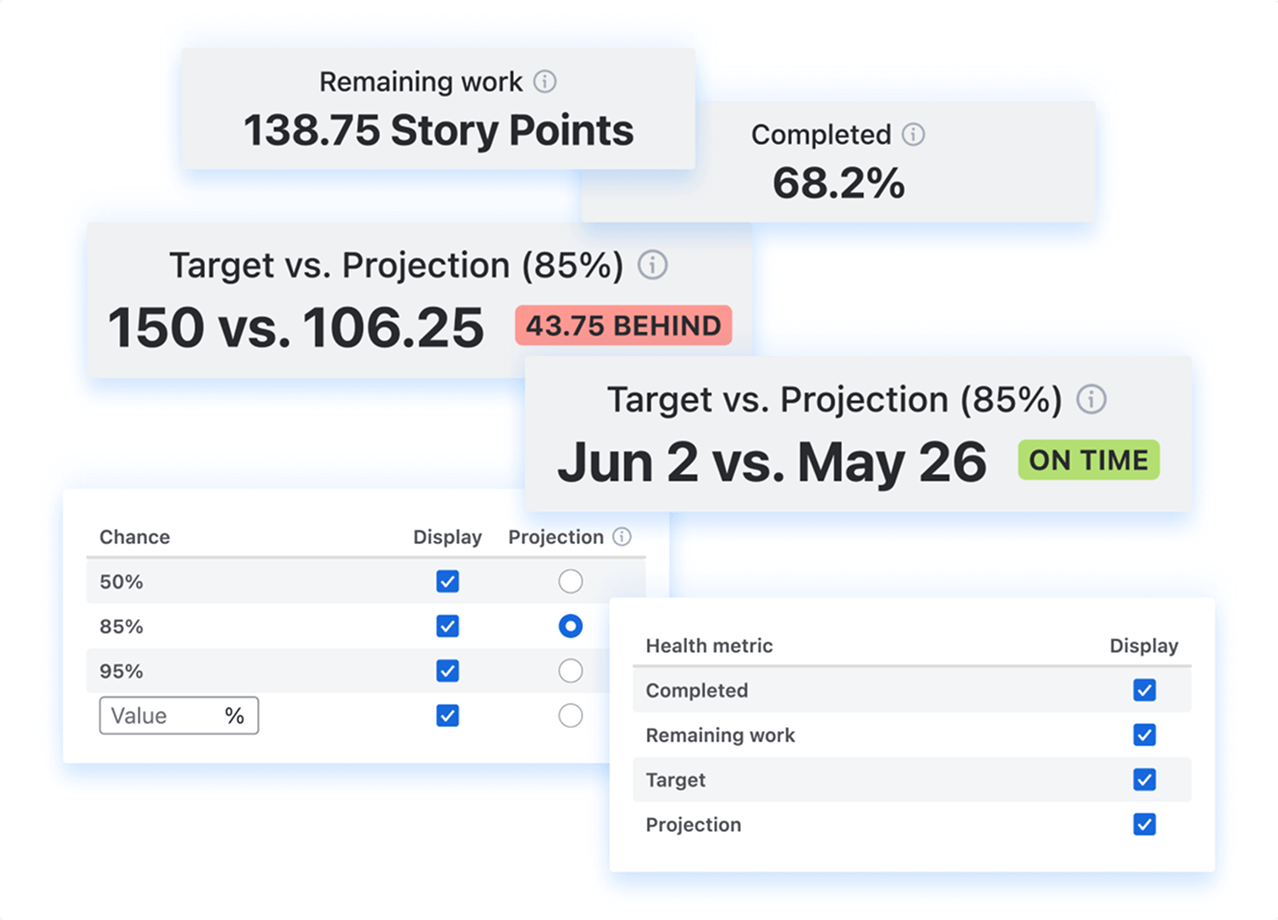
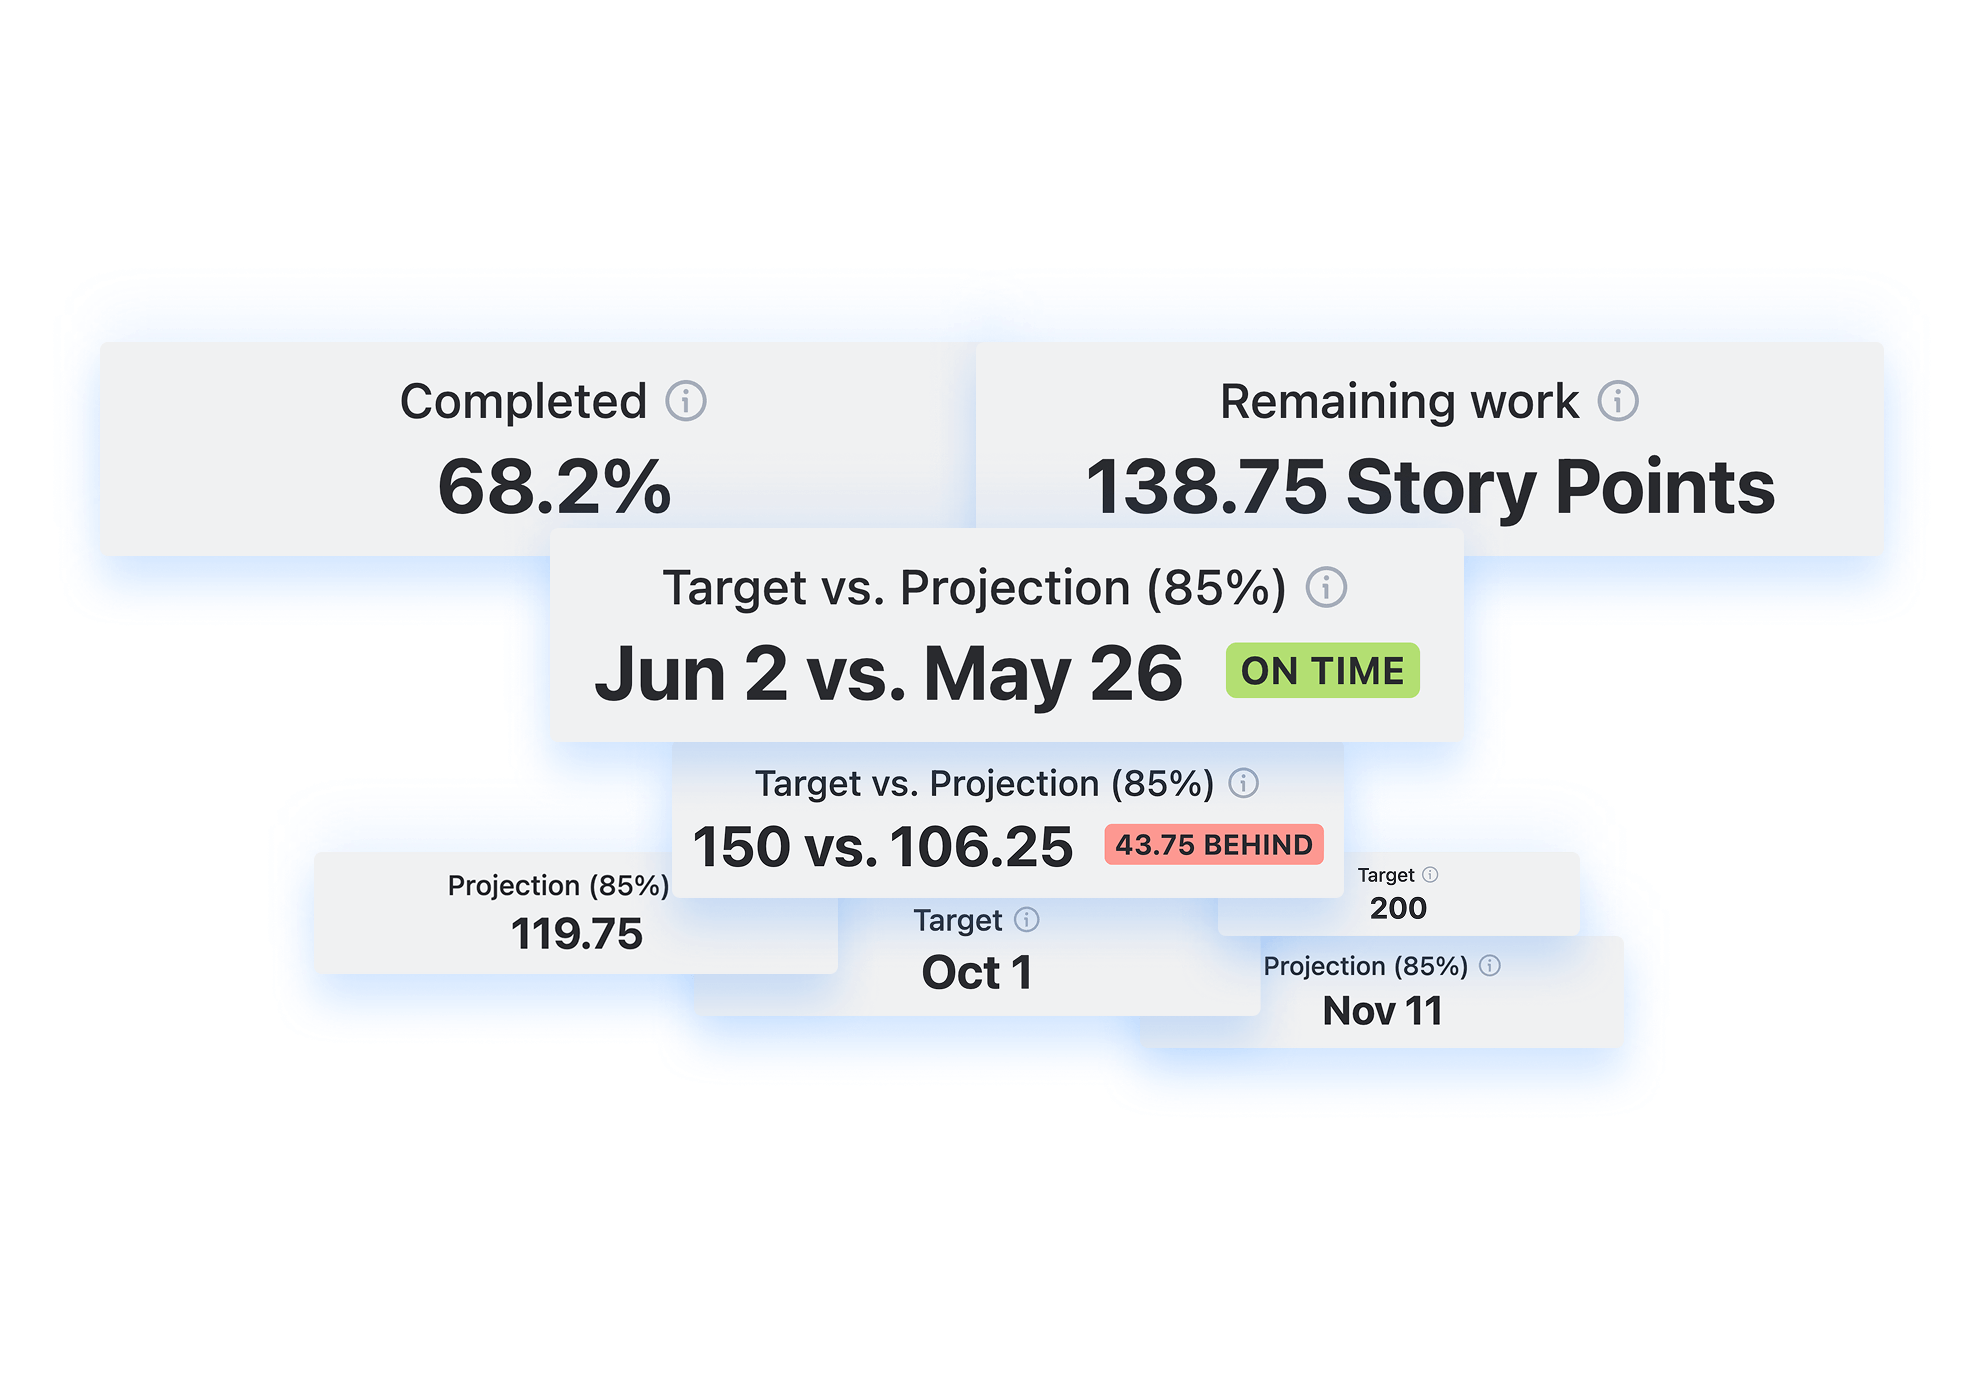
- Visualize delivery risk clearly with percentile bands (P50 / P70 / P85 / P95) and RAG indicators
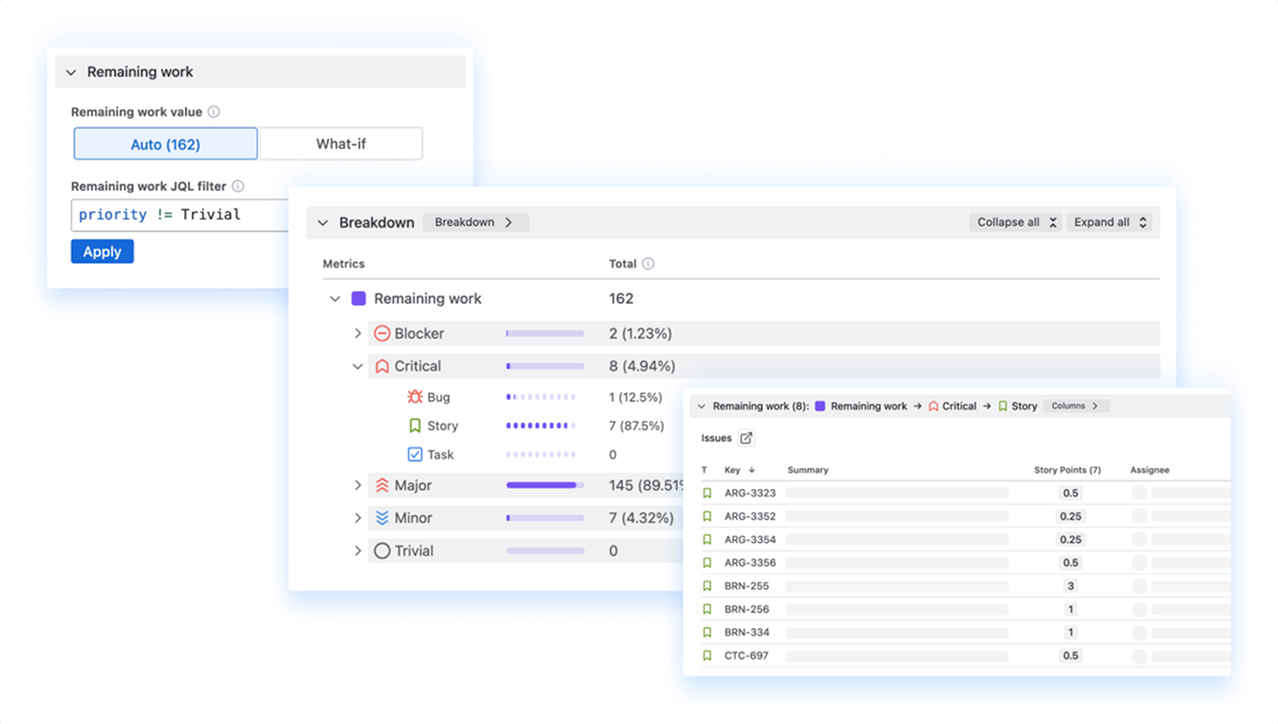
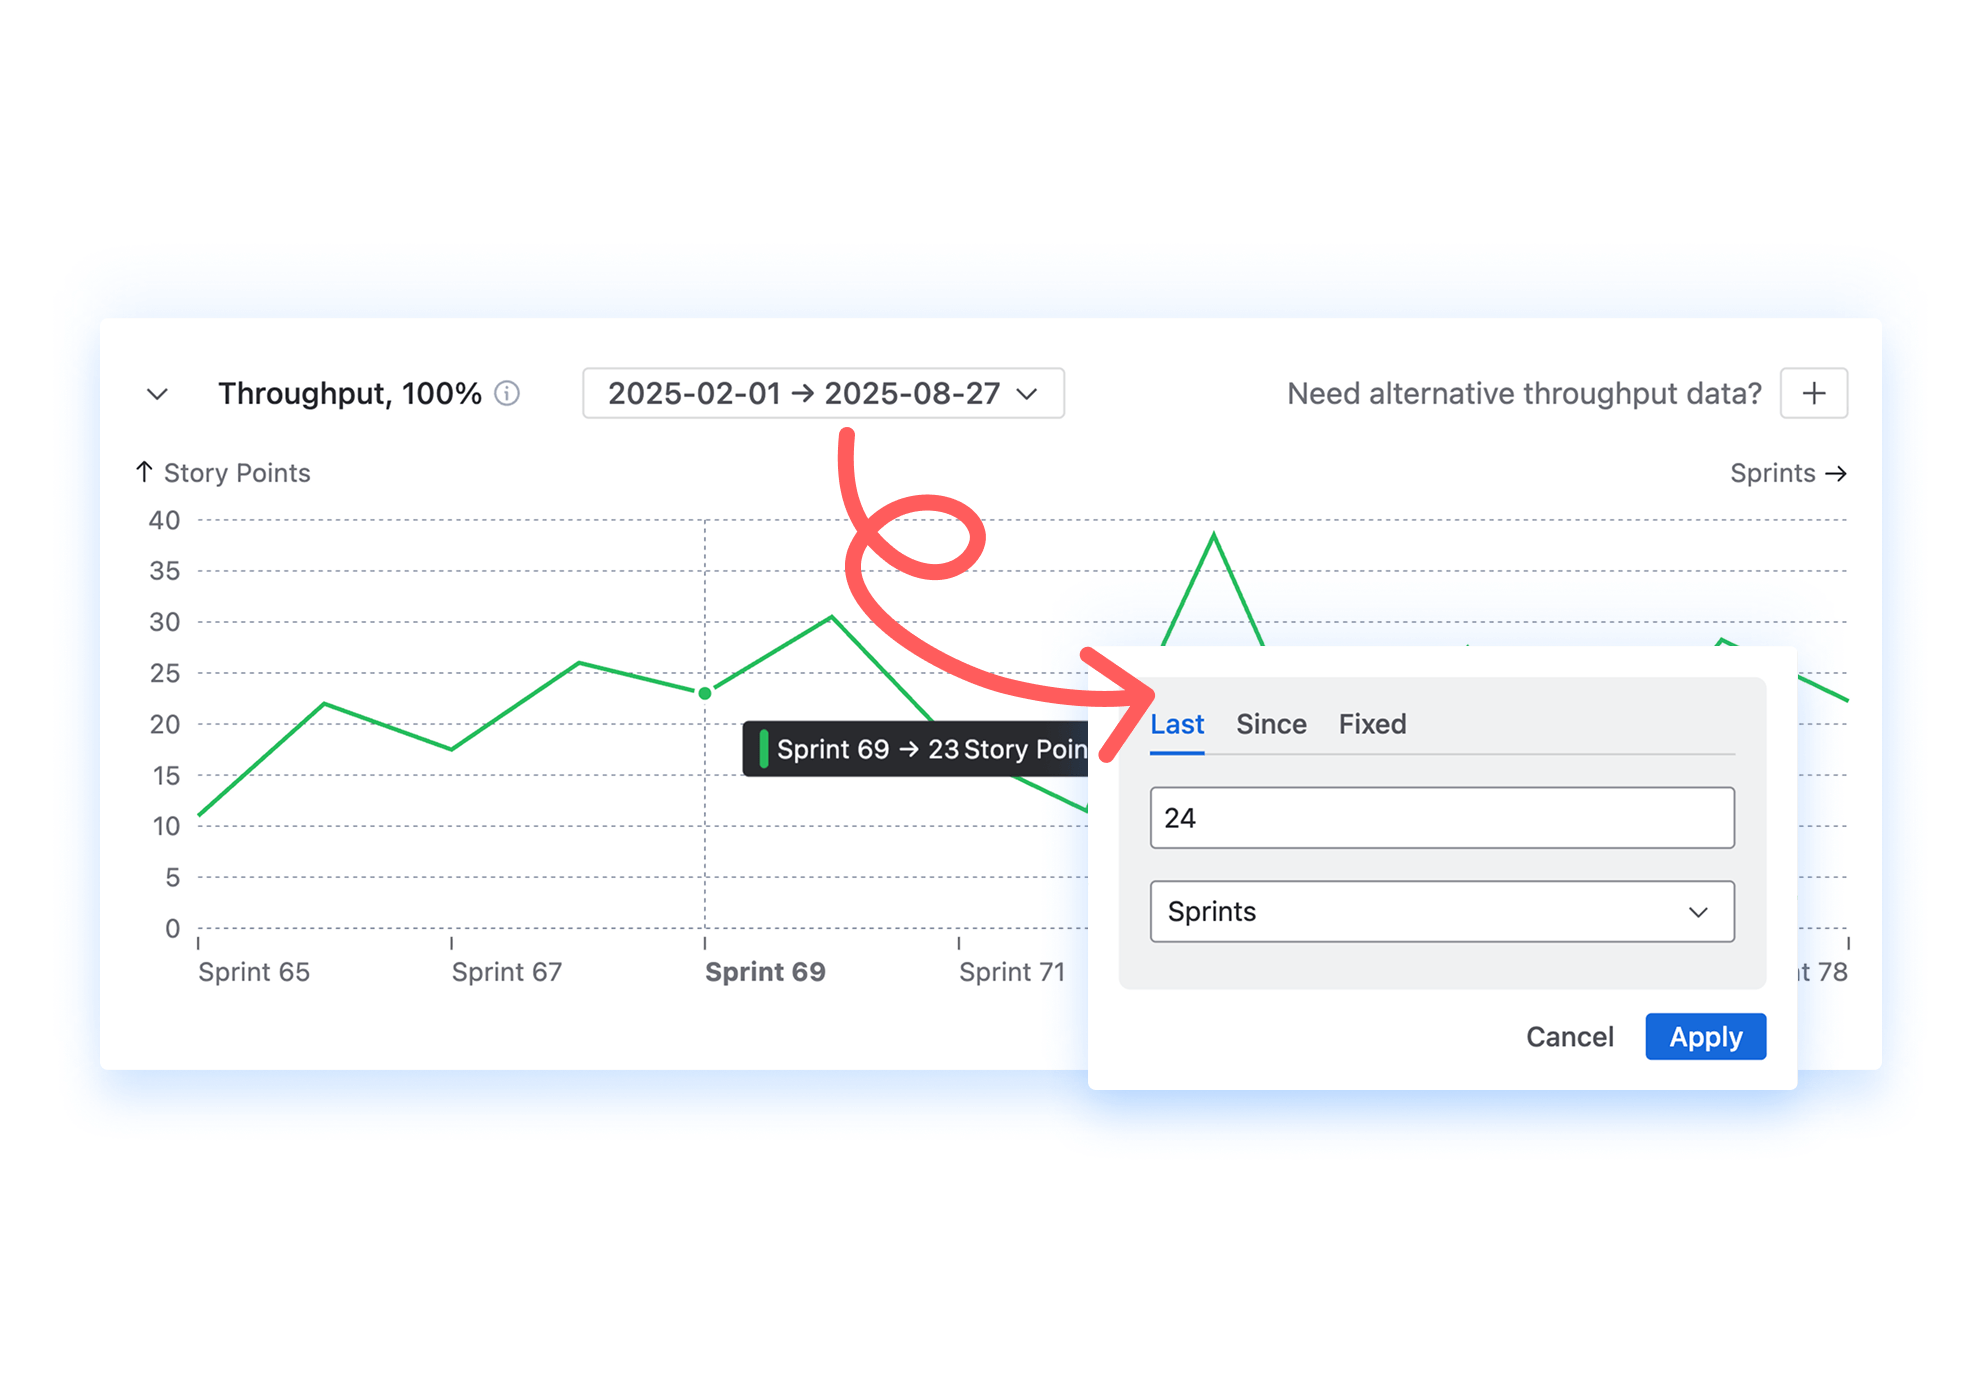
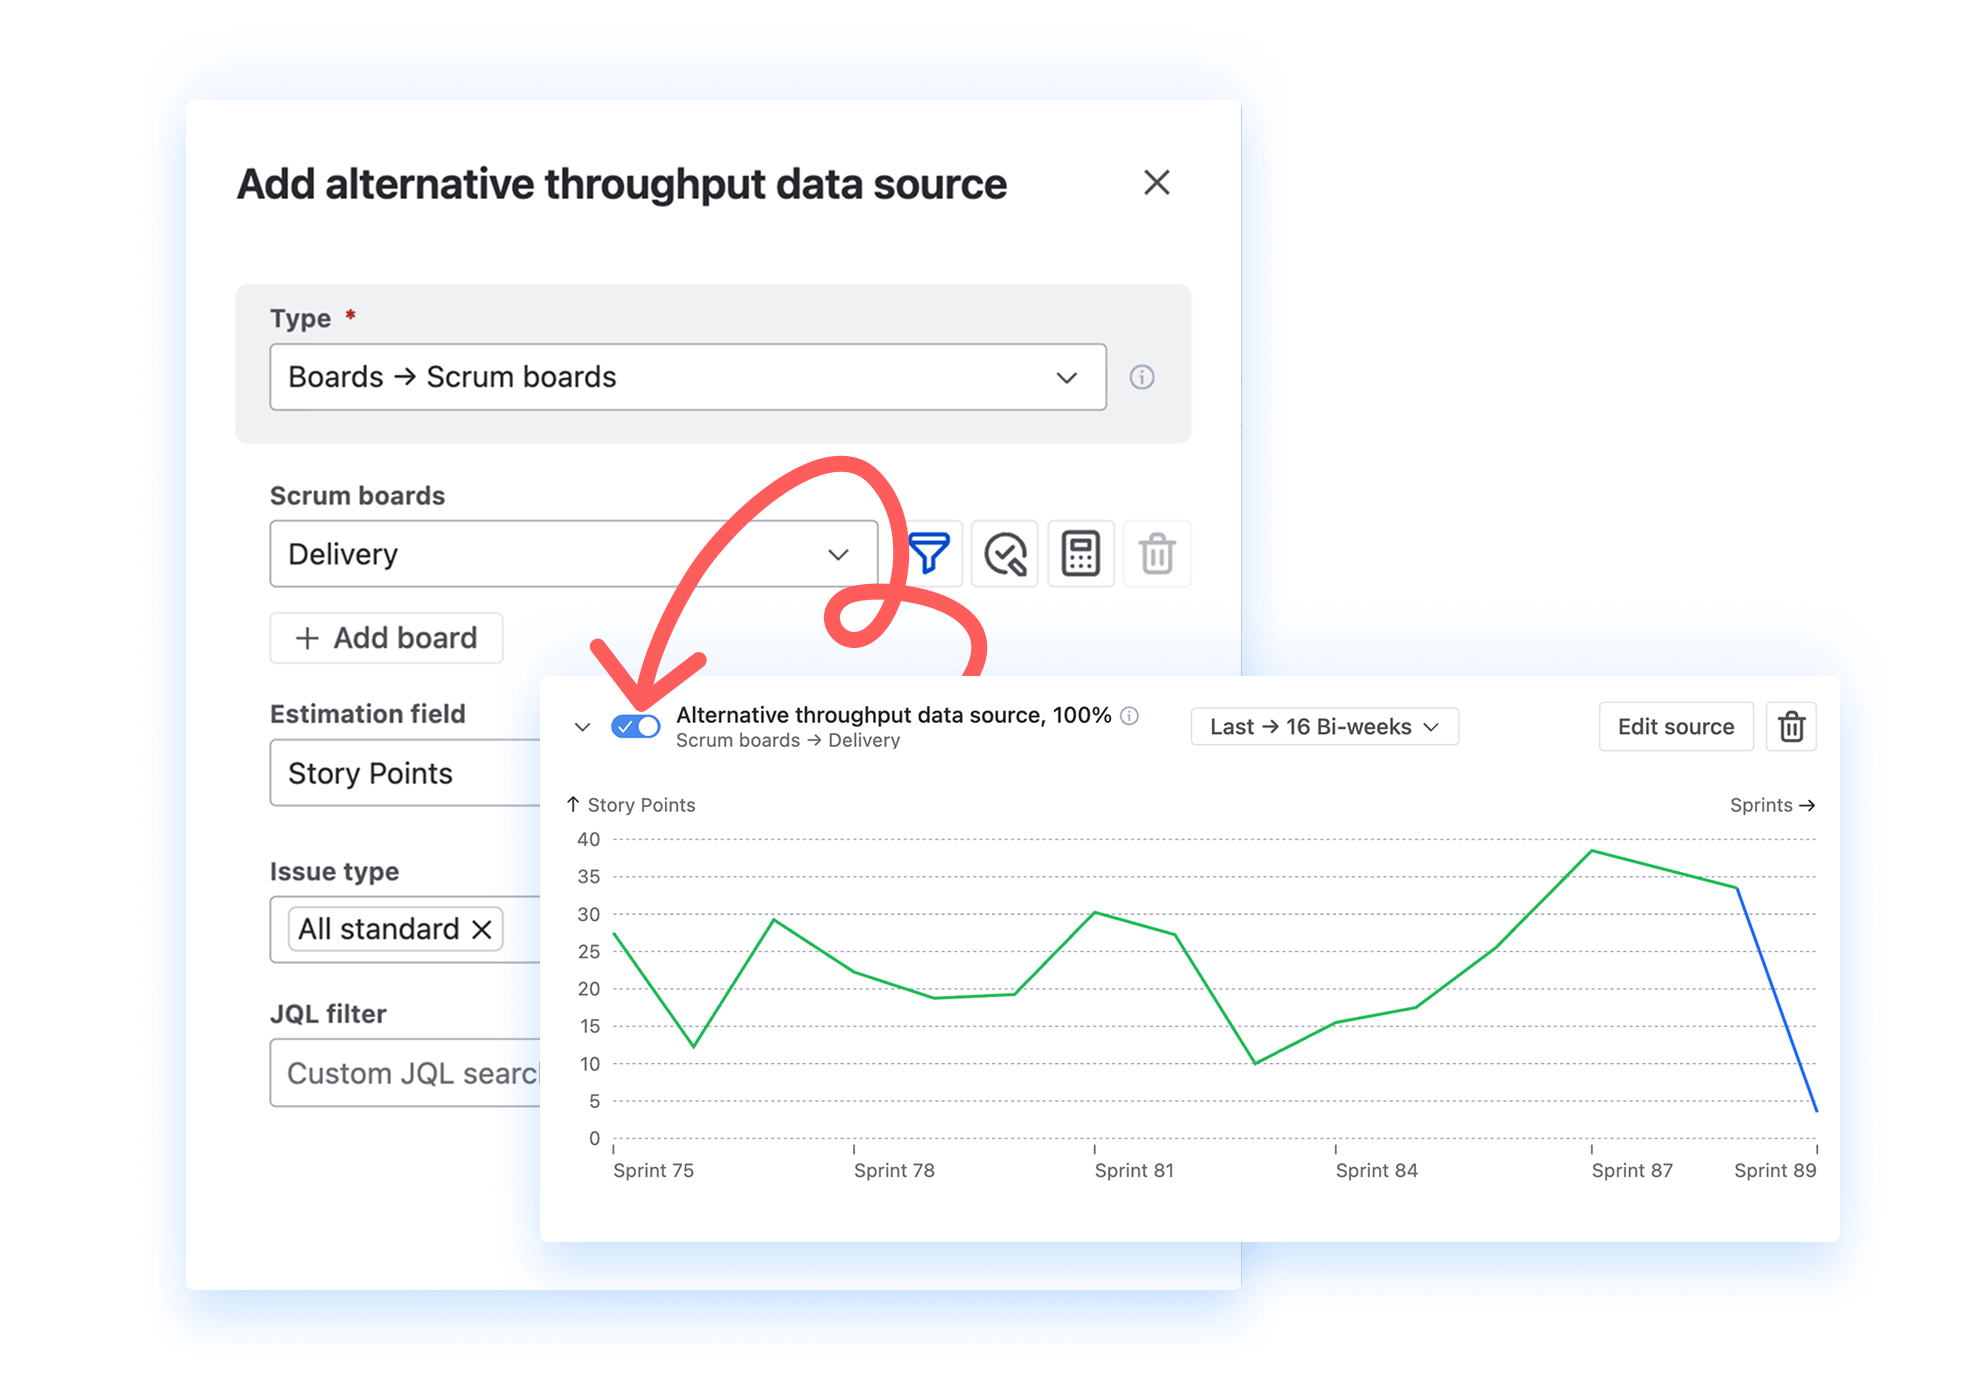
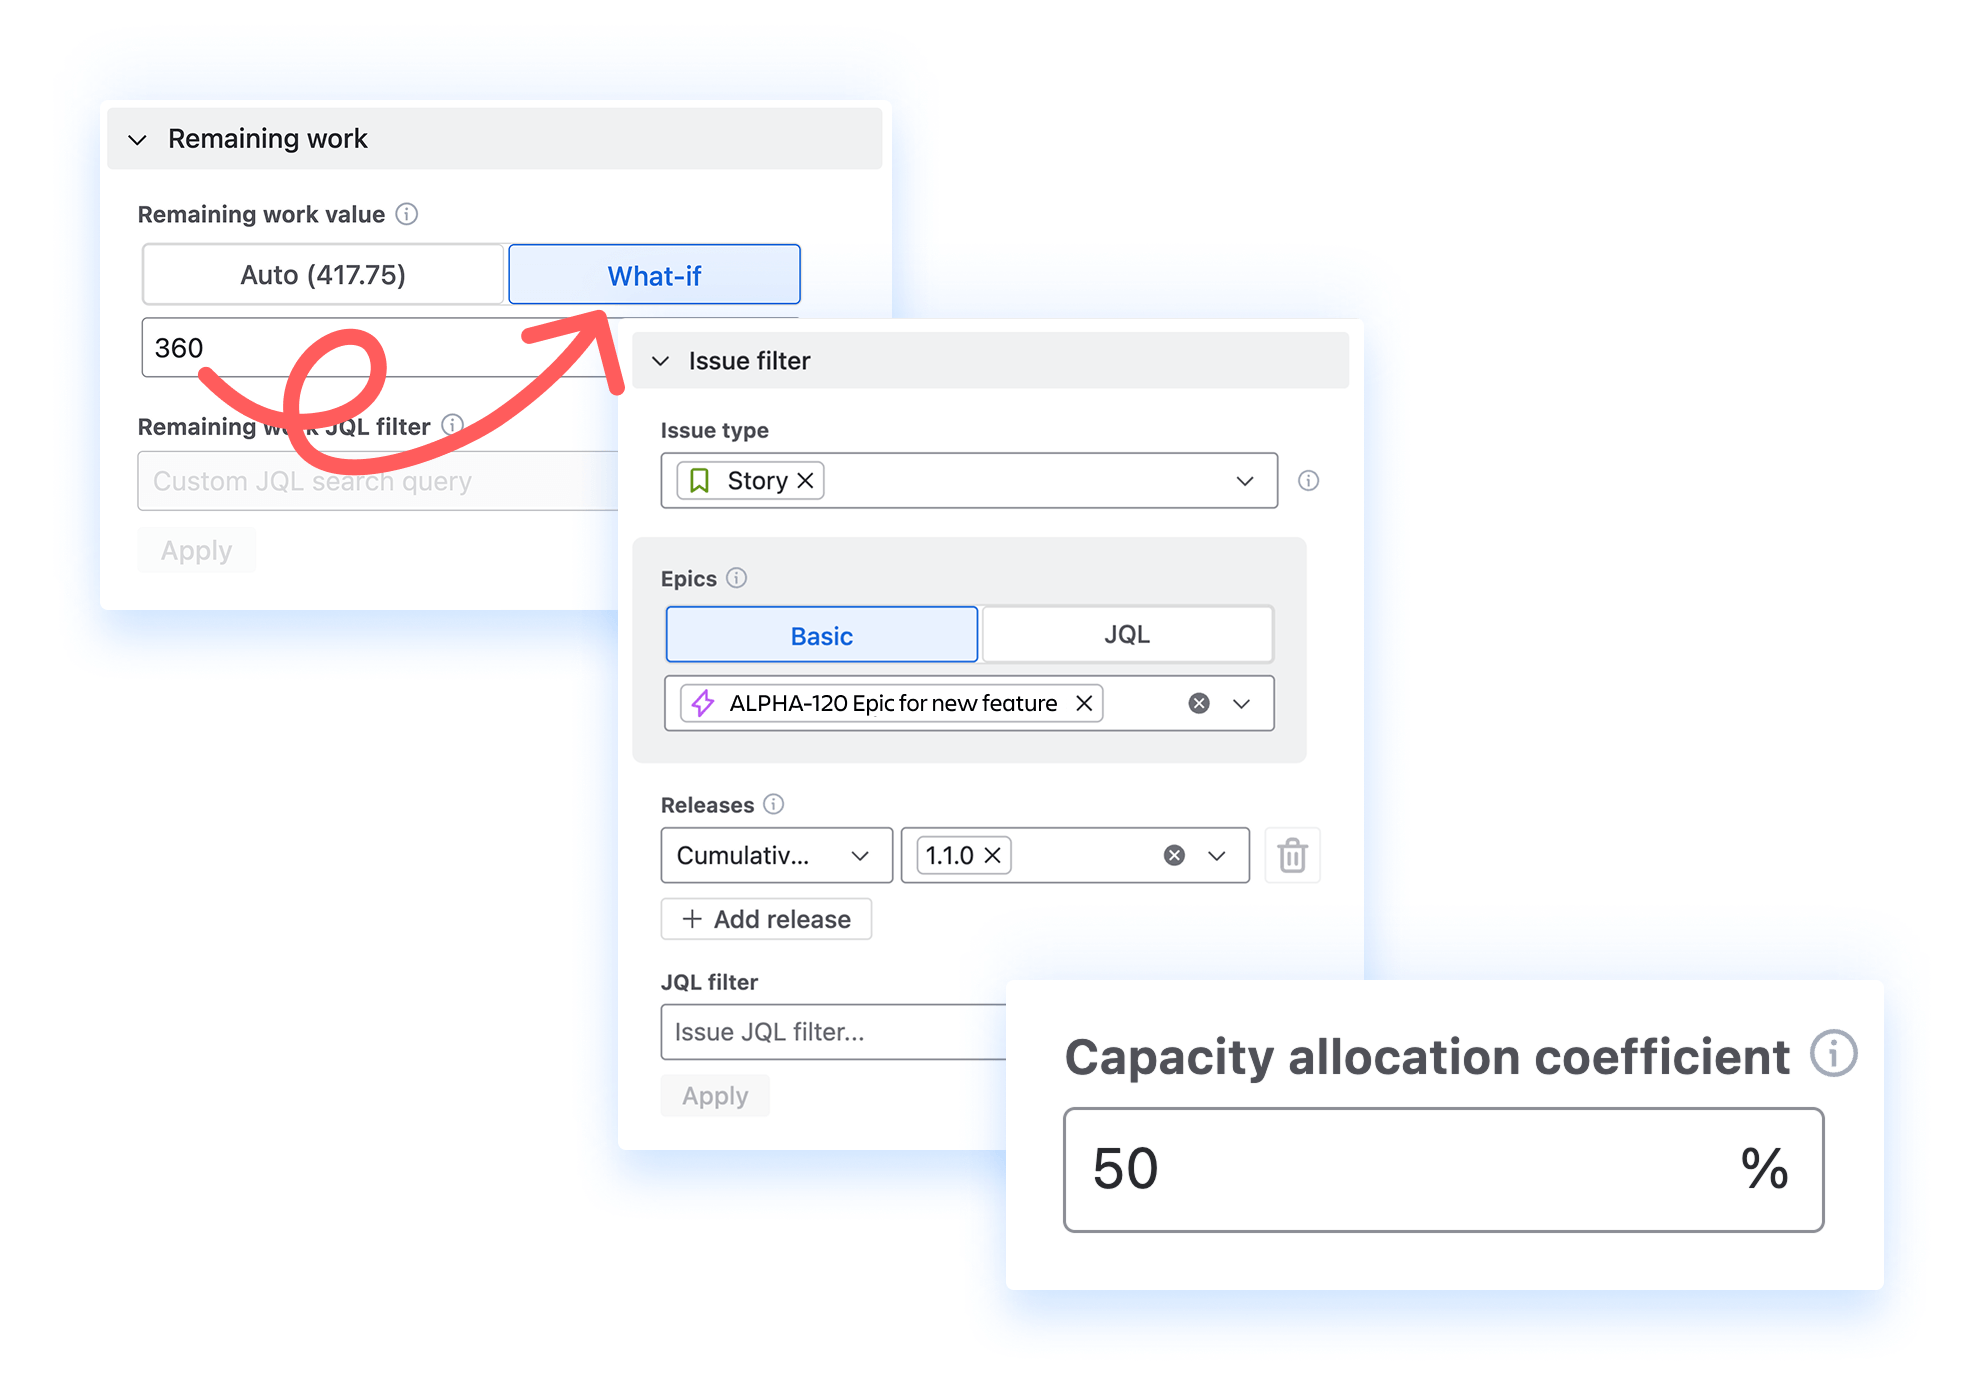
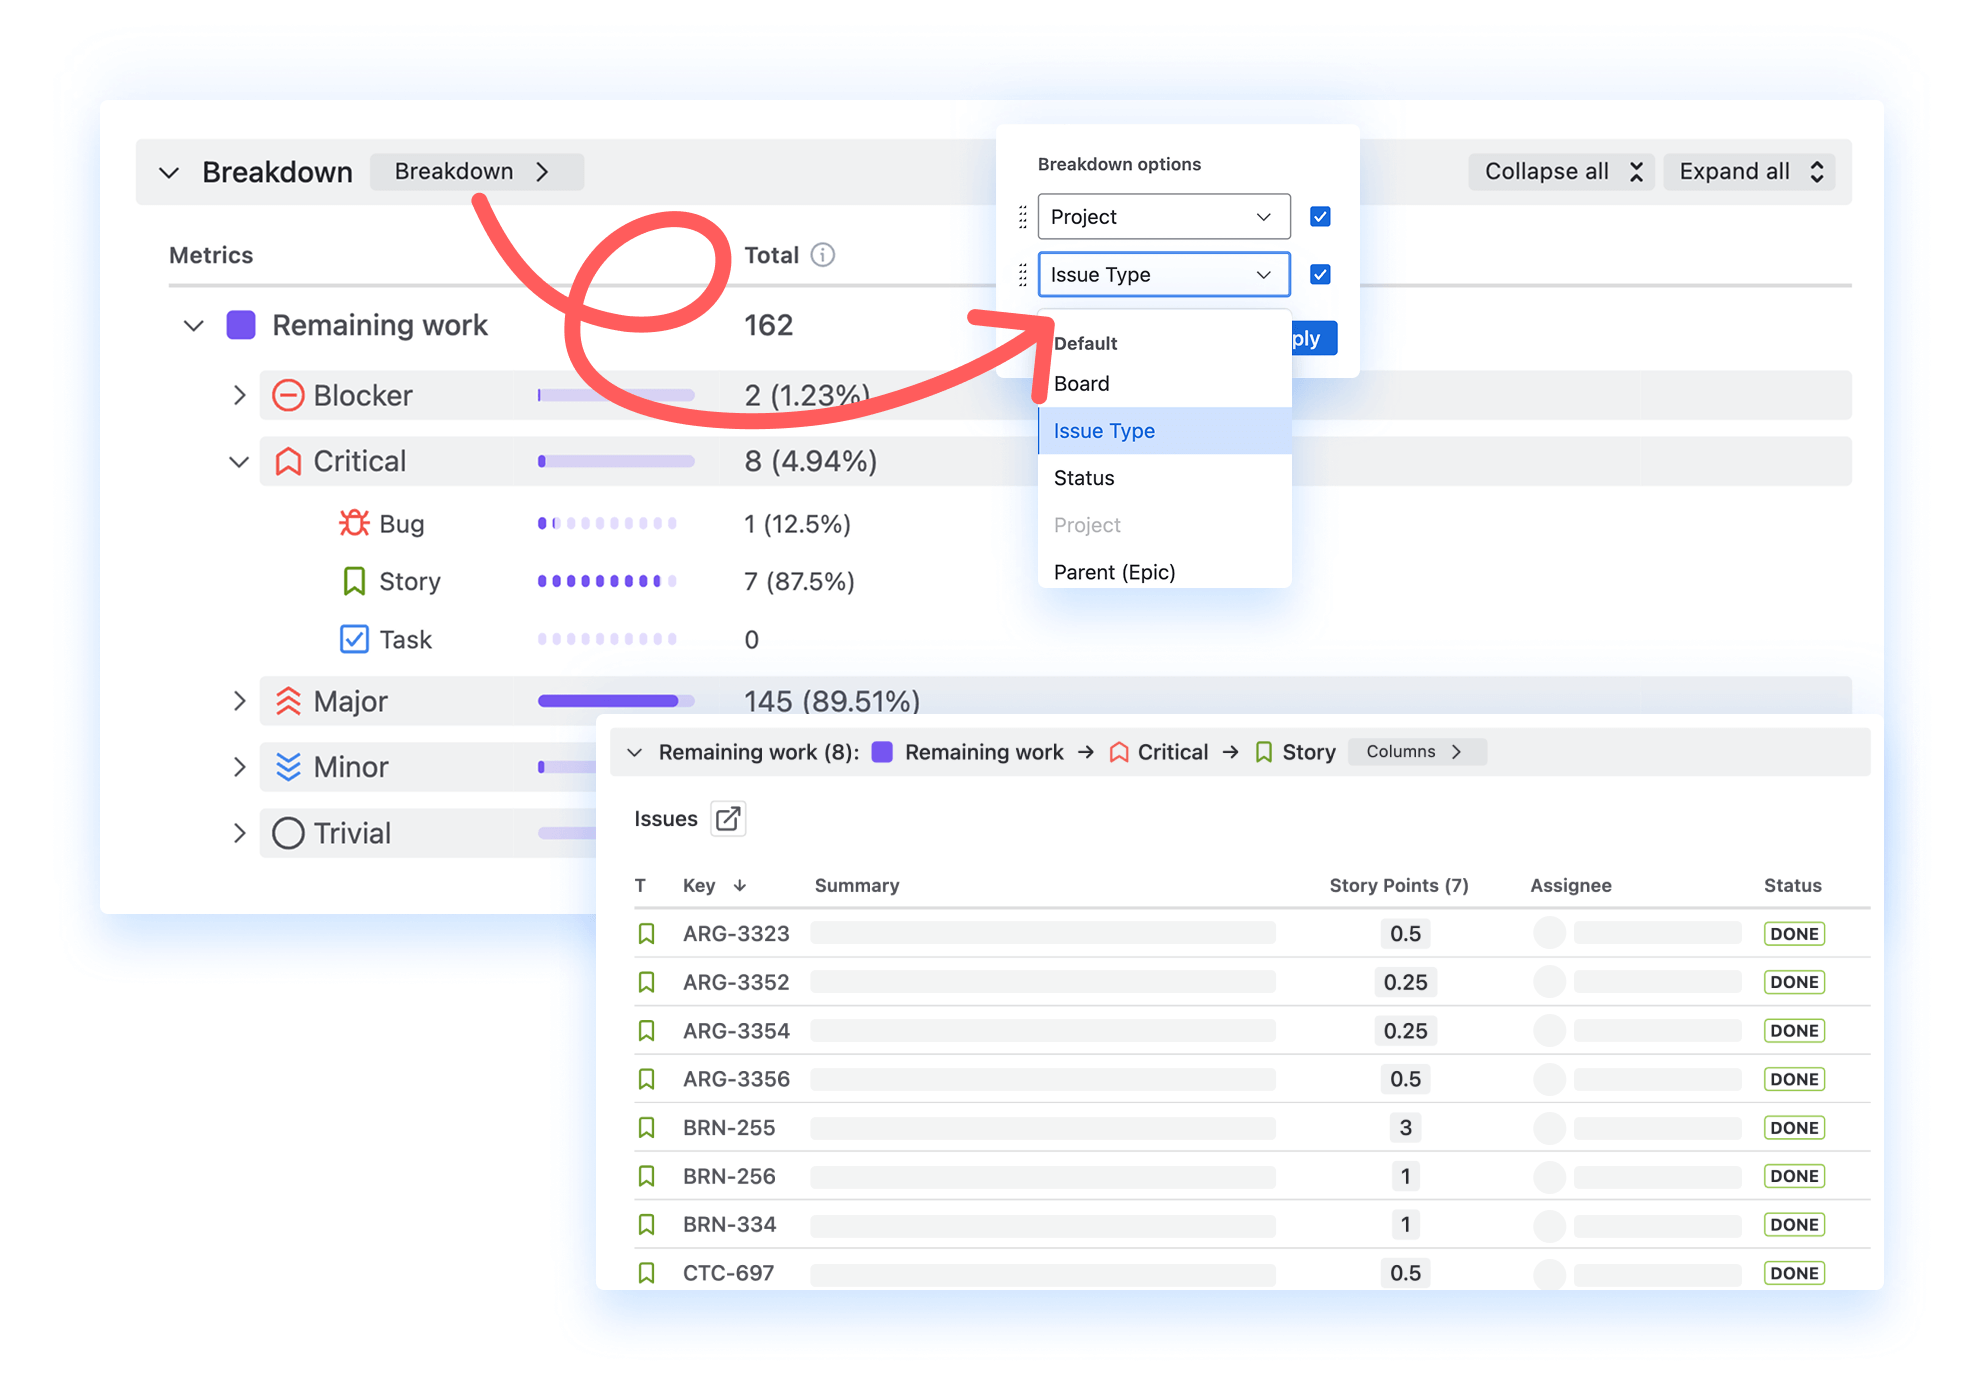
- Model scenarios to see how changes in backlog size, capacity, or work composition impact delivery outcomes


.png)