Thank you! Your submission has been received!
Oops! Something went wrong while submitting the form.

Kanban Throughput run chart

Interactive сhart example
info
The interactive chart is available on larger screens
Please open this page on a desktop to try it out

Key features of the Kanban Throughput run chart

The Kanban Throughput run chart helps you make sense of how work actually moves through your system by showing how much is completed over time and how stable that output is.

Instead of relying on a single perspective, it lets you combine data from multiple boards, adjust how time is analyzed, and switch between different visual and statistical views. This makes it easier to move from a rough understanding of delivery pace to a more precise analysis of patterns, variability, and capacity distribution.

Whether you’re looking at one team or coordinating work across several workflows, Agile Throughput Charts give you a clearer picture of how your delivery system behaves.

How different roles use the Kanban Throughput run chart

Product Owner: I rely on throughput trends to understand how quickly backlog items are actually completed. This helps me prioritize work more effectively and align expectations with stakeholders based on real delivery capacity rather than assumptions.

Agile Coach: I use throughput analysis to help teams focus on flow and system behavior instead of isolated metrics. It’s a practical way to demonstrate variability, highlight improvement areas, and support continuous improvement initiatives.

Delivery Manager: I monitor throughput across multiple boards to ensure delivery stays aligned with expectations. If trends show declining or unstable throughput, I can address risks early, rebalance workload, or adjust commitments.

Program Manager: I rely on throughput trends to evaluate whether initiatives are progressing at the expected pace. The chart helps me detect delays early and make informed decisions about scope, sequencing, or prioritization.

Move from assumptions to flow-based delivery insights with the Kanban Throughput Run Chart

Key feature 1: Combine multiple boards and refine data with filters

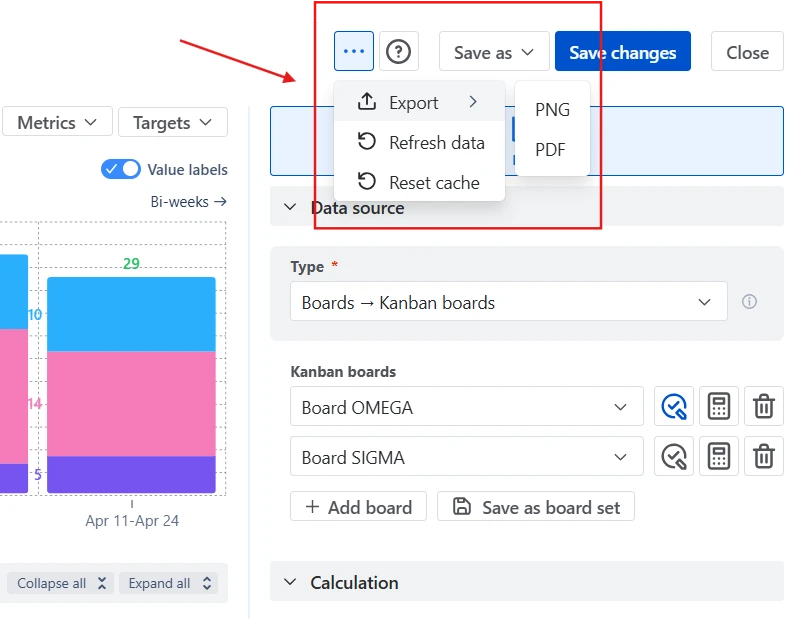
The Throughput run chart for Kanban boards lets you define which data is included in the analysis, so you can measure throughput across the full delivery system with a precise, relevant dataset.

Instead of being limited to a single team’s board, you can aggregate throughput across multiple boards or projects. This is especially useful when delivery spans several teams or when work is distributed across different Jira boards. You can further refine the scope using an Issue filter, focusing only on relevant work - such as a specific issue type, epic, release, or any custom JQL query.

Kanban Throughput run chart data source configuration and Issue filter

This feature is helpful for:

  • Analyzing delivery across multiple teams in one chart
  • Focusing on a specific subset of work without modifying boards
  • Excluding unrelated tickets that could distort throughput insights

Key feature 2: Adjust time intervals to match your delivery cadence

Once you’ve defined the scope, the next step is deciding on the timeframe for the analysis and how the data is grouped within it.

The Agile Throughput run chart for Kanban teams lets you configure the time interval by selecting a rolling window (for example, last N days, weeks, or months) or defining a custom date range. On top of that, you can group completed work into different time intervals - from daily and weekly views to longer periods like monthly or quarterly. Shorter groupings highlight variability and fluctuations in delivery, while longer ones smooth out noise and make overall throughput trends easier to interpret.

Kanban Throughput run chart interval and grouping settingsType image caption here (optional)

This feature is helpful for:

  • Spotting short-term variability vs long-term trends
  • Adjusting the level of detail depending on the audience
  • Understanding how stable your throughput is over time

Key feature 3: Analyze throughput with different chart views

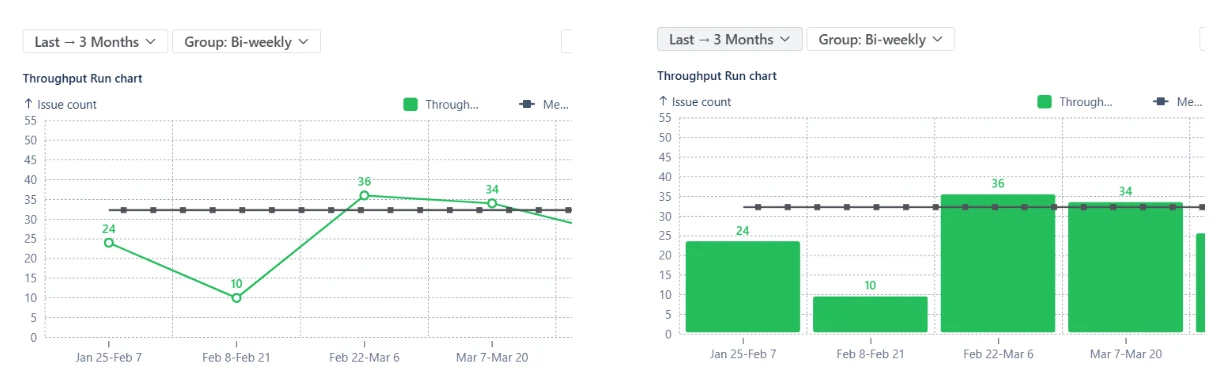
With the data in place, you can explore it from different perspectives by switching between chart views. Line and bar charts show total throughput per period, making it easy to spot trends, compare intervals, and assess delivery pace over time.

Kanban Throughput run report in Jira: line and bar views

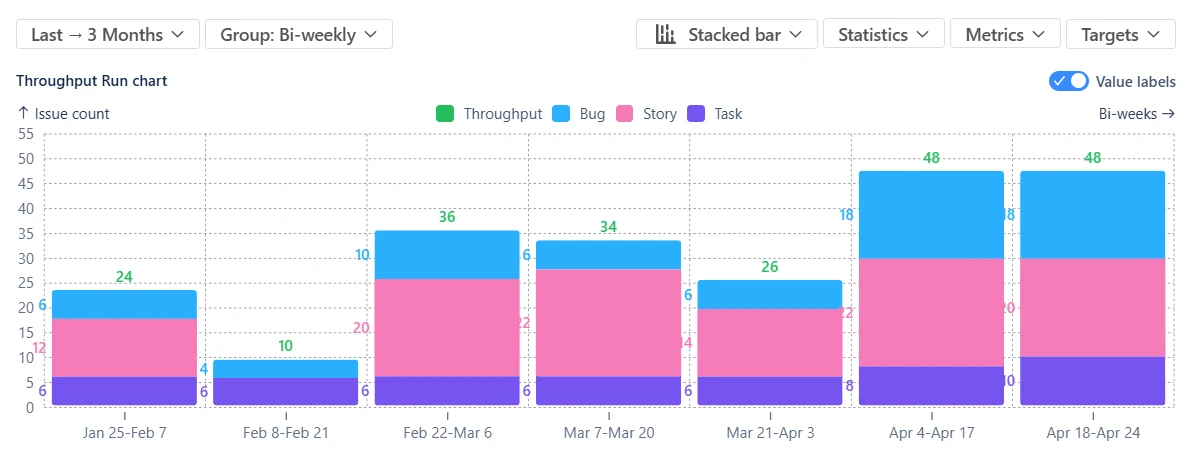
For deeper analysis, the stacked bar view lets you break down throughput by any Jira field, such as issue type, assignee, team, or component, revealing how capacity is distributed across different types of work.

Kanban Throughput run report in Jira: stacked bar view

This feature is helpful for:

  • Identifying trends and patterns in delivery over time
  • Comparing throughput across periods at a glance
  • Understanding how capacity is distributed across work types or teams

Key feature 4: Use statistics and moving averages to understand delivery

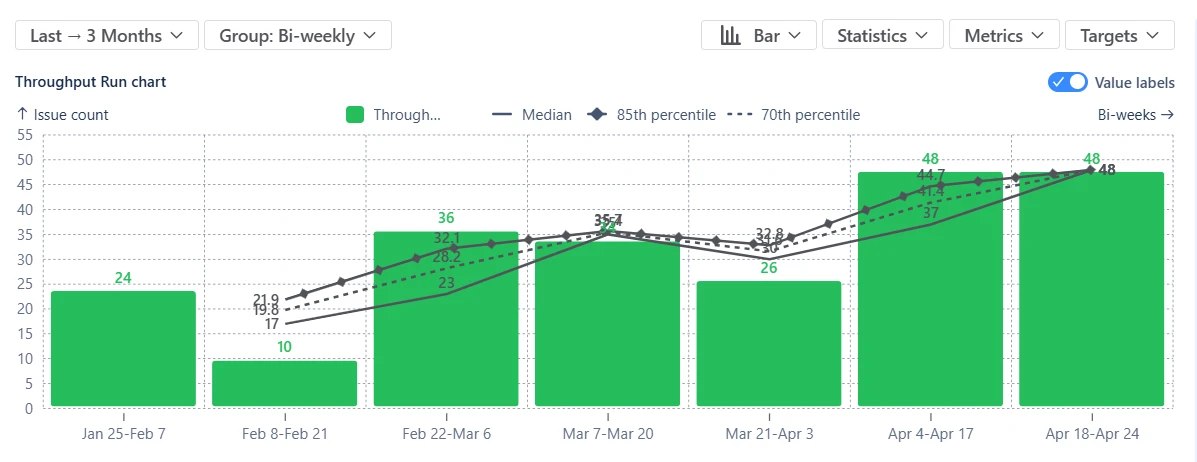
To move beyond raw throughput values, the chart lets you overlay customizable statistical benchmarks on the data.

You can display metrics such as the mean, median (P50), and higher percentiles (P85, P95, or any custom value) to understand what typical and high-confidence delivery looks like over time. These indicators help you separate normal variation from meaningful changes in performance.

Jira throughput run chart for Kanban teams with statistic lines

In addition, you can apply moving statistics calculated over a selected number of recent intervals. This allows you to track how throughput evolves, rather than relying only on long-term averages.

Throughput run chart for Kanban boards with moving statistics

This feature is helpful for:

  • Understanding typical vs high-confidence throughput levels
  • Distinguishing stable performance from variability
  • Tracking recent changes in delivery trends

Key feature 5: Explore underlying data with Breakdown and Issue list

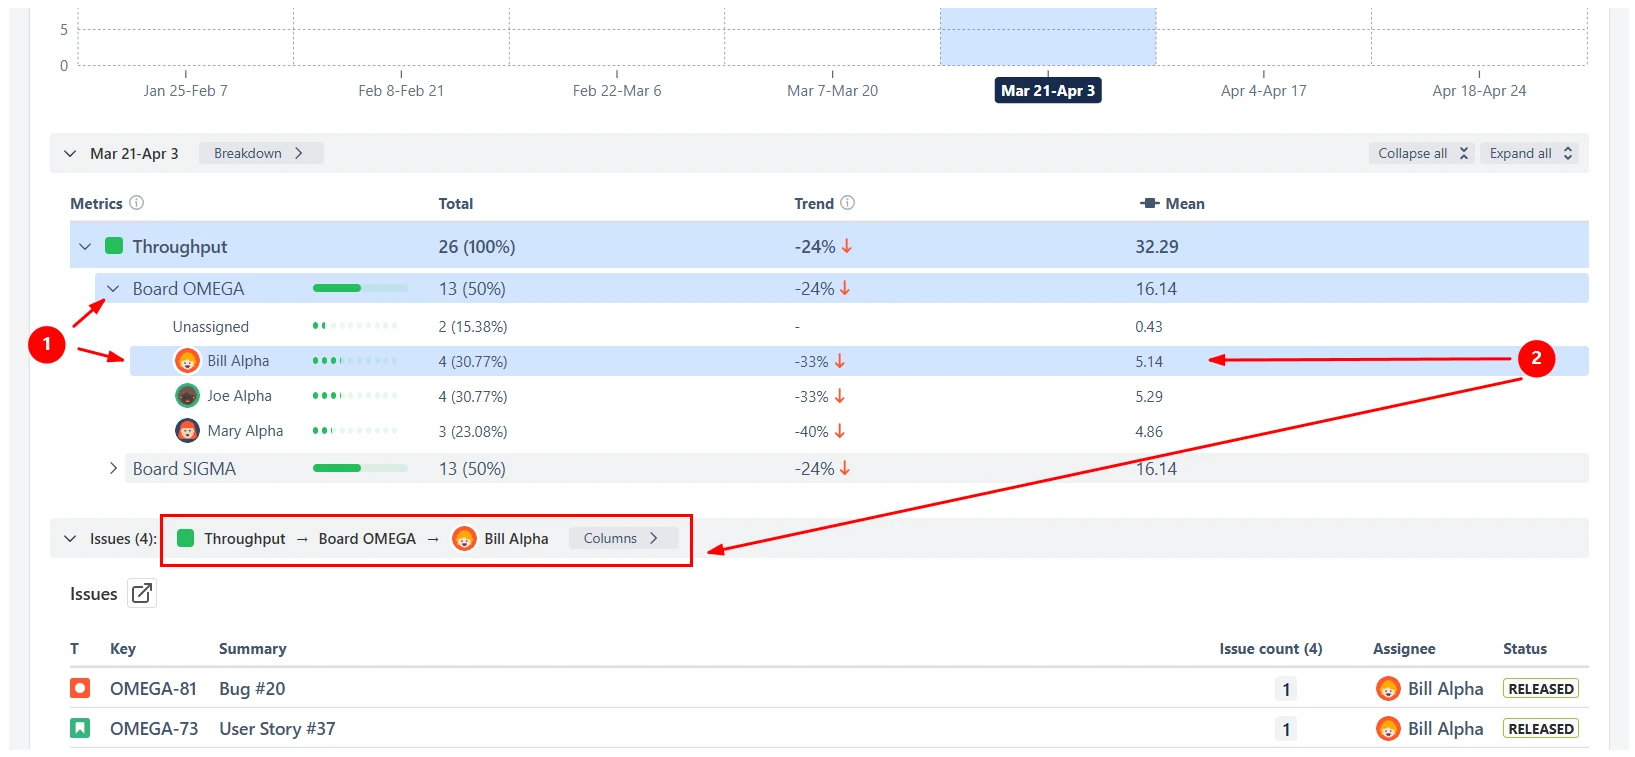
High-level metrics are only useful if you can understand what drives them.

The Kanban Throughput run chart lets you drill down into any time interval to open a detailed breakdown of completed work. You can group results by any two Jira fields, such as team, assignee, or component (), to see how different segments contribute to overall throughput.

From there, you can go one level deeper into the Issue list ( ), which shows the exact items included in the selected period. Each issue is linked back to Jira, allowing you to inspect, validate, or update the data directly.

Kanban Throughput run chart: Breakdown and Issue list

This feature is helpful for:

  • Understanding what drives changes in throughput
  • Comparing contributions across teams, work types, or components
  • Investigating anomalies and identifying root causes

Additional features

Configure calculations to match your Kanban flow

The Kanban Throughput run chart in the Jira dashboard lets you tailor how throughput is calculated so the data reflects how your teams actually deliver work in a continuous flow.

You can define throughput based on custom column transitions, selecting which workflow movements count as completed work. It’s also possible to choose an estimation field, such as issue count (most common for Kanban), story points, or any numeric field, depending on how your teams measure delivery. When working with multiple boards, these calculation rules can be configured individually for each board, ensuring accurate and consistent throughput measurement across different workflows.

Kanban Throughput run chart calculation settings

Share and export throughput insights

Once your chart is set up, you can easily share it with stakeholders.

Add it to a Jira dashboard to provide real-time visibility into delivery trends, or export it as PNG or PDF to include in presentations, reports, or documentation.

Kanban Throughput run chart sharing and export options

What about the native Jira Throughput run chart for Kanban teams

Jira does not provide a dedicated throughput chart for Kanban teams. Native reports are primarily built around cycle time (Control Chart) or sprint-based delivery (Velocity), which makes them less suitable for analyzing throughput in a continuous flow environment.

In practice, this creates several gaps when working with Kanban:

  • Throughput is not visualized as a primary metric, making it harder to track how much work is completed over time
  • Analysis is often limited to a single board, with no simple way to combine multiple teams or workflows
  • Time-based insights are restricted or inflexible, especially when trying to move beyond sprint-like cadences
  • There is no statistical context to evaluate stability or variability in delivery
  • Calculation logic cannot be adjusted to reflect how teams actually define completion or measure output
  • It’s not possible to understand where capacity is spent by breaking down throughput across work types or teams

Advantages of using the Kanban Throughput run chart

The Kanban Throughput Chart addresses these limitations by providing a flexible and configurable view of delivery in a flow-based system.

With it, you can:

  • Build a unified throughput view across multiple Kanban boards, projects, or JQL-defined scopes
  • Analyze delivery using flexible time intervals (daily, weekly, monthly, or custom ranges)
  • Adapt calculations to your workflow by configuring estimation fields and column transitions per board
  • Add statistical benchmarks and moving trends to better understand typical performance and variability
  • Break down throughput by any Jira field to see how capacity is distributed across work
  • Switch between line, bar, and stacked views to explore trends and patterns from different angles
  • Drill down into each interval to inspect the exact issues behind the metrics
  • Refine the dataset using JQL filters to ensure accurate and relevant analysis
Explore the interactive chart, no setup, no risk
TRY THE CHART
Chart embeded

App used in this Kanban Throughput run chart example

Use these examples to create your own Kanban Throughput run report use cases on the Jira Dashboard.

Both Jira apps (plugins) featured here offer a 30-day free trial and are completely free for teams of up to 10 users:

The Agile Reports and Gadgets app includes Kanban Throughput run chart functionality plus a wide range of additional charts and reports.

Frequently Asked Questions

1. What is throughput in Kanban?

Throughput in Kanban measures how many work items are completed within a specific period of time, such as per day, week, or month. Each item typically represents a unit of value (e.g., a ticket, task, or user story).

Unlike effort-based metrics, throughput focuses on output, making it a reliable way to understand how much work your system actually delivers. Over time, it helps teams identify patterns, assess delivery capacity, and track whether performance is stable or changing.

2. How do you calculate throughput in Jira?

Throughput in Jira is calculated by counting how many issues move into a Done status (or equivalent) during a defined time period.

Depending on your configuration, throughput can be measured as:

  • Number of completed issues (most common for Kanban)
  • Story points completed
  • Time-based metrics or other numeric fields

The key is to clearly define what “Done” means and ensure consistency across teams and boards.

3. How can I improve throughput in Kanban?

Improving throughput is less about pushing teams to work faster and more about improving flow efficiency.

Common approaches include:

  • Limiting work in progress (WIP) to reduce multitasking
  • Identifying and removing bottlenecks
  • Breaking down large items into smaller, manageable tasks
  • Reducing waiting time between workflow stages
  • Improving collaboration across teams

The goal is to make work move smoothly through the system rather than increasing pressure on individuals.

4. Should Kanban teams use story points or issue count for throughput?

Most Kanban teams prefer issue count, as it keeps the metric simple and avoids the overhead of estimation.

However, story points or time-based fields can be useful when:

  • Work items vary significantly in size
  • Teams already use estimation consistently
  • You need to align with Scrum teams or SAFe reporting

The key is to stay consistent within the same chart or dataset.

5. How does throughput relate to cycle time?

Throughput and cycle time are complementary metrics:

  • Throughput - how much work is completed
  • Cycle time - how long it takes to complete work

To get a complete picture of your delivery system, it’s best to analyze these metrics together. The Cycle Time Chart shows how long work spends in the system, while WIP charts highlight how much work is in progress and where it may be accumulating.

Both charts are part of the Agile Reports and Gadgets app, allowing you to combine throughput, cycle time, and WIP insights in one place.

Why trust Broken Build apps?

Gold Marketplace Partner
apps
Use this example 
in these apps: