
Thank you! Your submission has been received!
Oops! Something went wrong while submitting the form.


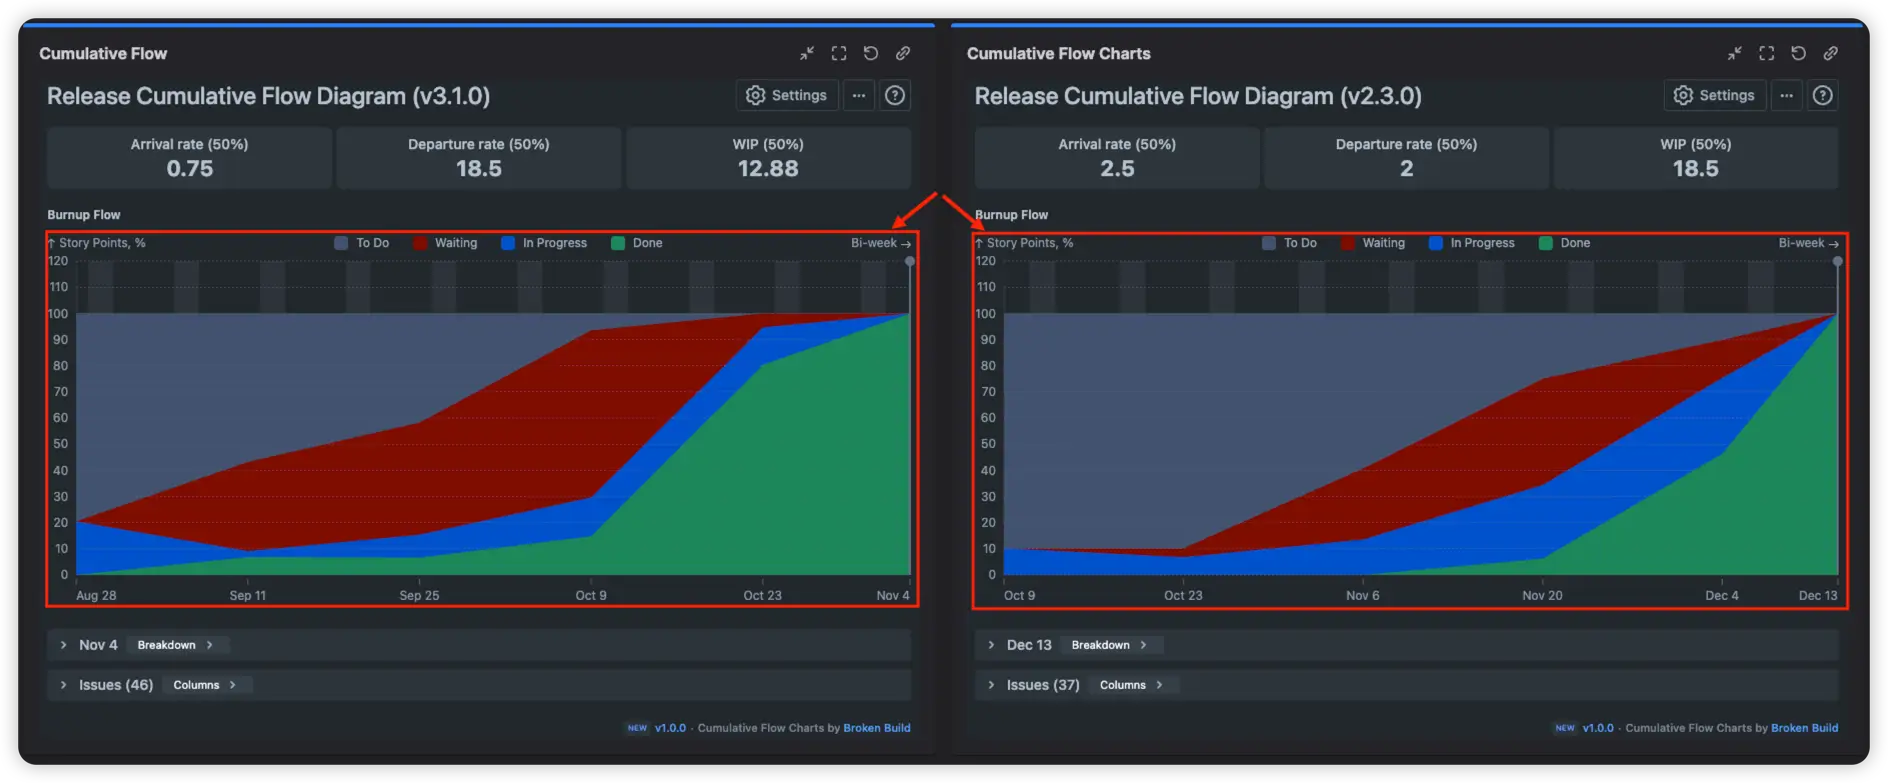
The chart provides a complete view of your release progress, regardless of its size. It shows the entire work lifecycle, day by day, across all statuses and status groups. You can easily monitor how the release evolves over time and quickly spot bottlenecks, such as work piling up in a single status without moving forward. It also makes it easy to track scope changes, ensuring everything stays on schedule for the planned deadline.
Try the Agile Cumulative Flow Charts to get clear, actionable insights with a tool built by experts in agile delivery.
✅ Product Manager: I use the chart to understand whether delivery is on track, monitor scope changes, and quickly spot risks.
✅ Team Lead: I love the Release cumulative flow diagram because it can finally compare apples to apples across teams. You're not just guessing which squad is struggling; you can see it. When you experiment with a new process, you've got before-and-after data to prove whether it actually helped.
✅ Scrum Master: I use the diagram to visualize overall process health and detect inefficiencies such as stalled work, unstable arrival and departure balance, or widening WIP. These insights help me drive conversations about blockers, flow improvements, and more sustainable practices.
✅ Project Manager: I track progress against timelines, detect scope creep, and communicate release status clearly to stakeholders using objective, data-driven insights.


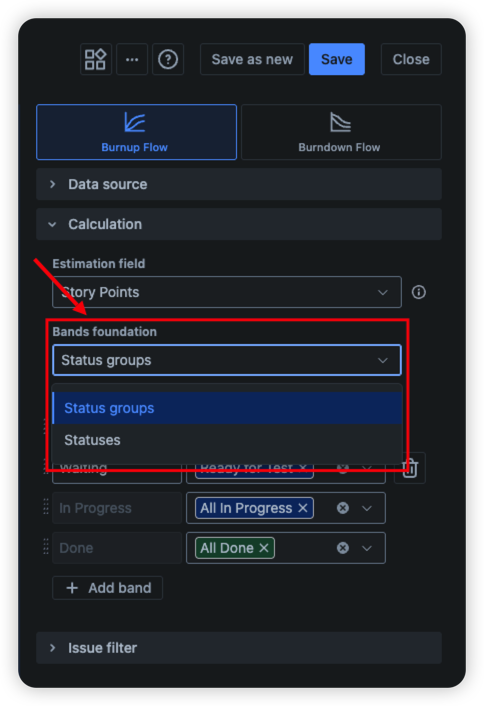
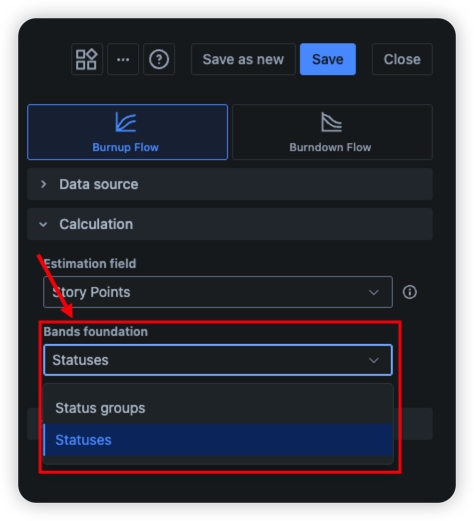
The Release cumulative flow diagram (CFD) provides enhanced customization options for how your data is displayed. One option is bands, which let you group individual statuses into higher-level categories that reflect your team’s workflow. To enable this functionality, select “Status groups” in the “Bands foundation” dropdown under the “Calculation” section of the chart settings.
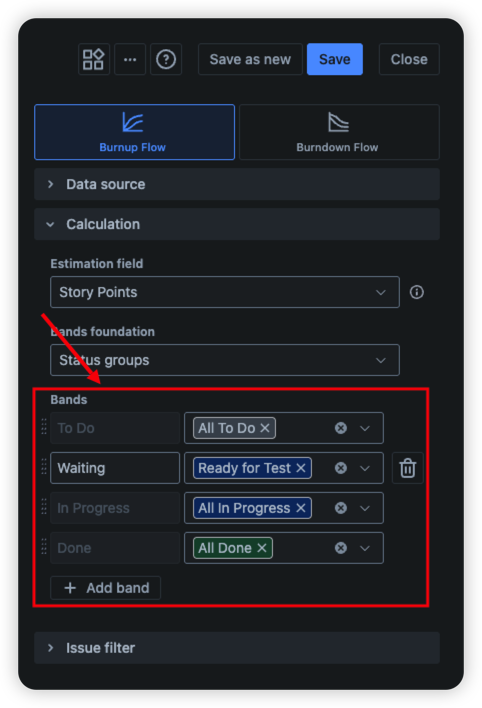
You can configure both predefined and custom bands. The predefined bands are To Do, In Progress, and Done. Each automatically includes all statuses from the corresponding Jira status categories. You can modify these at any time and add one or more custom bands to better match your workflow. In our example, we highlight the “Ready for Test” status by placing it in the “Waiting” band, helping us quickly identify potential bottlenecks at that stage.
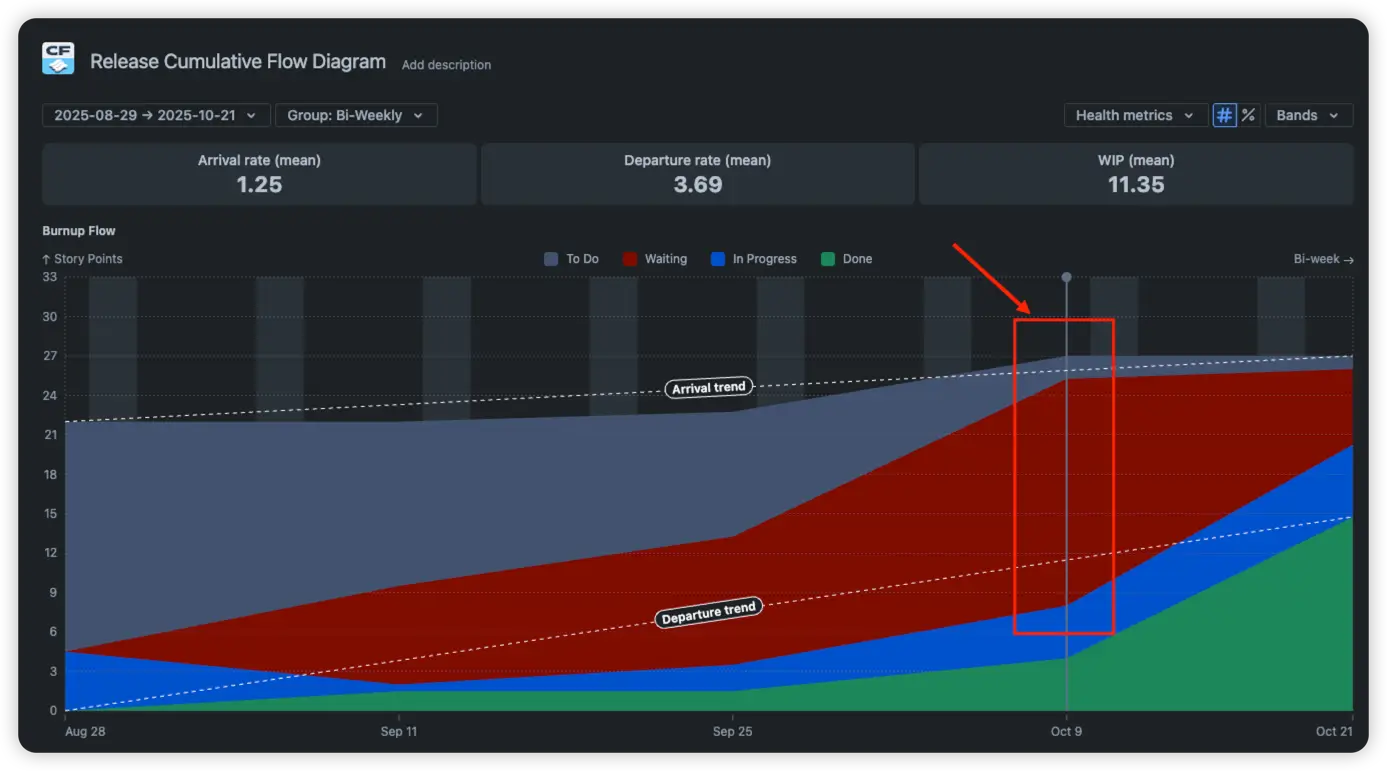
An ideal Release cumulative flow diagram shows smooth, evenly rising bands with consistent spacing. Viewing the chart with these bands makes it clear that the team has a bottleneck: issues are accumulating in the “Waiting” group. But this is only the tip of the iceberg. Let’s explore the additional insights that the Cumulative flow diagram for Releases can provide.
The chart offers two complementary views that let you interpret your data in different ways. The first is the burnup view (mentioned above), and the second is the burndown view. You can switch between them using the toggle located at the top of the settings panel.
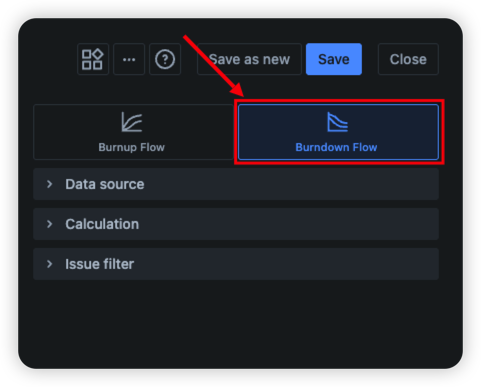
The key difference is that burnup is best suited for open or expanding scopes, such as Kanban boards or entire projects, where work can continuously arrive. Burndown, on the other hand, is a better fit for fixed-scope items such as releases, epics, or time-boxed goals.
This distinction is beneficial in our case because we are analyzing a release (a finite scope). At the start, we know exactly how much work is planned. The Initial scope line in the burndown view indicates that the current scope exceeds the original: it has increased by more than 20% (22 -> 27). This suggests that we should plan releases more carefully to avoid significant scope growth during execution.

The percent-normalized chart gives you a fresh way to view your data, using percentages instead of absolute values. Just click the % icon at the top of the chart to switch views. This is especially useful when you want to compare different teams or releases without worrying about scale differences. Example: Story Points for Team A versus Team B.

What you can see with it:
Why it matters: This view helps you compare releases or teams fairly, spot potential slowdowns, and see where work is piling up. It’s an excellent tool for keeping scope under control and making sure your releases stay on track.
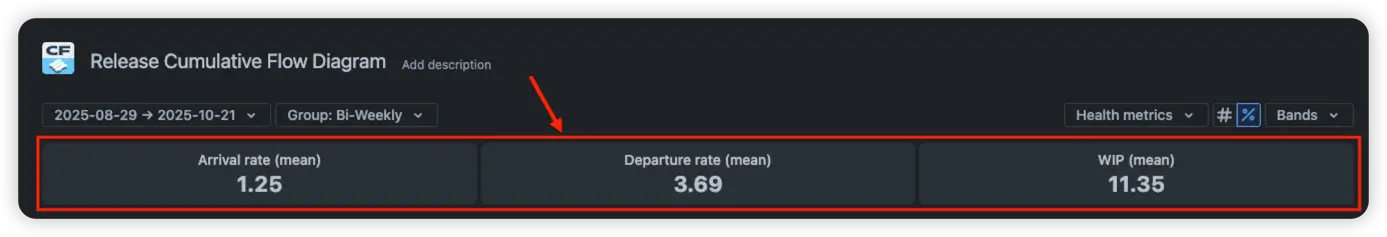
The Release cumulative flow diagram also provides a simple, intuitive way to monitor the overall health of your release without having to analyze every detail. At the top of the chart, you’ll find health metrics designed for quick understanding and decision-making. These three core metrics show the essential dynamics of your release:
These indicators help you instantly understand whether the release is stable, overloaded, or at risk.
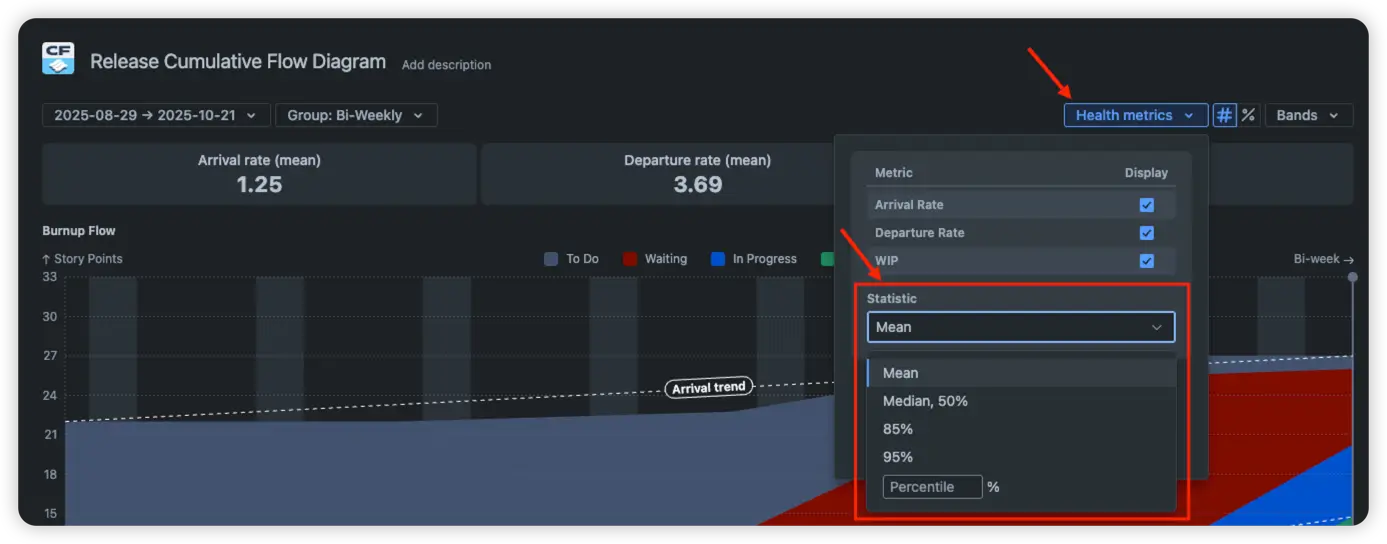
You can change how these health metrics are calculated. Open the Health Metrics dropdown and select a Statistic Method for the calculation, such as Mean, Median, or a percentile value. This flexibility allows you to adjust the metrics to reflect your team’s workflow better and highlight what matters most.
Tips for using these metrics effectively from the BB team 😉:
These metrics provide a clear snapshot of release health. They help you make decisions in time and keep your delivery predictable and under your control.
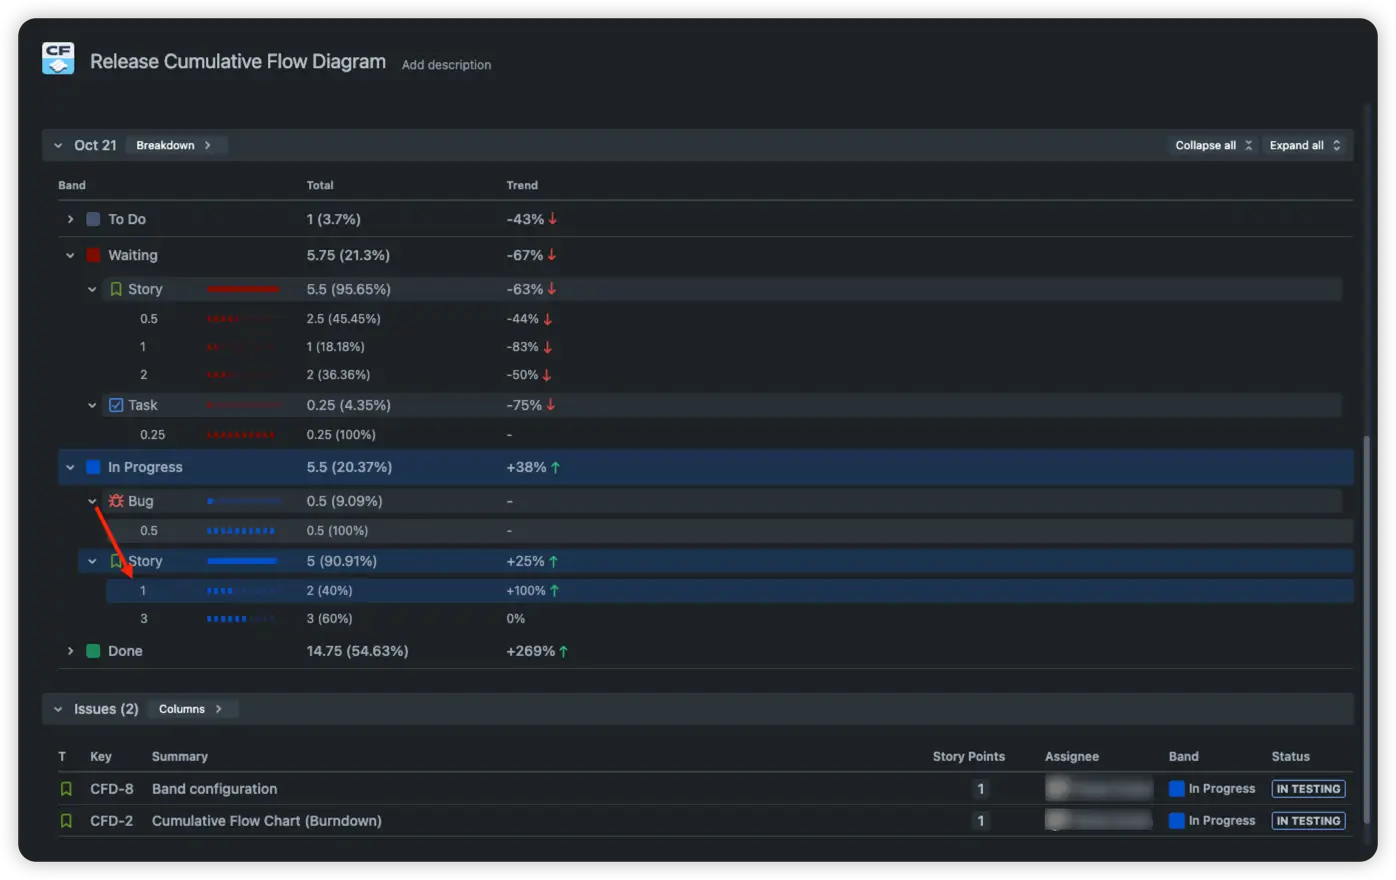
Click on any interval to open the breakdown section. You’ll see the default first breakdown level, which shows statuses or status groups with their corresponding metrics. You can then configure the following two breakdown levels by selecting any fields you need from the dropdown menu.
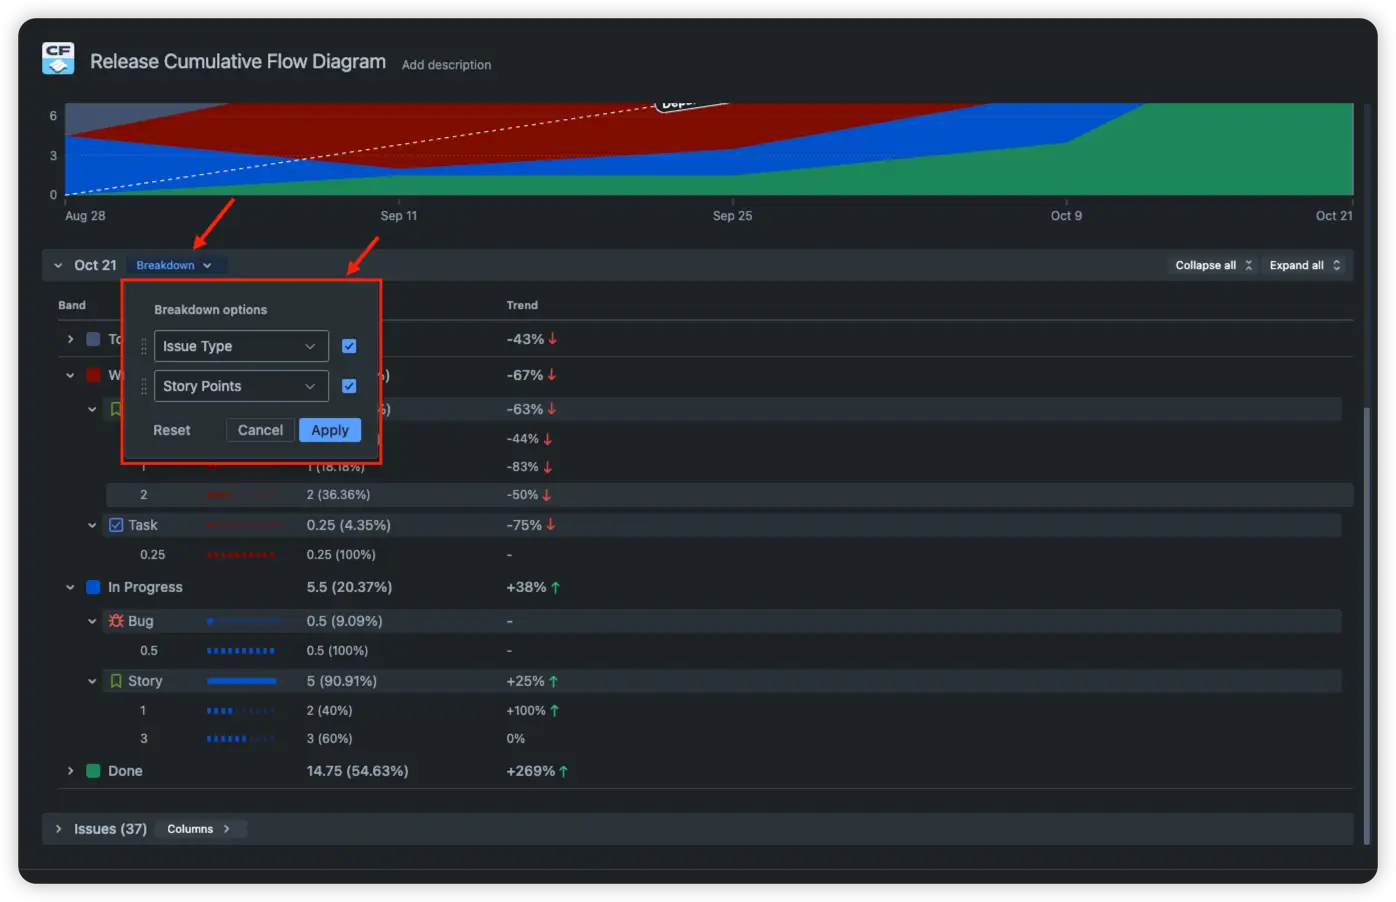
Bonus tip: Select any breakdown segment to instantly filter and view the related work items in the Issue List below.
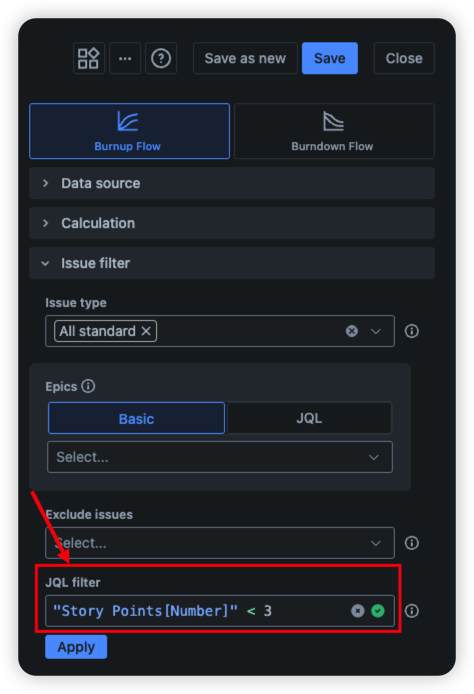
The Issue Filter section in the settings provides several options to narrow your scope. The most powerful one is the JQL filter, which gives you maximum flexibility and precision when filtering work.
Note: The only drawback is that you’ll need to know the JQL syntax to take full advantage of it.
Jira does not include a built-in Cumulative flow diagram for Releases, but our chart gives you everything you need to build a complete, insightful view of release flow and performance. With native Jira reports, you can’t:
❌ Track release progress: see how work moves across statuses over time and quickly identify where the release stands today.
❌ Analyze health metrics: arrival rate, departure rate, and WIP are not calculated; you are not giving an instant snapshot of release stability.
❌ Identify scope change: monitor how much work is added or removed during the release to prevent scope creep.
❌ Highlight flow efficiency insights: understand where work stalls, how long items stay in progress, and where bottlenecks form.
❌ Switch to percent view: compare releases or teams fairly by switching to percentage mode to remove scale differences.
❌ Add gadgets to dashboards: display the reports directly on Jira dashboards.
✅ Visualizes the whole workflow. Shows how work moves through every status over time, giving a complete picture of your delivery process.
✅ Highlights bottlenecks instantly. Areas where bands widen reveal exactly where work is piling up and slowing down.
✅ Tracks progress with historical context. Let's show you not just where you are today, but how you got there, day by day.
✅ Monitors scope changes. Clearly shows when new work is added or removed, helping you detect scope creep early.
✅ Focus on the scope you need. Filter everything you don’t need to.
✅ Supports accurate forecasting. Stable arrival and departure rates make it easier to predict delivery timelines.
✅ Reveals WIP trends. Helps you identify when your team is overloaded and promotes healthier workload distribution.
✅ Empowers continuous improvement. Perfect for retrospectives, helping teams identify patterns and refine processes over time.
Use our examples to build your use cases on the Jira Dashboard.
The Jira apps (plugins) used in these examples have a 30-day free trial and are completely free for teams under 10 people.
The Agile Reports and Gadgets app includes Release cumulative flow diagram functionality plus a wide range of additional charts and reports.
The Release cumulative flow diagram (CFD) is a visual tool that shows how a release progresses through its statuses over a selected period. It helps you track release progress, monitor scope changes, and easily identify bottlenecks.
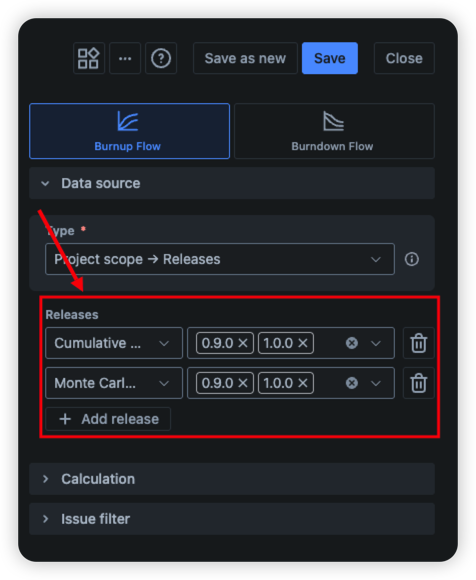
Yes! Our chart supports multiple releases in a single view. Simply add the additional releases in the Data Source section.
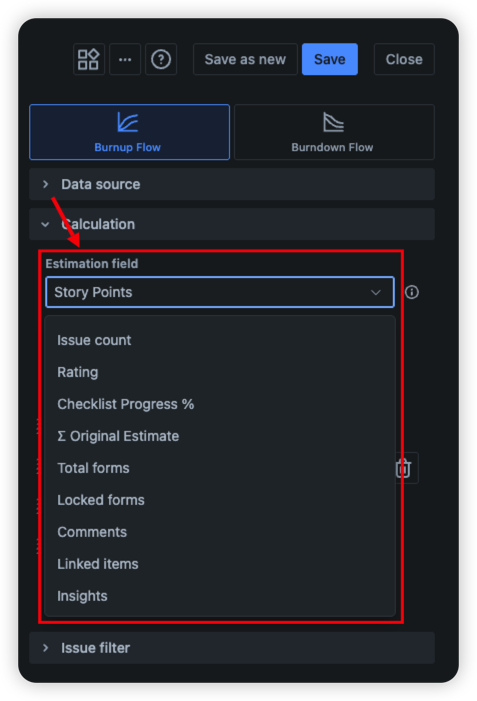
Absolutely. You can select any numeric custom field in the settings to use as the chart visualization's estimation metric.
Yes. In the Band Configuration, choose the option to display statuses. The chart will then show each status as a separate band, giving you a clear view of work distribution and flow.


.svg)

.png)
