Open settings to adjust filters, test different configurations, and see how your cycle time data transforms in real time.
Key features of the Cycle Time Chart
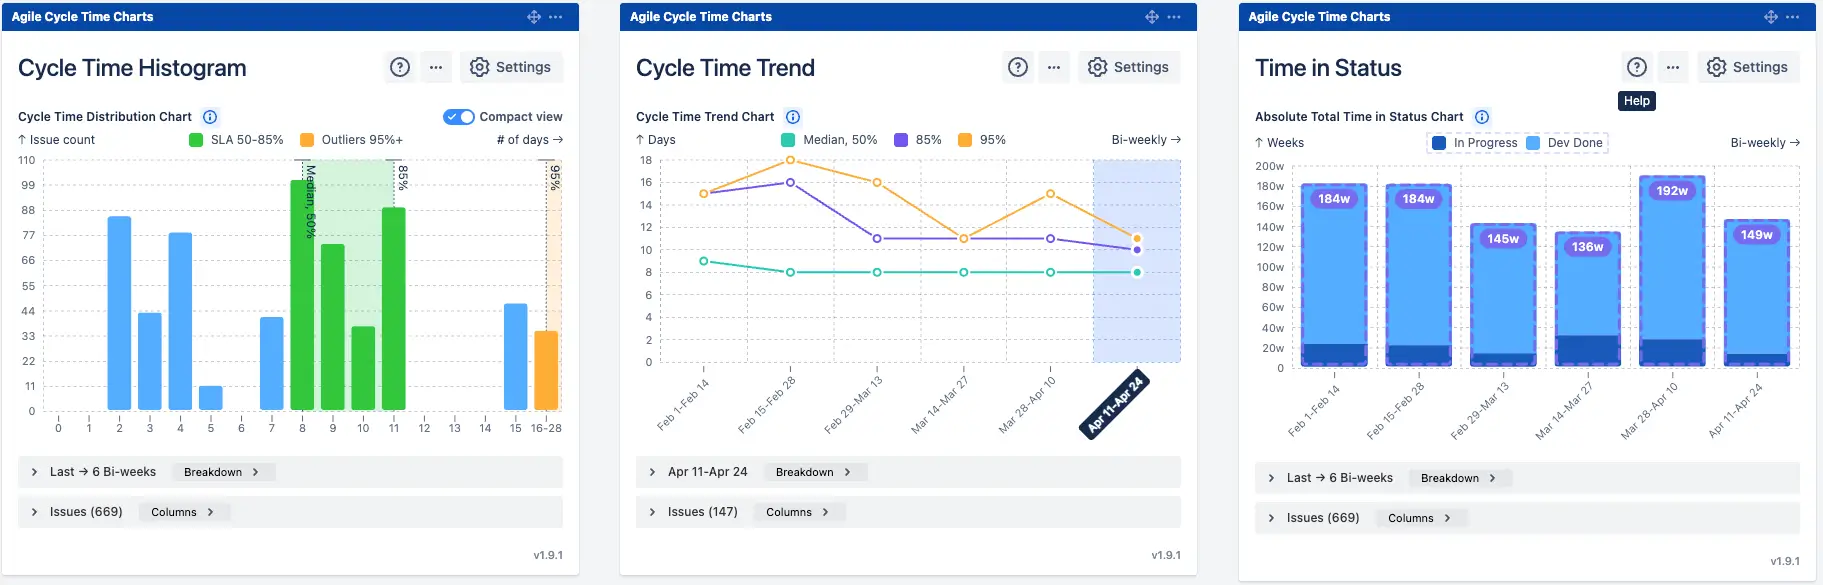
The Cycle Time Chart helps Agile teams visualize the time it takes for work items to flow through their process, from "in progress" to "done."
This chart offers a comprehensive look at your delivery performance by combining three powerful views - Cycle Time Histogram, Cycle Time Trend, and Time in Status -all as part of the Agile Cycle Time Chart app. Whether you're spotting delays, identifying outliers, or tracking long-term trends, the Cycle Time Chart turns raw Jira issue data into actionable insights.
How different roles use the Cycle Time Report
✅ Project Manager: I use the Cycle Time Chart to demonstrate to stakeholders how delivery speed has improved from sprint to sprint. It helps me back up timeline estimates with real data, rather than relying on a gut feel.
✅ Team Lead: It makes it obvious where we’re getting stuck - usually code review. That visibility helped us set a WIP limit and cut our average cycle time by two days.
✅ Scrum Master: The histogram lets me spot outliers right away. I bring those to retros so the team can discuss what went wrong and how to avoid it next time.
✅ Delivery Manager: With multiple teams shipping in parallel, I use the trend view to compare performance. It’s how I catch when one team starts slipping before it becomes a big problem.
Spot delays, trends, and outliers - all in AGILE CYCLE TIME CHART
The Histogram helps you understand how long work typically takes - and how consistent your delivery process really is.
It visualizes the distribution of completed work items by their cycle time (e.g., number of days), grouping them into time-based columns. This gives you a quick, data-driven snapshot of how smoothly work is flowing through your team’s process.
What the Histogram helps you do
See the big picture: Quickly spot how most work is performing - and whether cycle times are clustered or all over the place.
Identify outliers: Highlight issues that took unusually long, so you can dig into root causes and prevent future delays.
Track delivery consistency: Use percentiles (like P50, P85, P95) to set benchmarks based on real team data, not guesswork.
Uncover hidden delays: A long tail on the chart? It may be a sign of hidden blockers, handoff delays, or unclear scope.
Define healthier KPIs: Replace rigid deadlines with realistic, team-specific delivery goals grounded in historical data.
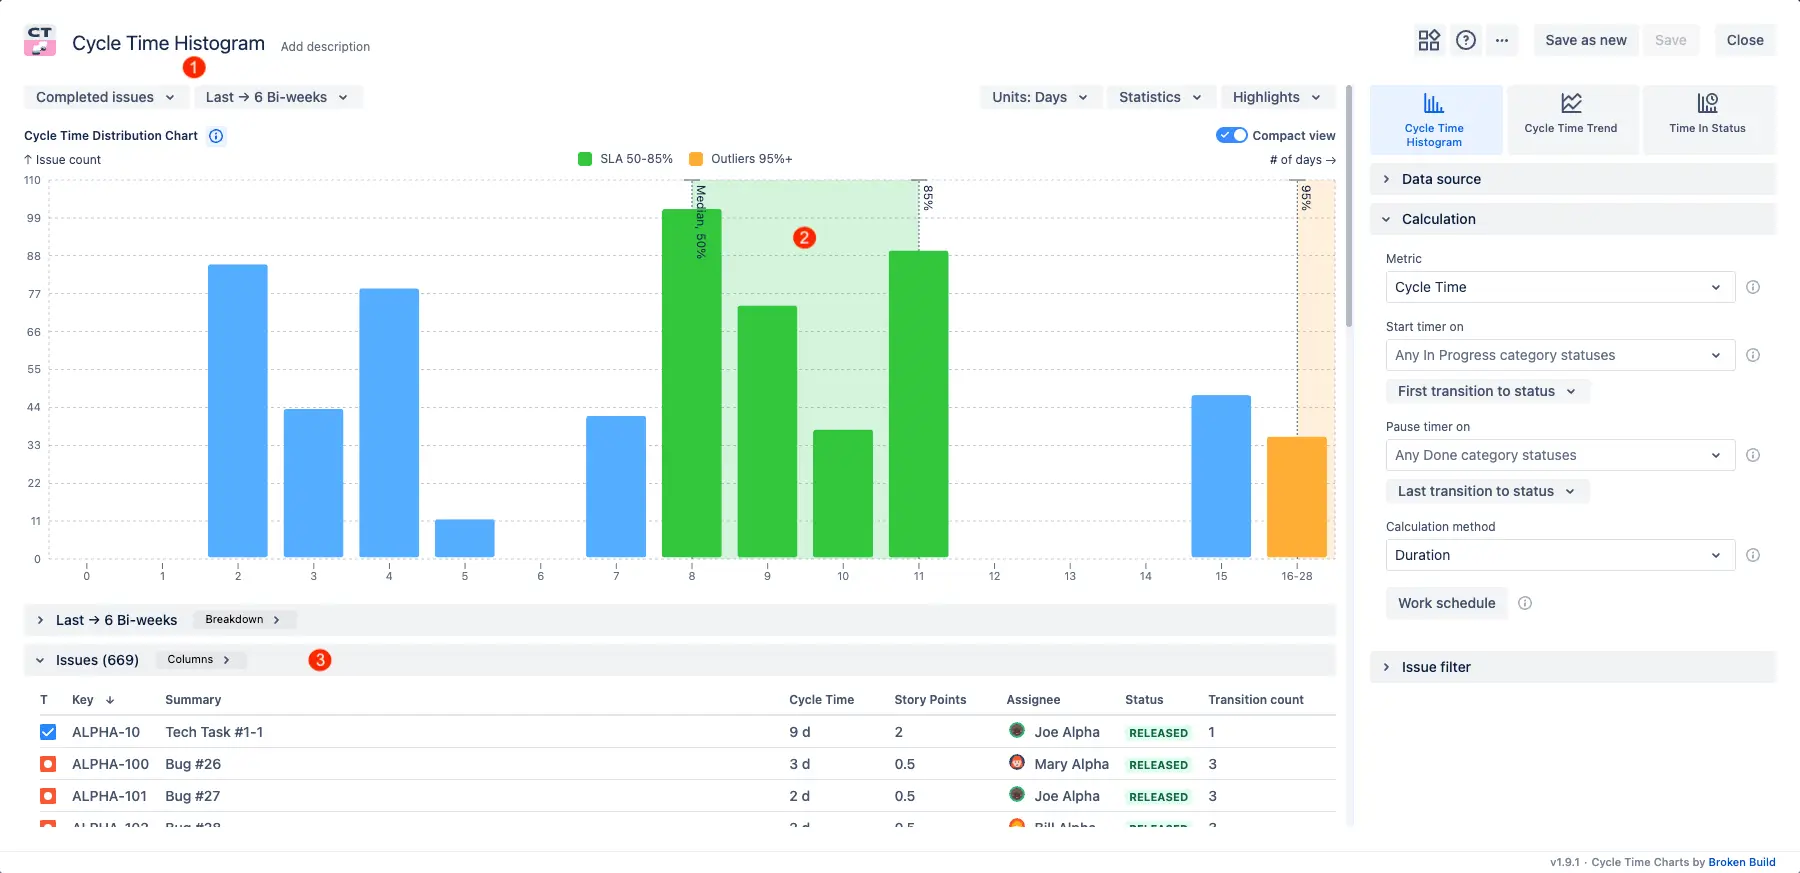
Example of the Histogram chart in Jira with default configuration
📊 How to read the chart:
The issue filter "Completed issues in the last 6 bi-weeks" (1️⃣) ensures the chart only includes issues that reached a completed status during that time frame. The green-highlighted bars (2️⃣) represent issues that fall within the 50–85% percentile range of cycle times, considered within the expected delivery SLA, while the orange and blue bars indicate outliers. The issue list below (3️⃣) provides a detailed breakdown of individual issues contributing to the histogram, including their cycle time, story points, assignees, and number of status transitions.
Explore the interactive Cycle Time Histogram
Dive into a live, clickable example of the Cycle Time Histogram chart. Open settings to adjust filters, test different configurations, and see how your cycle time data transforms in real time. Alongside the chart, you’ll find a detailed overview of all its features.
Try it now and uncover delivery insights your team can act on.
2. Key feature: Cycle Time Trend
The Cycle Time Trend chart tracks how your delivery speed changes over time, helping you understand whether your team is becoming more efficient or if delays are creeping in.
By visualizing average (or percentile) cycle times across weeks, sprints, or custom timeframes, this chart makes it easy to spot trends, respond to changes, and evaluate the impact of process improvements. It’s your delivery velocity, made visible and measurable.
What the Trend chart helps you do
Monitor delivery performance over time: Instantly see whether your team is speeding up, slowing down, or staying consistent.
Evaluate process changes: Did your new workflow, WIP limit, or team structure improve throughput? This chart shows the real effect.
Detect early warning signs: A slow, steady rise in cycle time? Catch it early before it becomes a pattern.
Support outcome-focused retros: Use historical trends to ground team conversations in data, not opinions.
Forecast future work more accurately: Reliable trend data helps you set more realistic expectations with stakeholders and product owners.
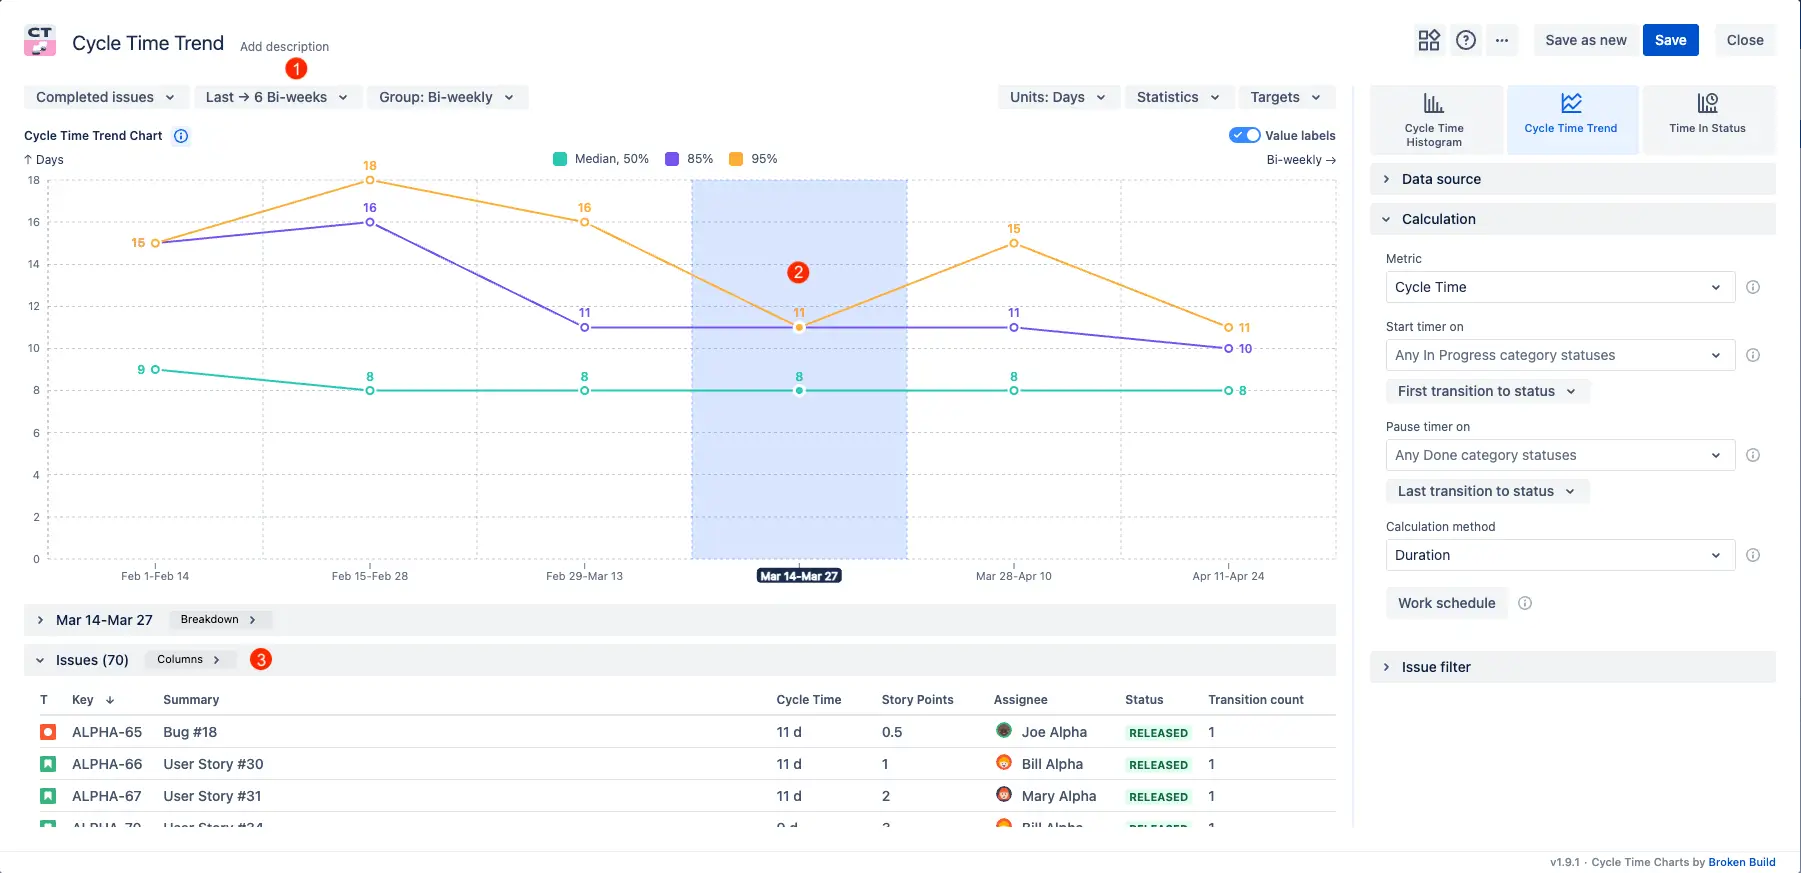
Example of Cycle Time Trend chart in Jira with default configuration
📊 How to read the chart:
The report displays data for completed issues grouped by bi-weekly intervals (1️⃣). This enables tracking how cycle times have changed over time. When a specific interval is selected (2️⃣), the chart highlights key statistics for that period: Median, 85th percentile, and 95th percentile. Which helps identify trends and spot anomalies in delivery performance. The issue list below (3️⃣) dynamically updates to show only the tickets completed within the selected bi-weekly interval, offering a detailed view of the underlying data behind the chart.
Explore the interactive Cycle Time Trend chart
Jump into a live example of the Cycle time trend chart to explore how your cycle time evolves over time - across teams, issue types, or estimation ranges. Adjust filters, reveal hidden patterns, and track delivery trends with percentile-based precision.
See where your process slows down, how consistent your team is, and what to improve next - backed by real Jira data.
3. Key feature: Time in Status
The Time in Status chart gives you deep visibility into where work actually spends time in your process, not just where it’s supposed to.
Instead of just showing when work starts and finishes, this report breaks down how long each issue stays in each workflow status. It updates automatically with your Jira data, helping Agile teams pinpoint slowdowns, reduce handoffs, and continuously improve their delivery pipeline.
What the Time in Status helps you do
Find real bottlenecks: Quickly see where work is sitting too long, whether it’s in “To Do,” “In Review,” or “Waiting for QA.”
Reduce hidden wait times: Surface delays that might be invisible in cumulative metrics, such as cycle time alone.
Improve process flow: Use the data to streamline transitions, rebalance workloads, and minimize idle time.
Support meaningful retros: Bring real status-by-status insights to the team and focus discussions on what actually slows work down.
Track improvements over time: Compare average time in status across sprints, releases, or teams to see whether process changes are working.
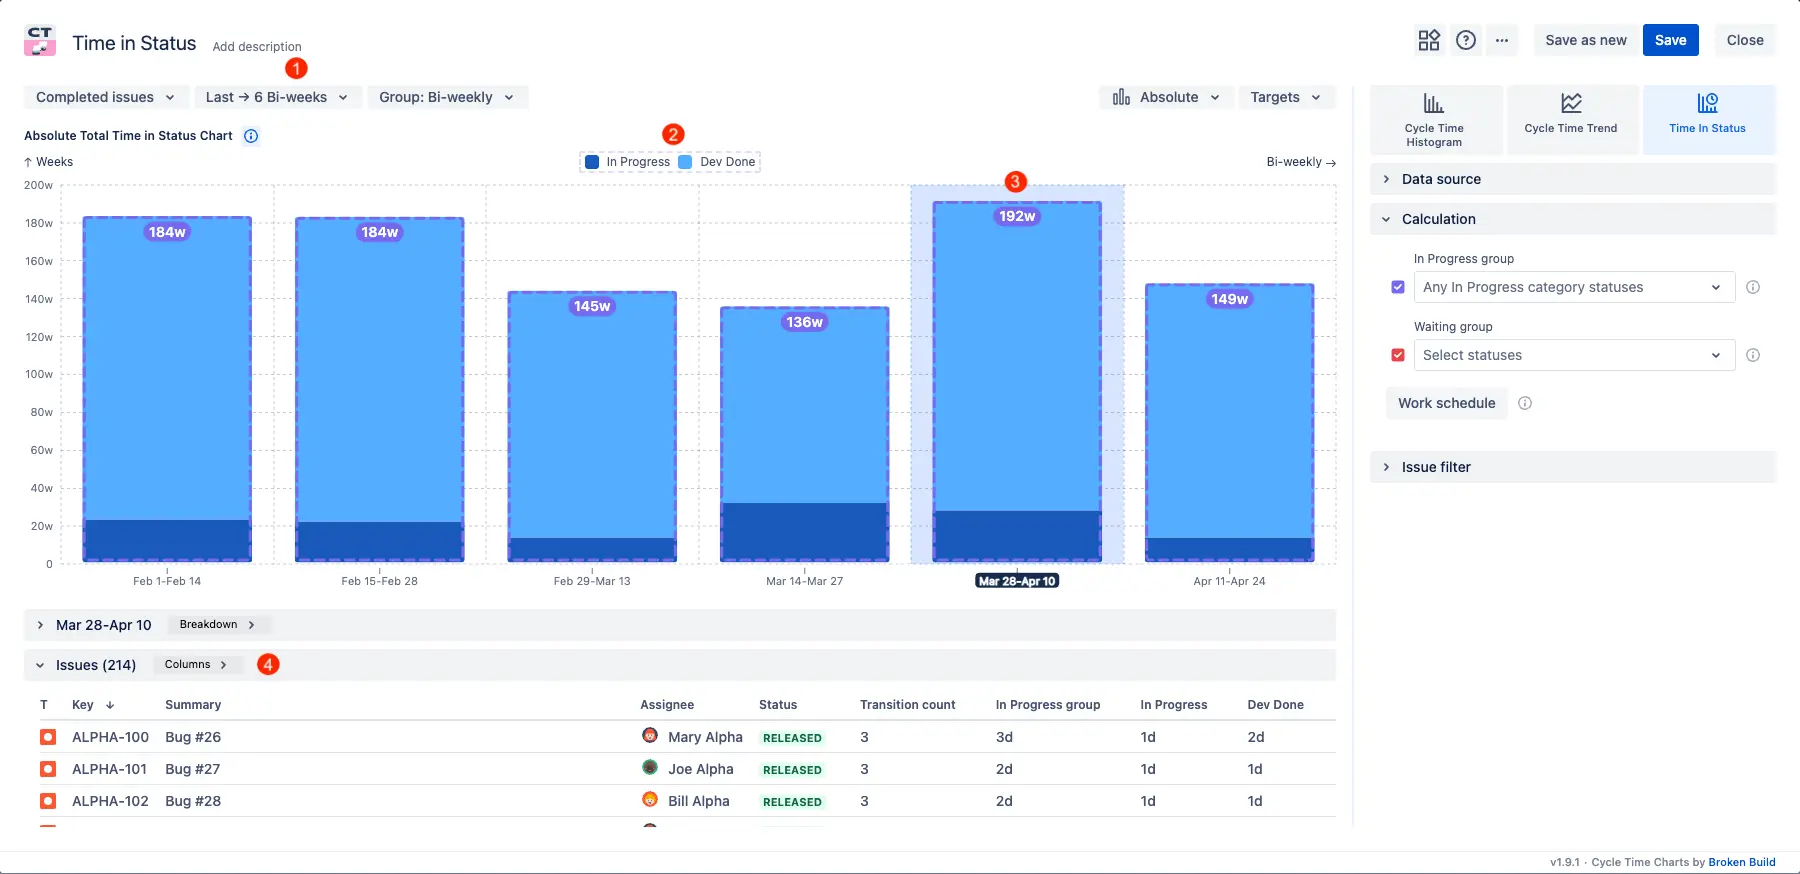
Example of Time in Status chart in Jira with default configuration
The report visualizes completed issues over the last 6 bi-weekly intervals, grouped by bi-week (1️⃣). The stacked bar chart (3️⃣) shows how much time issues spent in each status per interval, with each colored segment representing time in a specific status. These statuses (2️⃣) are listed in the legend and correspond to distinct workflow steps like “In Progress,” “Code Review,” “QA,” etc.
When a specific bi-week is selected (3️⃣), the issue list below (4️⃣) updates to show the issues that were completed in that interval. This table includes details such as assignee, final status, transition count, and a dedicated column for each status, showing exactly how much time each issue spent in that workflow step, providing full transparency into where time is being spent during delivery.
Explore the interactive Time in Status chart
Explore a live, clickable example of the Time in Status chart - interact with the chart directly, modify filters, experiment with various settings, and instantly see how the data shifts. Next to the chart, you’ll discover an in-depth explanation of how it works.
Start exploring and unlock meaningful performance insights.
What about the native Jira cycle time
Jira does not include a native Cycle Time Chart - and especially not one with the flexibility or depth teams need for real performance insights.
There’s no built-in way to create a Cycle Time Histogram, track Cycle time trends over time, or break down Time in status on the Jira Dashboard. While Jira offers basic control chart functionality in specific project types, it’s limited, static, and not configurable for most real-world workflows.
What you can do with the Agile Cycle time chart app (that Jira can’t)
With the Cycle Time Chart app, you unlock cycle time reporting power that Jira simply doesn’t offer:
Add interactive Histogram gadgets to any Jira Dashboard
Perform both high-level (“helicopter view”) and granular deep-dive analyses
Filter by any Jira field - like priority, epic, label, fix version, custom fields, and more
Configure cycle time start/end points to match your actual process
Use any data source - Kanban or Scrum boards, Jira projects of any type, JQL queries, or saved filters
Apply advanced settings to group statuses, exclude weekends, set thresholds, and more
In short: Jira shows you the what - this app shows you the why, where, and how to improve.
Advantages of using the Cycle Time Charts
Real-time insights based on live Jira data
Full visibility into how long work spends in each stage of your process
Customizable cycle time definitions to match your team’s workflow
Flexible filtering by any Jira field (epics, priorities, labels, etc.)
Supports both high-level trends and detailed issue-level analysis
Tracks averages and percentiles (P50, P85, P95) for more accurate planning
Highlights bottlenecks, delays, and outliers automatically
Dashboard gadgets for always-visible cycle time reporting
Ideal for retrospectives, continuous improvement, and forecasting
Works with any Jira project type, board, or JQL query
Scales easily across teams, projects, and Agile frameworks
The Agile Reports and Gadgets app includes Cycle time chartsfunctionality and a multitude of other reports/charts.
Frequently Asked Questions
1. What is a Jira cycle time?
A Jira cycle time shows how long it takes for work items to move through your workflow — typically from the first “In Progress” status to “Done.” It helps teams measure delivery speed, identify bottlenecks, and improve process efficiency.
In native Jira, cycle time can be viewed via the Control Chart, but it is limited in flexibility and depth. It doesn’t support customizable cycle time definitions, advanced filtering, or detailed breakdowns, and there is no built-in way to track trends over time or analyze time-in-status across workflows.
With advanced solutions like Agile Cycle Time Chart by Broken Build, teams can build interactive reports with full control over cycle time definitions, filter by any Jira field, and analyze both high-level trends and detailed issue-level data. The charts can be added as Jira dashboard gadgets and support multiple data sources, including boards, projects, and JQL queries.
This enables teams to track percentiles (P50, P85, P95), detect bottlenecks and outliers, and gain actionable insights to improve delivery predictability and workflow performance directly in Jira.
2. Does Jira include a native cycle time chart?
No, there is no native Jira cycle time chart. Jira does not provide built-in cycle time histograms, time-in-status reports, or cycle time trend views on the dashboard. This app fills that gap with real-time, customizable cycle time reporting tools. With Agile Cycle Time Chart, you get all three views in one gadget - all powered by your Jira data directly on the Jira Dashboard.
3. Can I add Cycle time charts to the Jira dashboard?
Yes. You can create multiple dashboard gadgets for each chart and configure them for teams, projects, or filtered views.
4. Is it compatible with both Scrum and Kanban boards?
Yes - whether you're using Kanban or Scrum, the app lets you build a Scrum cycle time or a Kanban cycle time chart by selecting any board type, project type, or JQL-based filter. Just set your own start and end statuses to measure cycle time based on your process.
5. Is it possible to filter data on Cycle Time Charts?
Yes. You can filter by any standard or custom Jira field, such as assignee, epic, sprint, priority, issue type, and more.
6. Does the Cycle time chart gadget update data automatically?
Yes. All charts reflect real-time data from your Jira instance. No manual refresh or exports required.
7. Is the Cycle time chart app secure and performance-optimized?
Yes. The app is built following Atlassian security best practices and is performance-tested to handle large datasets efficiently.
8. Who is Cycle time graph app for?
Scrum Masters, Delivery Managers, Product Owners, Engineering Leads, and anyone looking to improve delivery flow and visibility in Jira.


.svg)


.png)
