
Thank you! Your submission has been received!
Oops! Something went wrong while submitting the form.


The Sprint rollover chart helps Agile teams and leaders visualize how much of the planned work is carried over into the next sprints. Whether you track a single team or multiple Scrum boards, this real-time chart surfaces recurring rollover trends to help improve planning and delivery flow.
Trend lines, averages, and ratios provide context for understanding whether rollover is improving or getting worse over time. This makes it easier to inspect and adapt team practices, improve estimation accuracy, and have evidence-based discussions during sprint reviews and retrospectives.
The Sprint rollover report is part of the Agile Velocity Chart Gadget app - a comprehensive toolkit for visualizing velocity trends, commitments, and delivery consistency across teams directly on Jira dashboards.
✅ Delivery Leaders (Managers / RTEs): Inspect rolled-over work across multiple teams to evaluate planning reliability vs. actual outcomes. Use rollover trends to identify recurring risks early, adapt program-level commitments, and maintain stakeholder trust through evidence-based transparency.
✅ Scrum Masters: Analyze carried-over backlog items at the sprint level to inspect and adapt team practices. Highlight recurring unfinished work, refine estimation and capacity planning, and facilitate retrospectives to strengthen the Definition of Done and improve sprint reliability.
✅ Agile Coaches: Leverage rollover data to assess team flow efficiency and long-term sustainability. Coach teams on improving delivery consistency, encourage continuous improvement practices, and align scaling practices with organizational goals to enable healthier Agile delivery.


Get clarity on unfinished work by tracking the sprint rollover. It’s one of the 10 essential velocity metrics you can monitor across one or multiple Scrum teams and see how carried-over work evolves across sprints, and compare Scrum teams' performance on one Jira dashboard.
⚙️Default settings:
Analyze rollover trends across multiple Scrum teams in a combined view, or focus on a single team - all within one Jira dashboard.
✅ With these insights, you can:
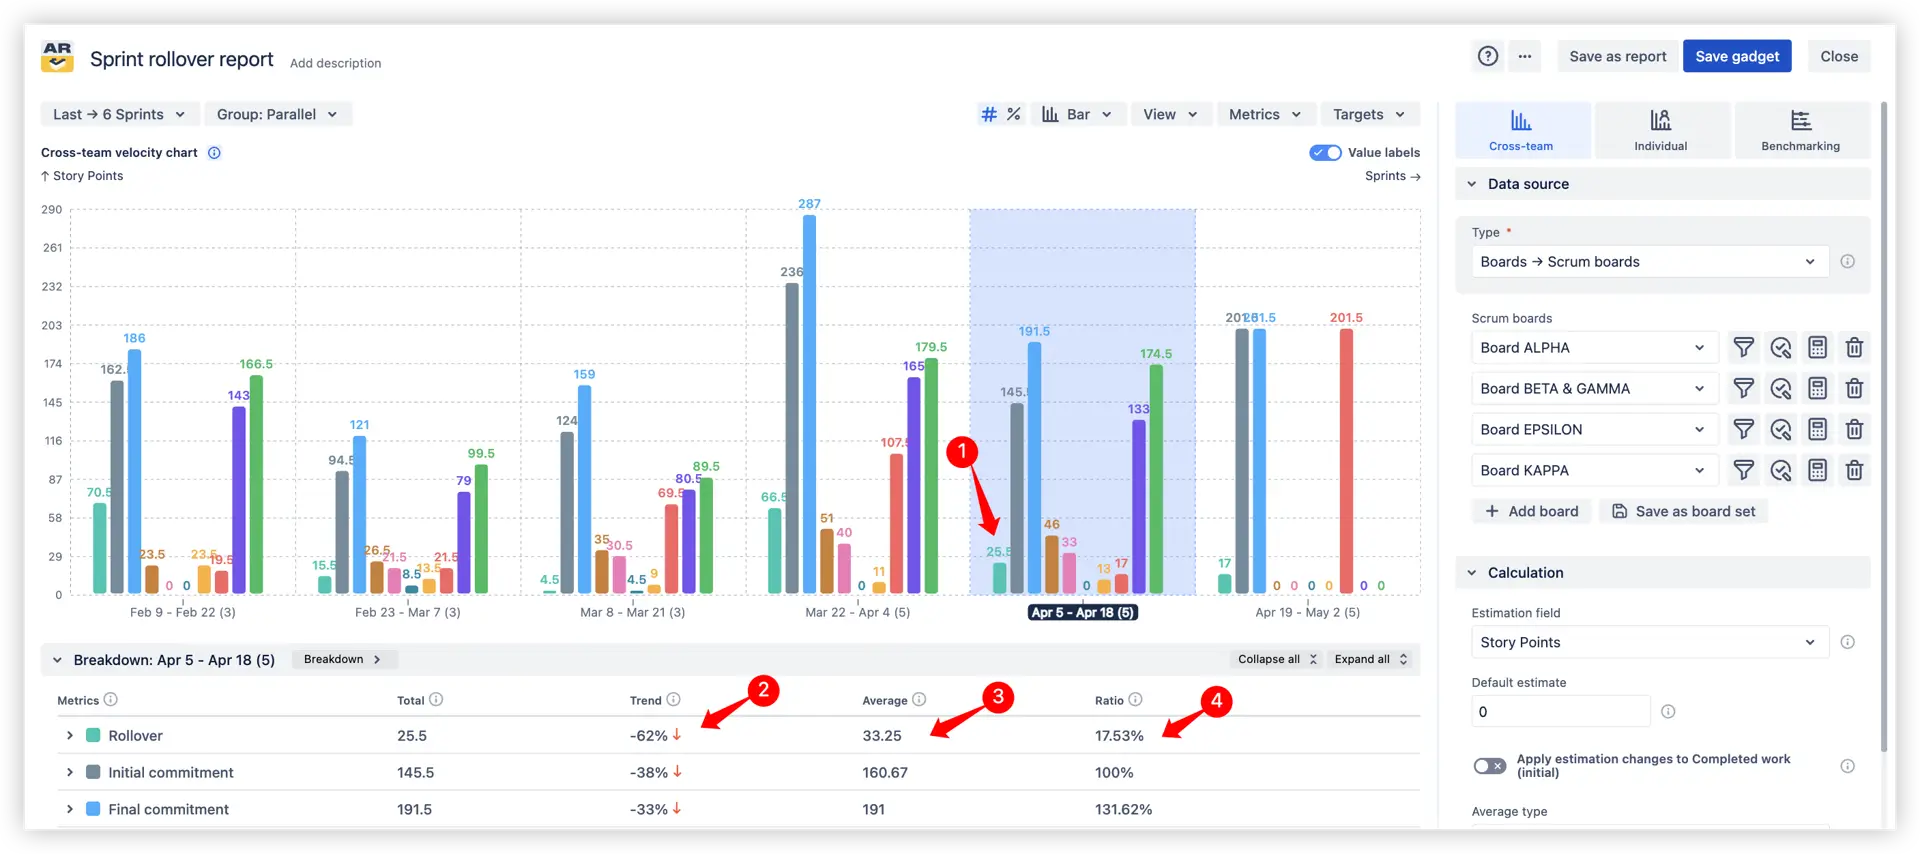
Apply filter by rollover metric (1️⃣) to better focus on unfinished work carried over into the next sprint.
Once the filter is applied, Breakdowns let you segment the data, while the Issue list shows which specific issues contribute to it.
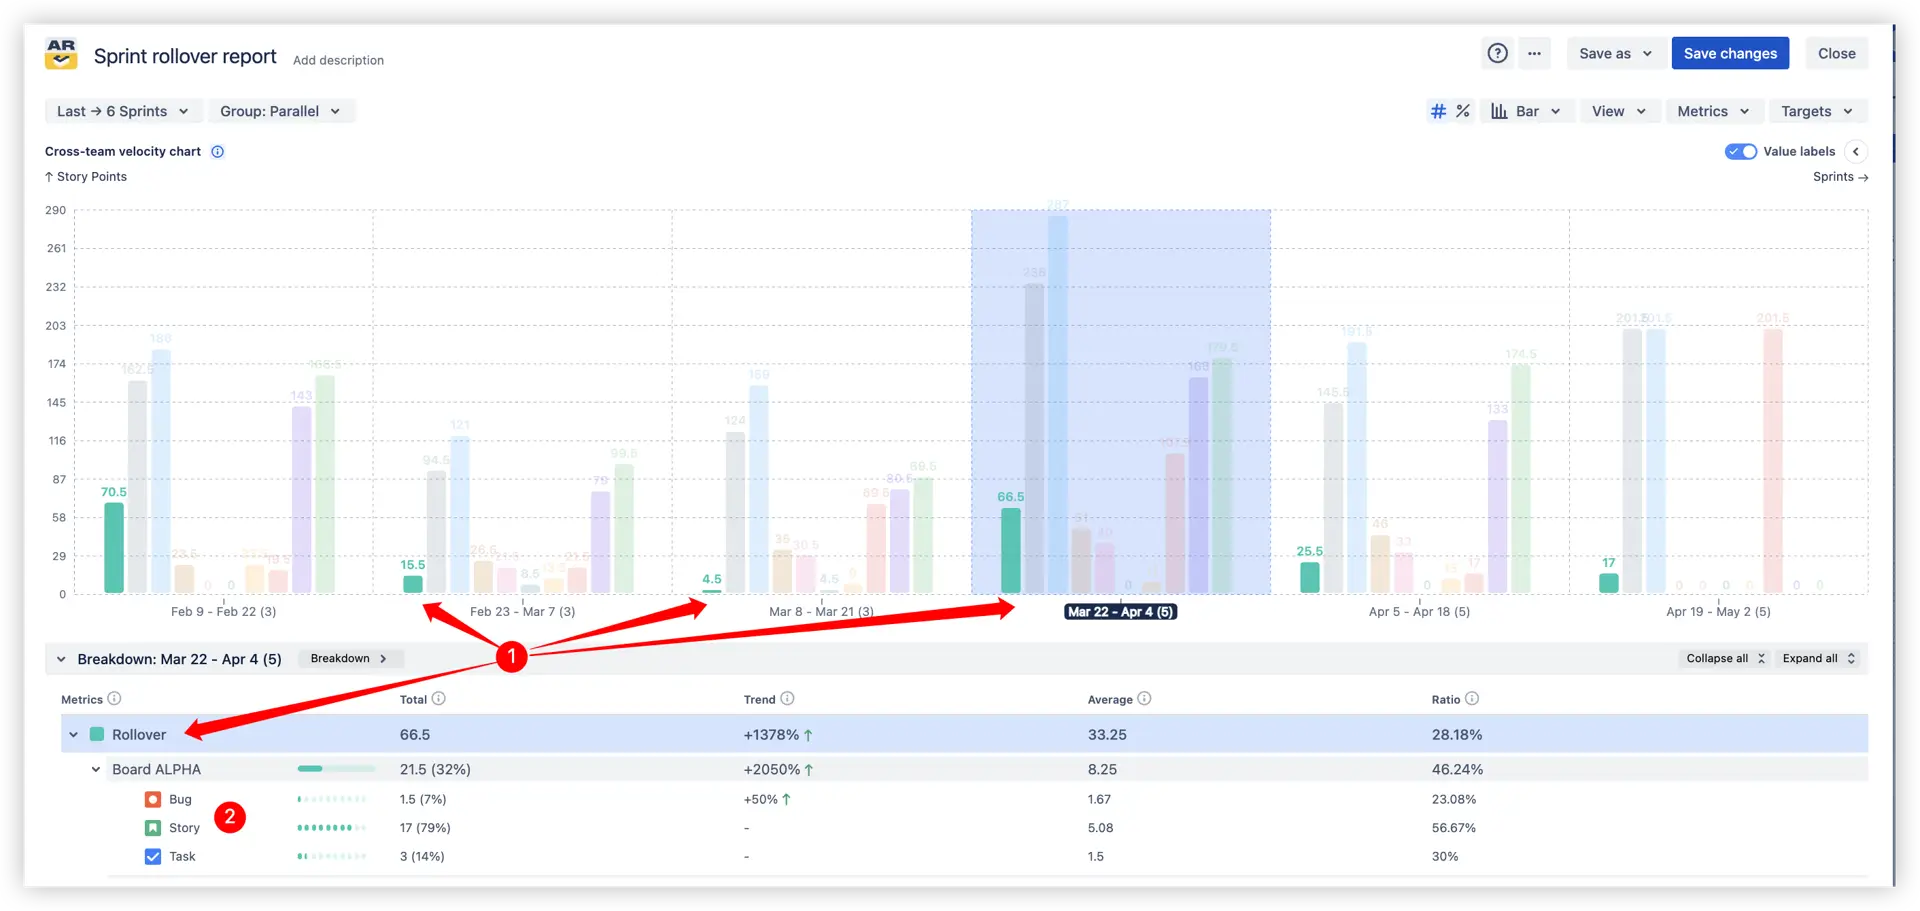
🔎 Breakdowns
Segment sprint rollover metric by any Jira field (e.g., board, issue type, status) to see which categories contribute most to carried-over work. You can also switch views to analyze data by projects, releases, epics, and more:

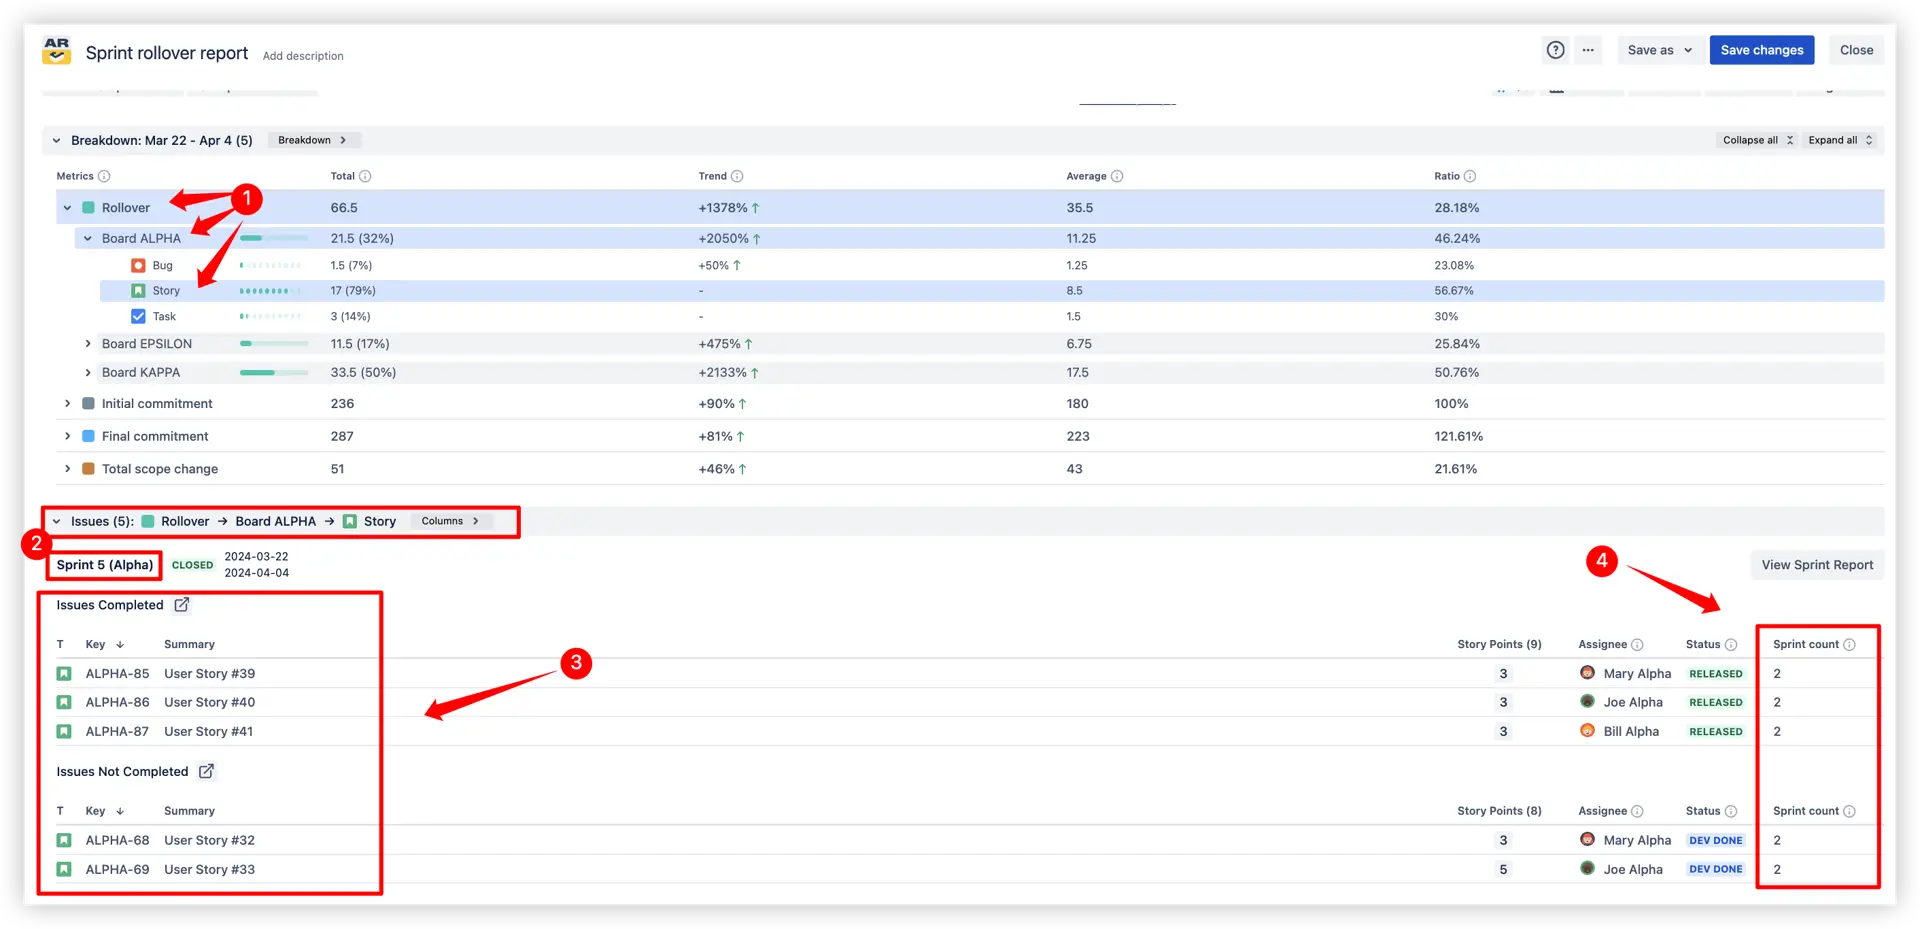
📋 Issue list
Get deeper insights into spilled-over work items: by applying filters for rollover, board, and stories (1️⃣), you can identify exactly which work items were moved forward from previous sprints.
The Issue list splits items into Completed and Not Completed, so you can clearly see what was delivered and what is still pending. Each work item also includes a Sprint count, showing how many sprints it has already been part of - helping you spot long-running items that repeatedly roll over.
✅ With these insights, you can:
Switch the chart to percentage mode to analyze rollover in relation to your team’s total commitment - not just in absolute story points.
This real-time perspective helps teams instantly see what portion of planned work was carried over into the next sprints, making delivery insights more actionable and comparable.
%20mode%20example.webp)
✅ With these insights, you can:
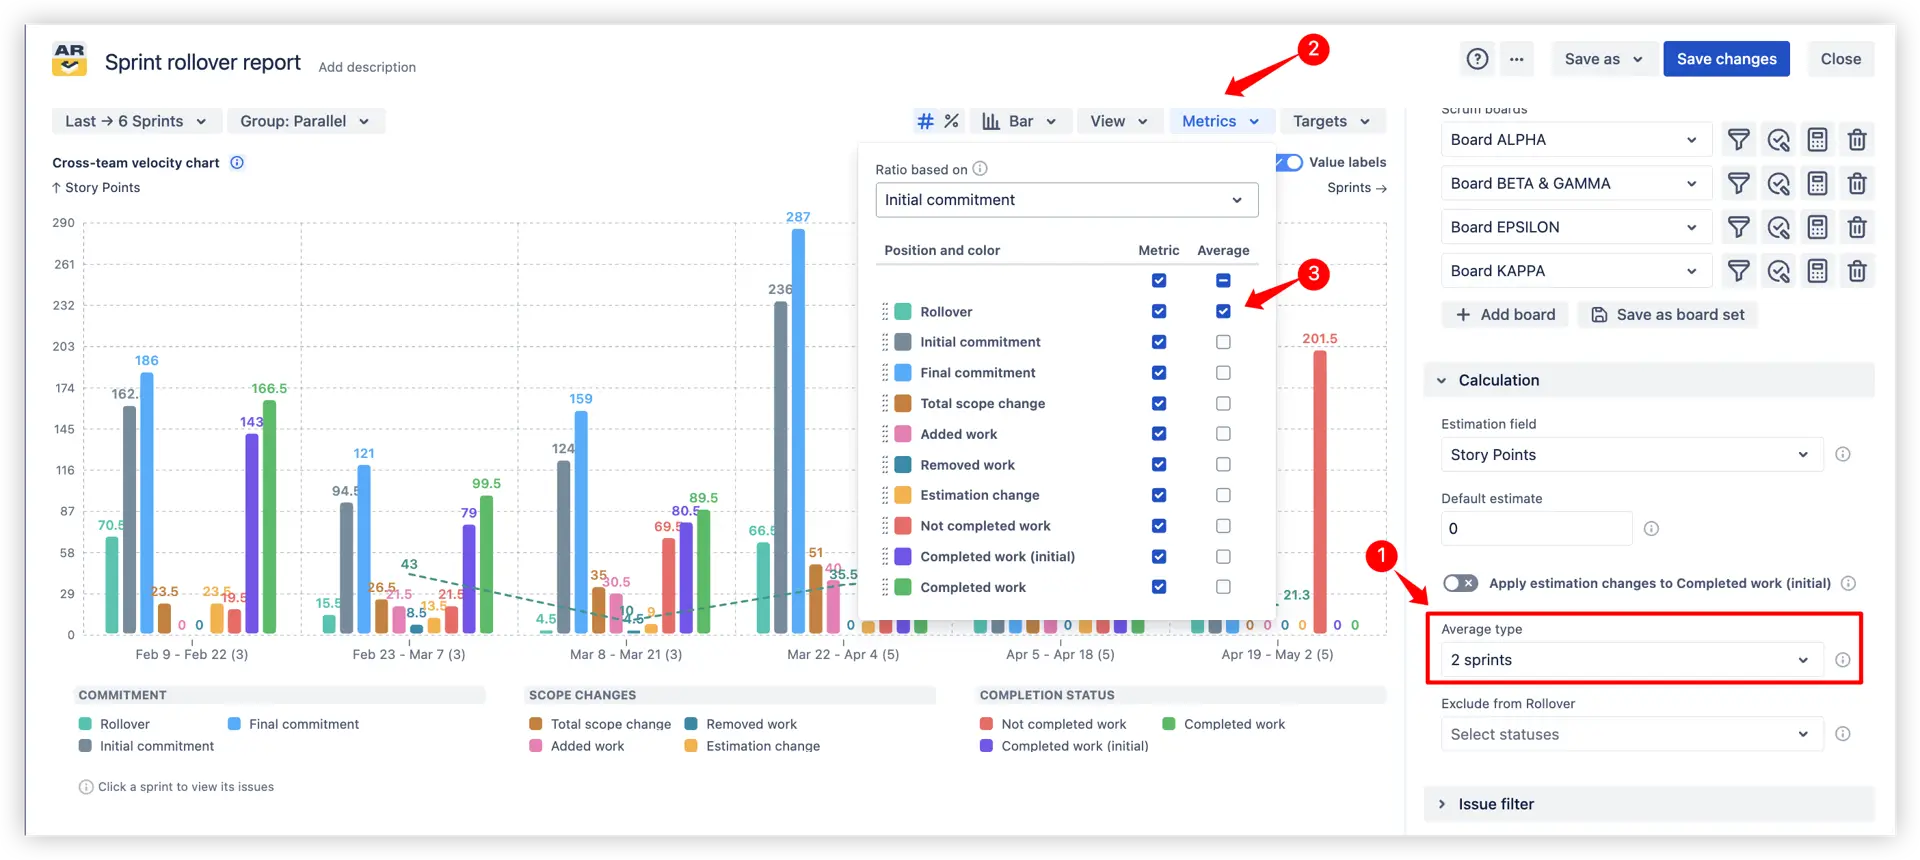
Add a moving average trend line to smooth out short-term sprint fluctuations and reveal how carryover behaves over time.
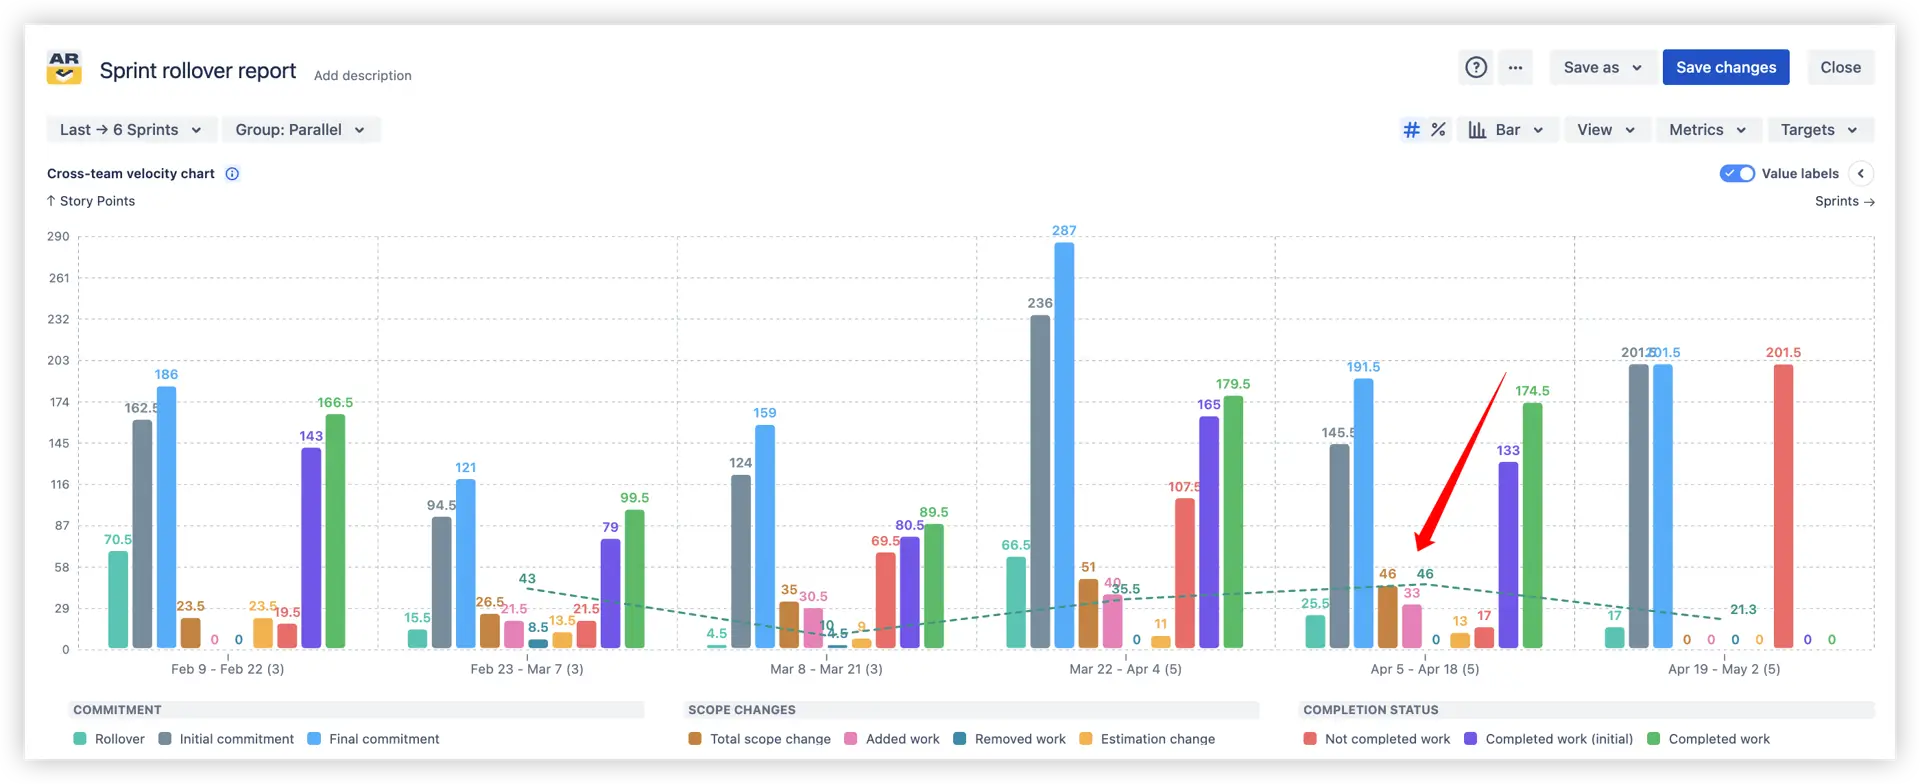
By configuring the average type (e.g., 2 or more sprints), you can monitor whether rollover is increasing, stabilizing, or decreasing - helping teams spot delivery shifts before they escalate.
⚙️ Custom settings:
✅ With these insights, you can:
Set custom targets for sprint spillover (1️⃣) to define acceptable thresholds and track how teams perform against them (3️⃣).
You can configure the target as an absolute value (e.g., 15 SPs) or a relative ratio - based on Initial or Final commitment (2️⃣) - to align measurement with your planning approach.
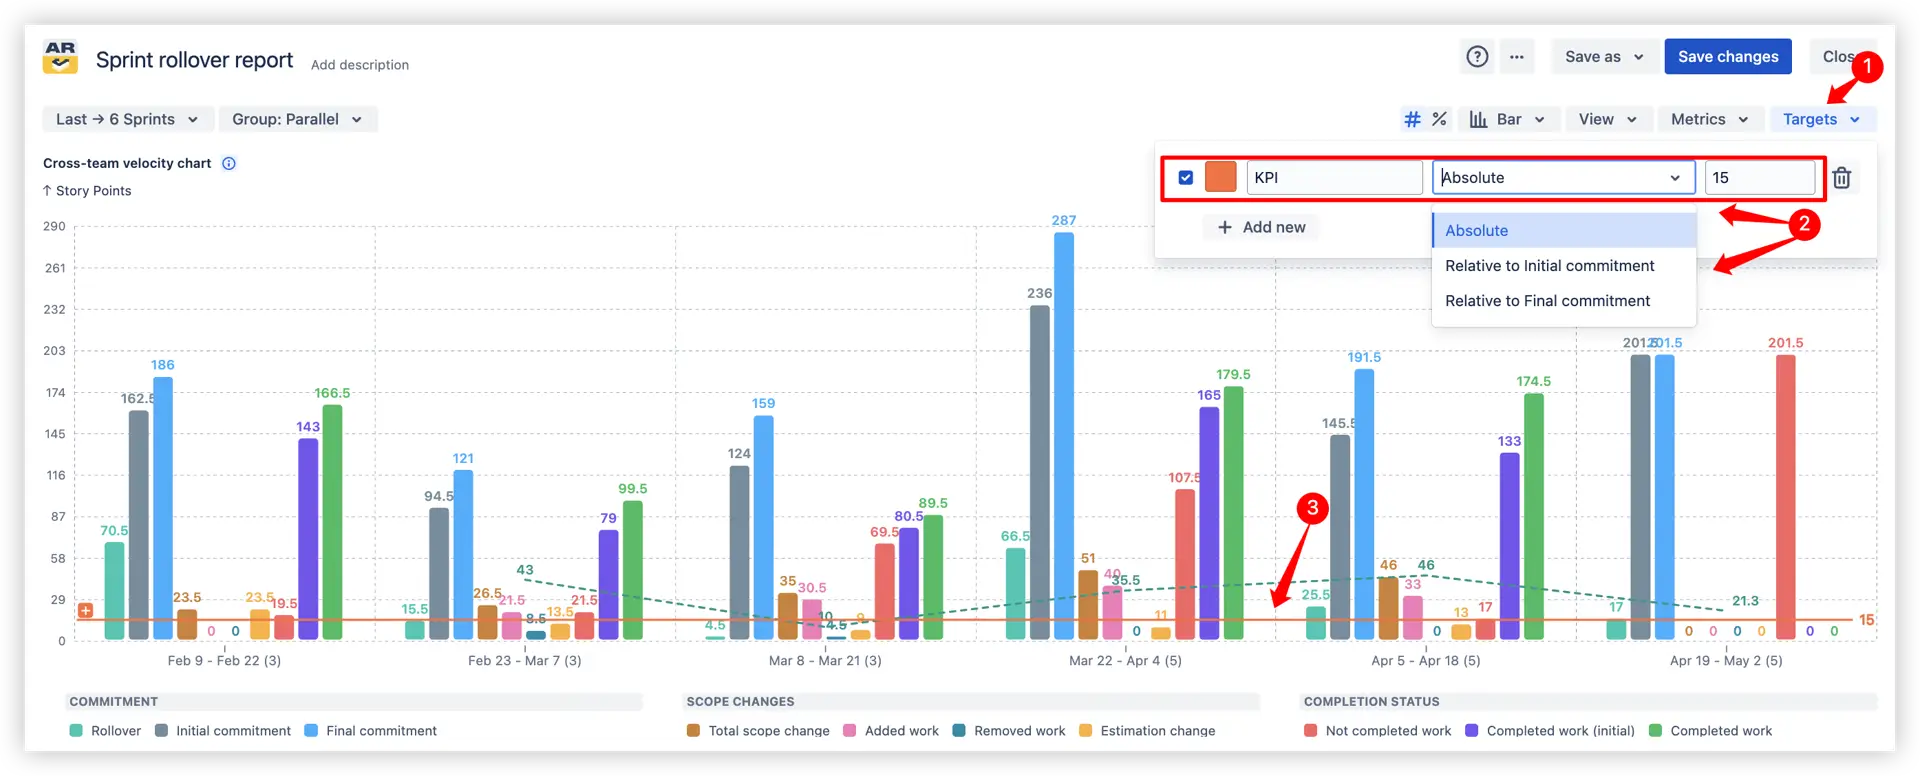
This feature transforms the rollover data into a measurable KPI, allowing Agile leaders to assess how consistently teams meet their delivery commitments and how much work spills over beyond the planned scope.
✅ With these insights, you can:
Compare how much work was rolled over versus initially committed in each sprint to spot planning gaps and improve future commitments.
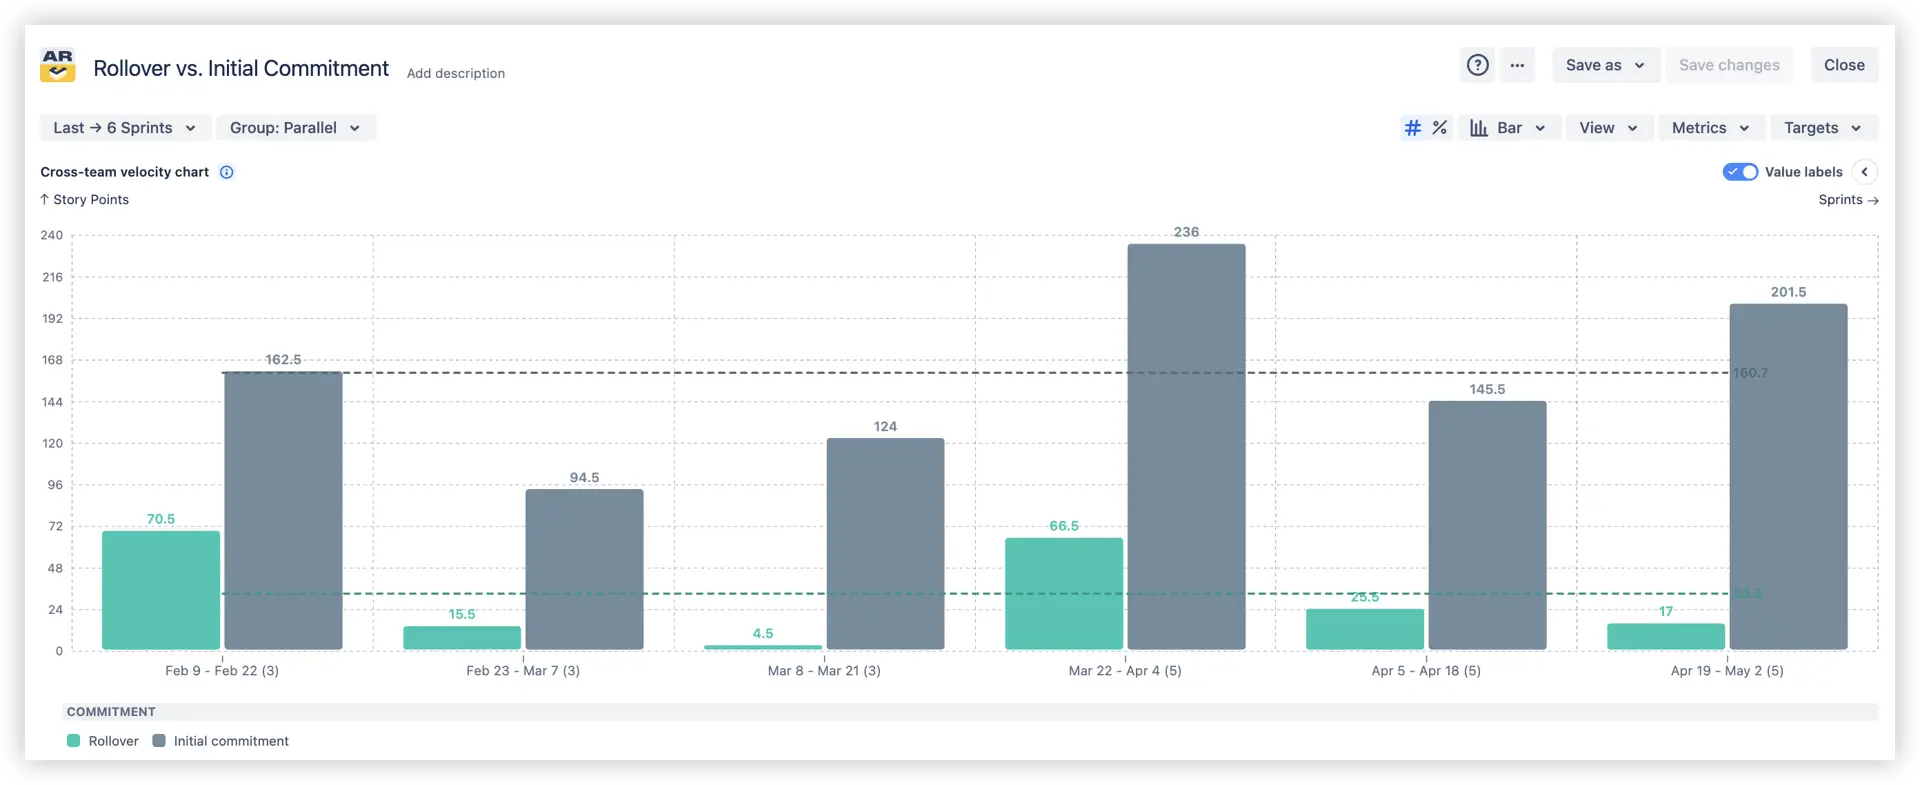
This visualization helps teams assess whether sprint goals were realistic and how consistently they meet initial commitments over time.
⚙️ Custom settings
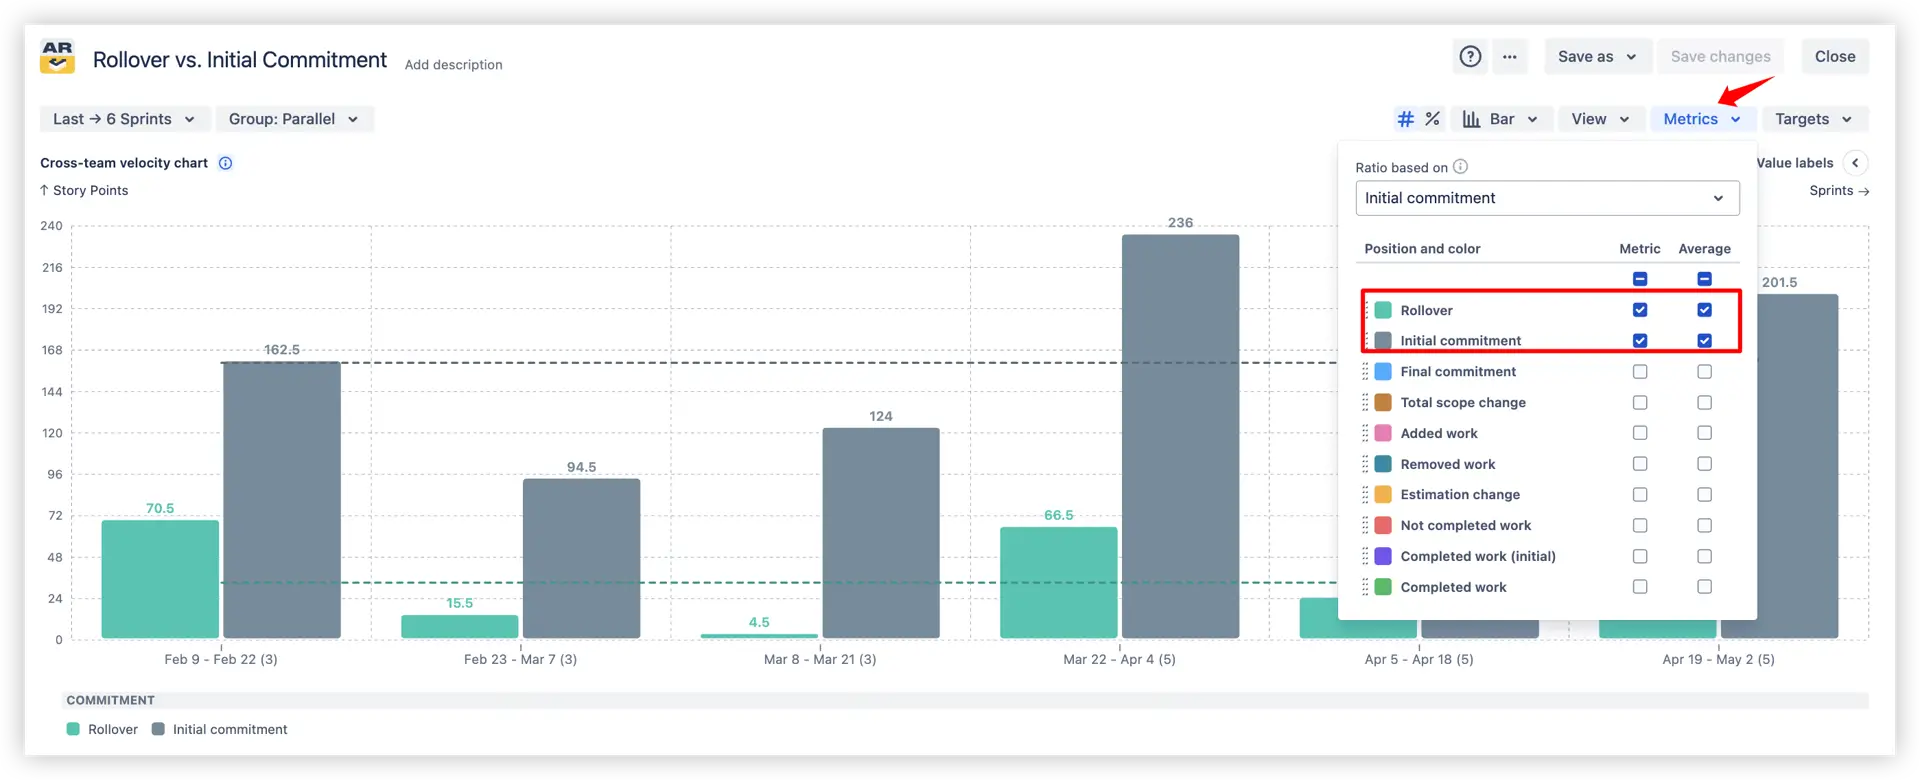
✅ With these insights, you can:
Filter out specific statuses (e.g., To Do, In Progress, Released) from the rollover calculation to keep metrics focused only on relevant unfinished work.
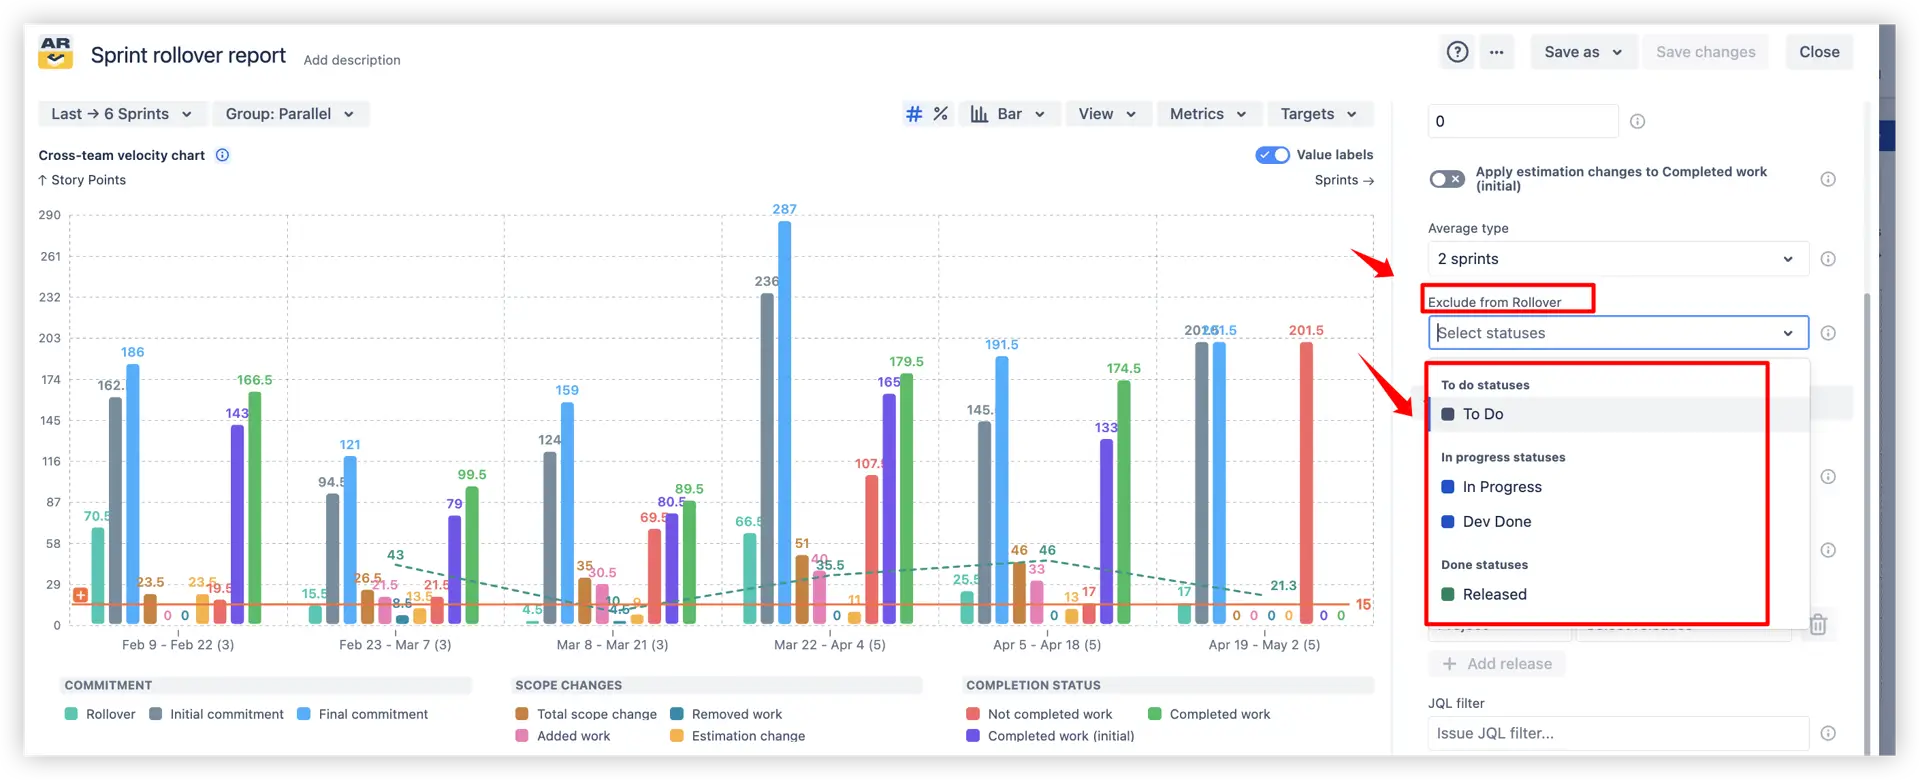
✅ Helps ensure accurate rollover ratios and prevents inflated results caused by items that shouldn’t be counted.
Apply multi-level filters to refine your sprint rollover analysis - by issue type, epic, release, or custom JQL query.
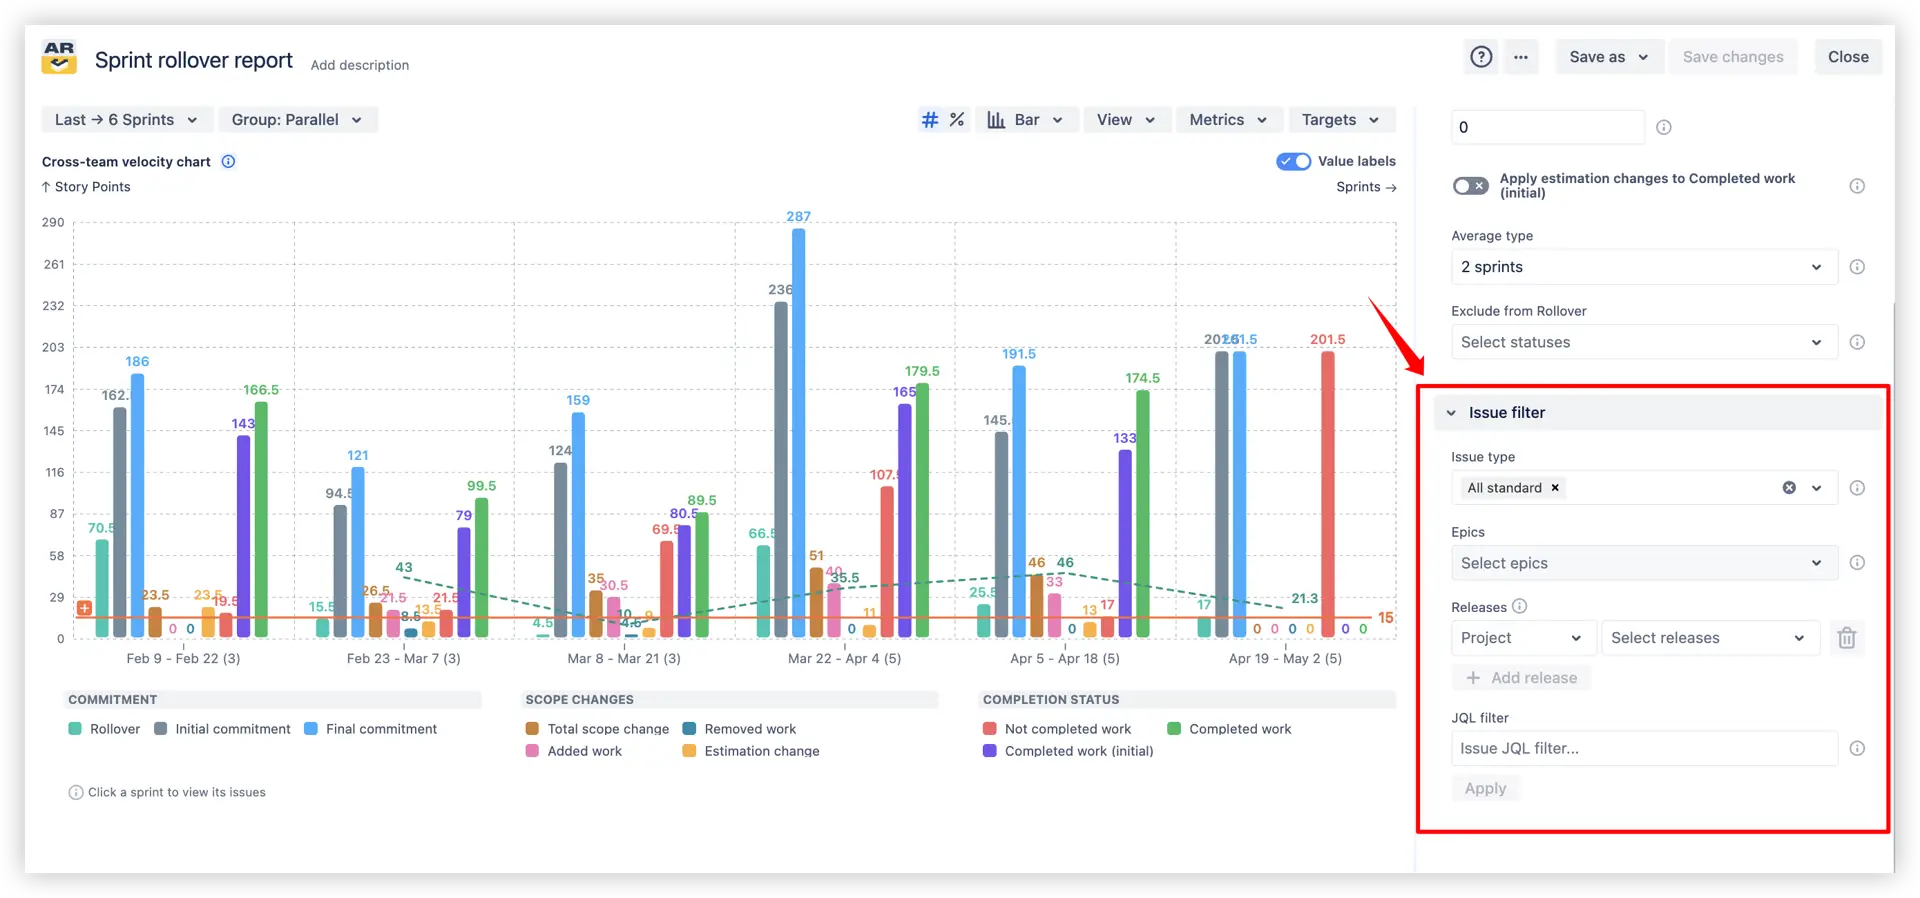
✅ Helps isolate specific work segments and analyze rollover trends with higher precision.
There isn’t a built-in “Sprint rollover” chart or dashboard gadget in native Jira. Jira offers a few adjacent views, but none calculate rollover across sprints or support targets/averages/breakdowns.
Limitations of native Jira reports:
❌ The Sprint Report only shows completed vs. incomplete issues for one sprint - no cumulative rollover view.
❌ The Velocity Chart compares committed vs. completed work, but doesn’t track carried-over issues between sprints.
❌ None of these options provides averages, target lines, or cross-board comparisons.
➡️ That’s why teams use the Sprint rollover report - to analyze rollover ratios, trends, and planning accuracy across multiple sprints in one real-time chart.
Build your own Jira Dashboard use cases with our interactive examples.
Both Jira apps featured here come with a 30-day free trial and are free forever for teams of up to 10 users:
The Agile Reports and Gadgets app includes Sprint rollover report capabilities along with a wide range of advanced Agile charts and reports.
The sprint rollover metric in Scrum refers to the work items that are not completed within previous sprints and are carried over into the next sprint:
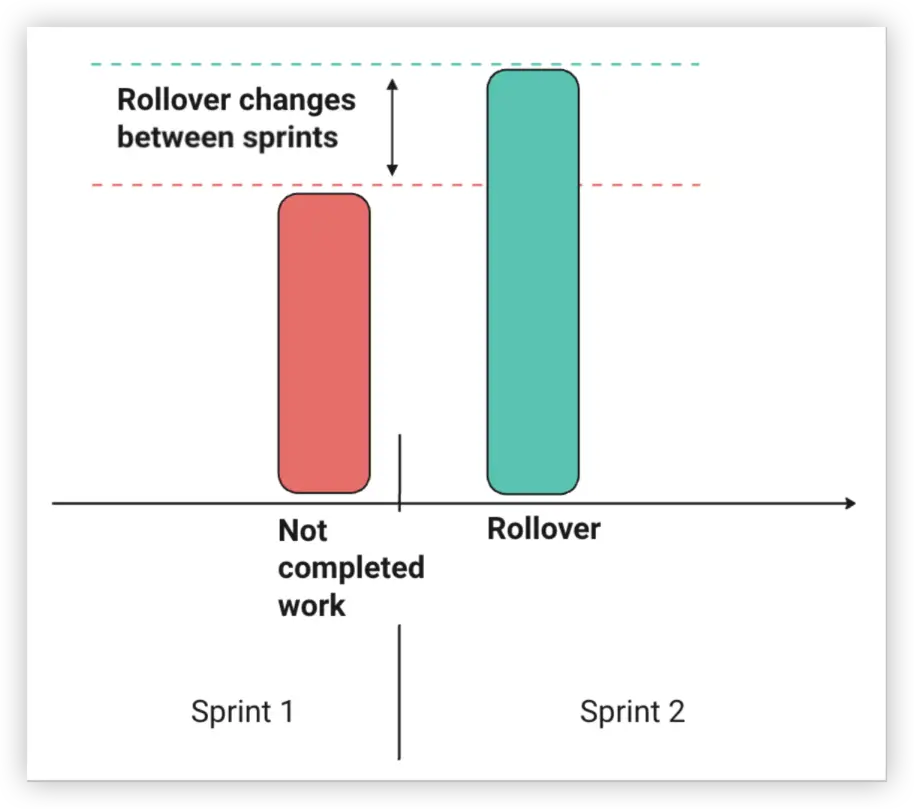
“Sprint rollover” metric is often described using various terms such as "carryover", "spillover", or "leftover", all of which indicate the same concept of unfinished work that needs to be addressed in subsequent sprints.
Sprint rollover metric is such an important indicator of sprint health that, alongside with say-do ratio metric, it is often used as a KPI for Scrum teams.
Here is why it is important to track and analyze sprint leftovers:
Overall, the sprint rollover metric is a valuable tool for Scrum teams to enhance their effectiveness, improve their processes, and ensure better alignment with project goals.
Yes. While teams may use different estimation fields (like Story Points or Issue Count), the relative (percentage) view in the Sprint rollover report converts all data into normalized values, enabling fair cross-team comparison.
You can add the Agile Velocity Chart Gadget to your Jira dashboard, then configure it to display the Sprint rollover report. You can start from the app’s Getting started page using the default setup or a template, or add the gadget directly from the dashboard via the Add gadget button and select Agile Velocity Chart Gadget.


.svg)


.png)
.png)
