The interactive chart is available on larger screens
Please open this page on a desktop to try it out
Key features of Scrum Burndown Chart
A Scrum burndown chart visualizes, tracks, and forecasts the work scope delivered by one or several Scrum teams (defined by one or multiple Scrum Boards).
With our burndown chart for Jira Scrum Boards, you get forecasts built automatically based on the past minimum, average, and maximum velocity:
“Scrum burndown chart” Jira Dashboard gadget used for tracking and forecasting
How different roles use burndown charts in Scrum
✅ Scrum Master: We often look at the amount of remaining work - in this way, we can spot backlog scope creep immediately. This affects our commitments, which can instantly be seen by forecasts moving further and further into the future. All such information is a great starting point for the conversation with our Product Manager.
✅ Product Manager: I have commitments for different stakeholders, be it marketing, sales, or executives. Usually, this comes in the form of “we need this functionality by this date.” With the forecasting of scope completion dates, I can adjust the scope and see how forecasted completion dates automatically move to the safe zone.
✅ Release Train Engineer (Program Manager): I work in a SAFe (Scaled Agile Framework) organisation on one huge software product. I have dozens of Scrum teams united under the umbrella of the Release Train. I need to track and forecast both the delivery of huge products and the delivery of smaller parts of it; therefore, having one Jira Dashboard with a number of charts for different goals is like conducting an orchestra for me.
Start using your SCRUM BURNDOWN CHART to improve sprint focus!
Get forecasts automatically created based on the historical velocity in already completed sprints on the chart:
Minimum velocity - reflects the slowest delivery pace
Average velocity - represents the typical pace of work
Maximum velocity - indicates the fastest achievable speed
⚙️Default settings:
Interval - last 6 sprints
Grouping - do not group
Estimation unit - story points
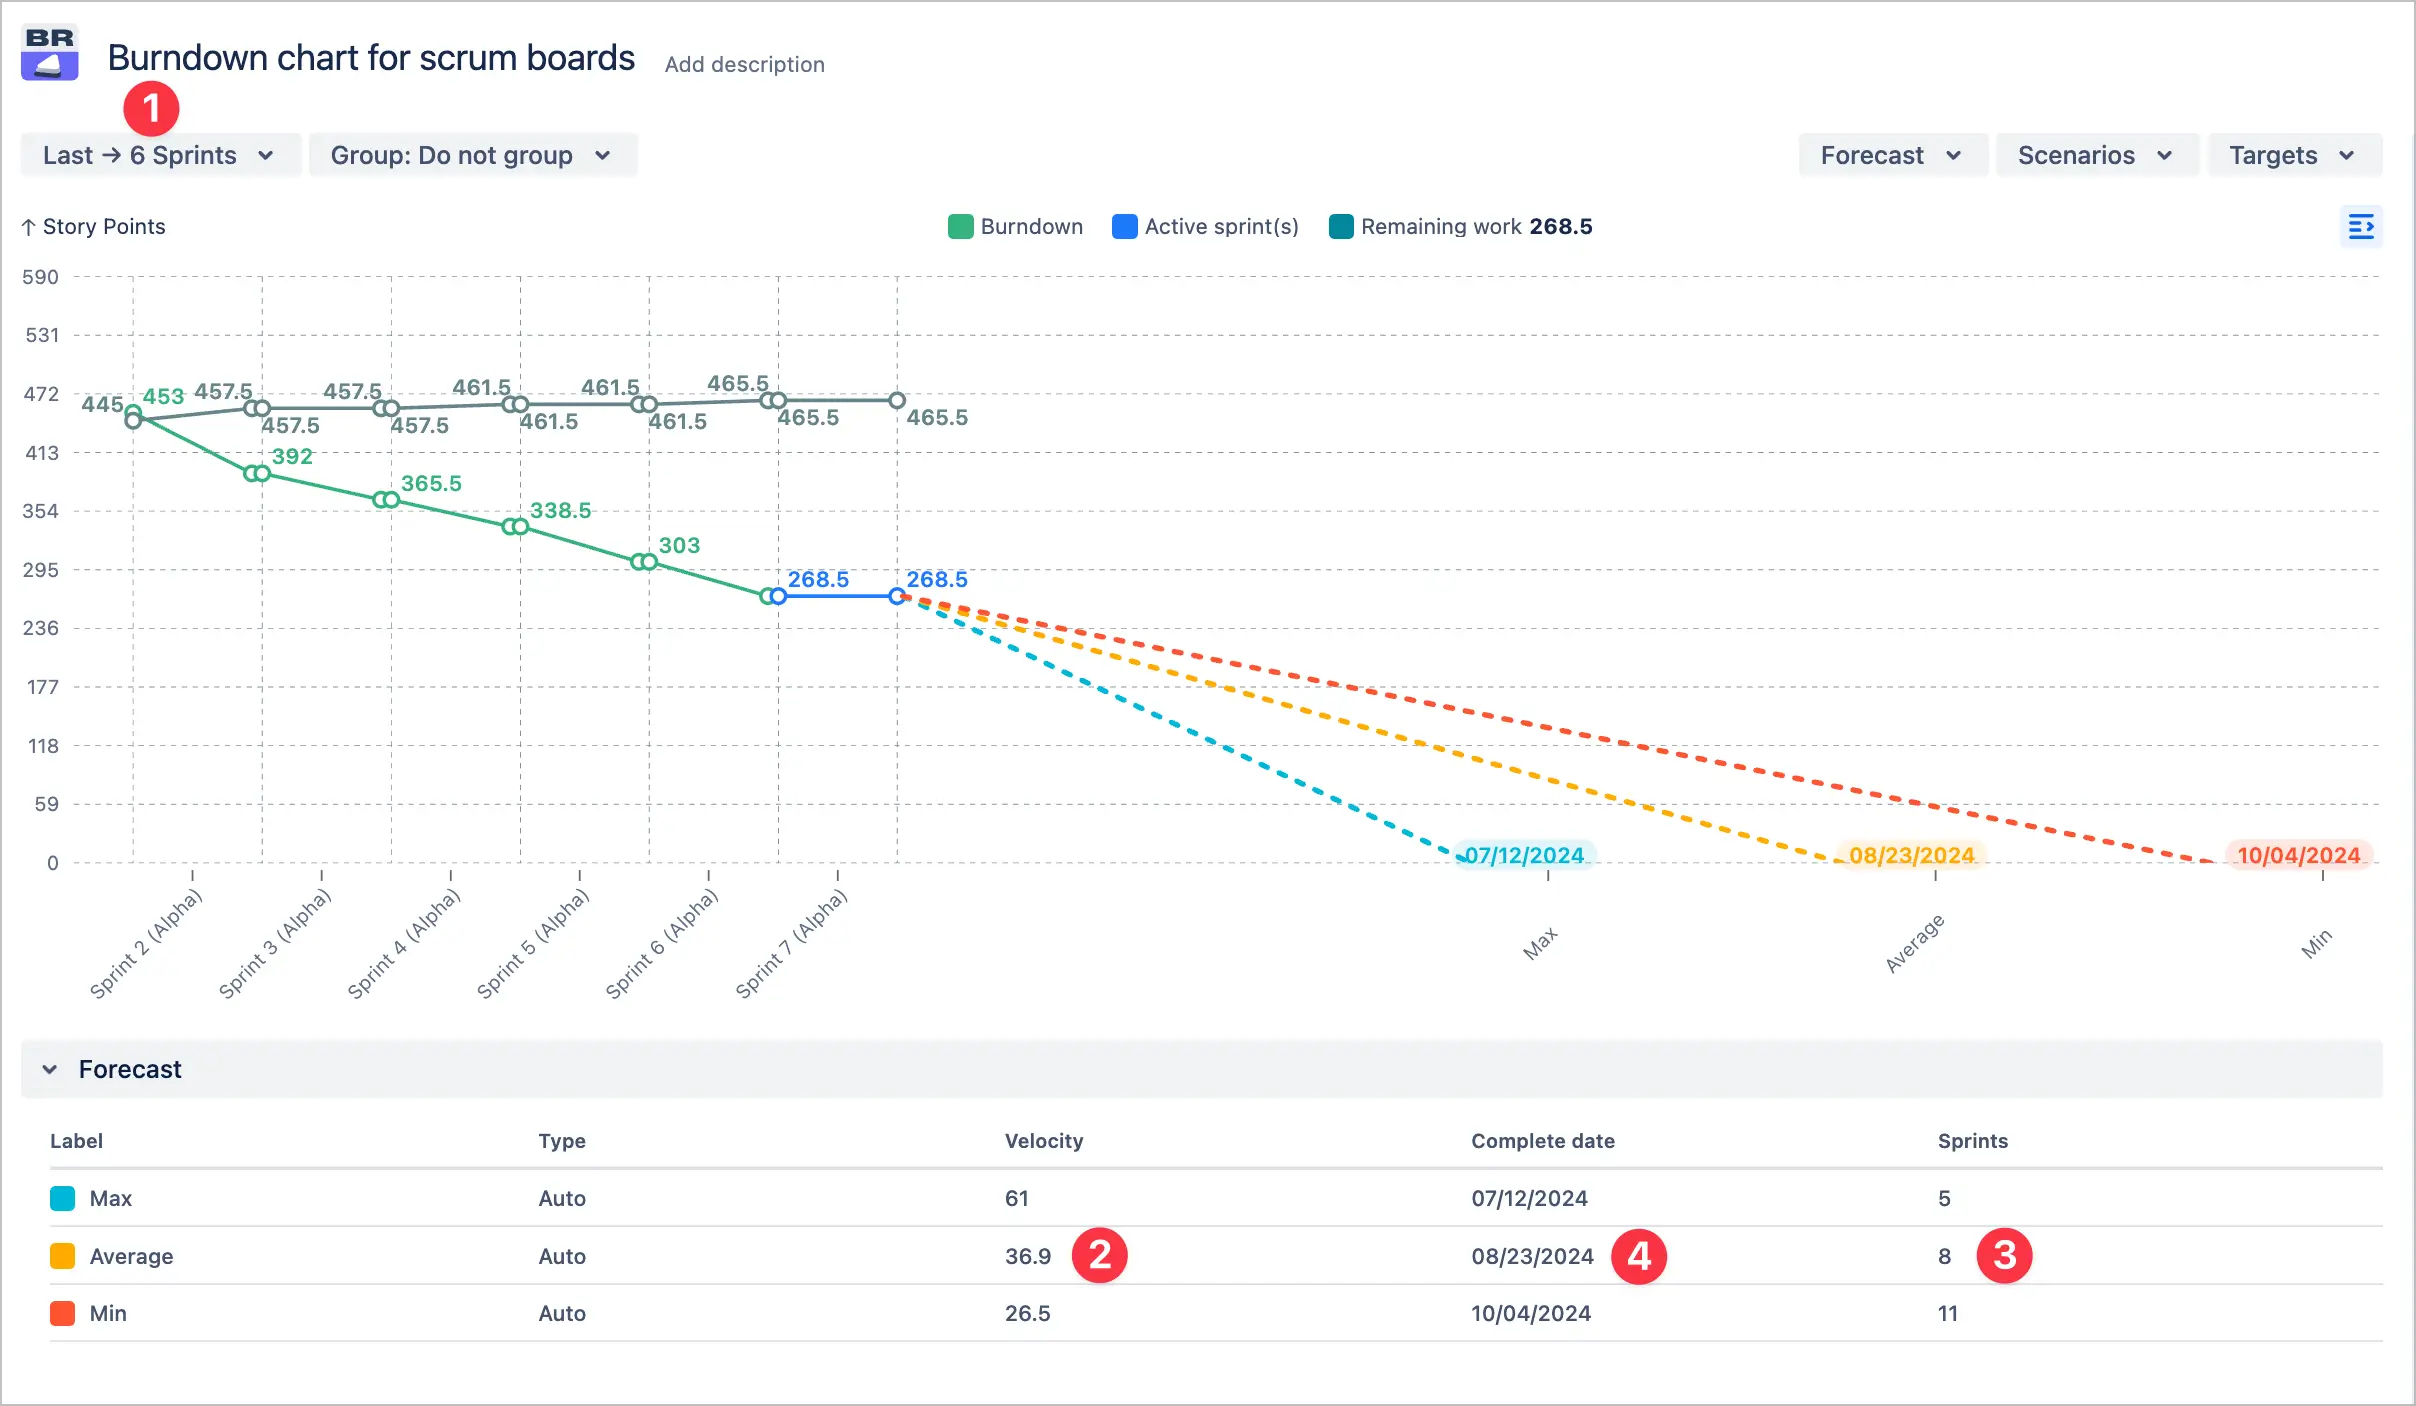
Burndown chart for Scrum Boards with automatic forecasts
📊 How to read the chart:
From the scrum burndown chart example above, we derive that for the last 6 sprints (1️⃣) average velocity was 38.6 story points (2️⃣). For the given average velocity, it will take 7 sprints (3️⃣) to deliver the remaining scope of work. In other words, the team will deliver the scope by 08/09/2024 (4️⃣).
The Automatic Forecast feature is useful for:
Planning delivery dates based on the historical velocity of one or multiple Scrum teams
Communicating pessimistic, realistic, and optimistic scenarios to stakeholders
Identifying delivery risks early
2. Key feature: DIY forecasting scenarios
Create your forecasting scenarios by specifying:
Velocity - answers the question “By what date would a team deliver a scope if the velocity is the following?”
Desired completion date - answers the question “what should be the team’s velocity to deliver by the given date?”
Scrum board burndown chart with custom forecasting scenario defined by a user
The “DIY forecasting scenarios” feature is useful for:
Estimating delivery scope based on current or adjusted velocities
Recalculating achievable targets when priorities or team capacity shift
Simulating best-case and worst-case delivery timelines across future sprints
3. Key feature: Remaining work growth modelling
Work backlog is not static, it’s growing all the time.
Use the Scrum burndown chart on your Jira dashboard to model sprint completion and analyze scope changes using two flexible configuration options:
remaining work growth modelling chart example shows the scenario of the scope growth by X story points for each future sprint:
Remaining work growth modelling
remaining work - another option is to specify a custom backlog size and see how forecasts change:
Example of forecast adjustment based on remaining work estimate
The “Remaining work growth modelling” feature is useful for:
Modeling backlog scope creep
Forecasting completion dates under different scope growth scenarios
Spotting delivery risks early, as the scope expands during development
4. Key feature: Delivery planning with deadlines in mind
If there is a deadline, then it’s good to have it visualized on the chart:
Example of the chart with target-based delivery planning
The “Deadlines” feature in the Scrum burndown chart is useful for:
Showing planned deadlines directly on the chart in your Jira dashboard
Aligning team efforts with goals or delivery milestones
Tracking if the team is on pace to hit targets - spotting delays or risks early
Reducing uncertainty by anchoring progress to specific end dates
Additional features: Breakdowns and issues filtering
Need to get more information about different types of work? That’s where our 2-dimensional breakdown feature comes into play. Just a few examples of what can be used in breakdowns:
Issue types
Jira projects
Teams
Assignees
Releases
See work breakdowns by any Jira field and entity
Want to see Jira issues that contribute to the Agile Scrum Burndown Chart? Just click on any section of the chart, and you’ll see the list of contributing Jira issues:
Jira issue list for the work scope chosen on the chart
These features help Scrum teams improve delivery predictability and stay aligned on goals by turning raw data into clear, actionable insights.
What about native Scrum burndown chart in Jira
There is no built-in functionality in Jira to create a burndown chart for any work scope (you can build only a burnup and a burndown chart for a sprint).
With the Scrum Burndown Chart gadget from this interactive example, you can:
Build the burndown chart for any work scope from the Scrum Boards
See the chart as a gadget on your Jira Dashboard
Advantages of using Scrum burndown graph for Jira Dashboard
Multitude of forecasting scenarios
Ability to build an aggregated Scrum burndown chart for multiple Scrum teams
Ability to create multiple side-by-side charts on Jira Dashboard
Rich work scope filtering options: by epics, initiatives, issue types, or custom JQL
Work breakdowns to analyze the history of future work scopes
Agile Reports and Gadgets app includes “Burnup Burndown Charts” app functionality and a multitude of other reports/charts.
Adding the “Agile Burnup Burndown Charts” Gadget to your Jira Dashboard
To get started, make sure the app is installed. Then, navigate to your Jira Dashboard and use the gadget search to find “Agile Burnup Burndown Charts”. Once located, simply add it to your dashboard to begin visualizing progress metrics:
How to add burndown chart as Jira Dashboard gadget
Frequently Asked Questions
1. What is burndown chart in Scrum?
In Scrum, a burndown chart is a graphical tool used to monitor how much work has been completed throughout the sprint. It shows the remaining workload compared to the time left, usually displayed with time on the horizontal axis and effort remaining on the vertical axis.
In Scrum, a burndown chart is commonly categorized into two types:
Sprint burndown graph - the report used in Scrum to track the team’s progress in a sprint.
Scrum burndown chart - the report used to track and forecast a team's progress towards completion of the work scope, bigger than a sprint scope.
2. Can I use estimation units other than story points?
Yes, the app supports any numeric Jira field. Here are a few examples of estimation units that you can use:
Issue count
Story points
Epic points
Time estimates
3. For which purpose may burn-down charts be used for in Scrum?
The Scrum burndown chart is a visual tool that helps teams monitor how much work has been completed during a sprint. It provides clarity on progress, fosters accountability, and keeps the team aligned with sprint goals and timelines. By making the pace of delivery visible, it supports better planning and team motivation.
4. How does the Scrum burndown chart work?
The chart plots remaining work (e.g., story points) against time. As tasks are completed, the line “burns down” toward zero by the end of the sprint.
5. Who uses the Burndown chart in Scrum?
Scrum teams, especially Scrum Masters and Product Owners, use it to monitor progress, spot blockers early, and stay on track with sprint commitments.
6. Can you forecast delivery with a Scrum burndown chart?
Yes. With Agile Burnup Burndown Charts by Broken Build, you can simulate delivery scenarios and forecast completion dates based on real or custom velocity.


.webp)


.svg)


.png)
