The interactive chart is available on larger screens
Please open this page on a desktop to try it out
Key features of the Kanban WIP Aging chart
The Kanban WIP Aging chart helps teams see, in real time, how long work items remain in each workflow stage and where the flow is slowing down. It makes bottlenecks and hidden queues visible by highlighting aging and stalled items before they impact delivery. Kanban teams can use percentile-based benchmarks to quickly identify work that deviates from normal flow patterns. The report supports analysis across multiple boards and stages, helping uncover delays and optimize workflow performance.
Overall, Agile WIP Charts improve prioritization, flow predictability, and the efficiency of continuous delivery in Kanban systems.
How different roles use the Jira WIP aging graph for Kanban
✅ Product Owner: I use the Jira WIP aging graph for Kanban to see how work is progressing across workflow stages in real time. It helps me spot items that are aging beyond the typical range (85th percentile) and prioritize those that may impact delivery commitments.
✅ Scrum Master / Flow Manager: I use the Agile Kanban WIP Aging chart during stand-ups to highlight aging and stalled items. The visual distribution and stalled-issue indicators help the team focus on removing blockers and improving flow rather than starting new work.
✅ Tech Lead / Engineering Manager: I use the chart to identify where work slows down in specific stages, especially in review or testing. Stage hotspot analysis helps me detect bottlenecks (e.g., Code Review queues) and rebalance capacity or adjust workflows.
✅ QA Lead / Reviewer: I use the ability to filter specific WIP statuses (like Testing or Review) to understand how long items wait for validation. It helps me see growing queues early and ensure timely feedback cycles.
✅ Release Train Engineer (RTE): I use the WIP aging report for multiple Kanban teams in Jira to identify systemic bottlenecks and compare flow health across teams. Aging patterns and stalled work indicators highlight risks that could impact overall program delivery.
✅ C-level Executive / Delivery Manager: I use aggregated WIP aging insights to understand where work consistently slows down across the organization. Trends in aging, hotspots, and stalled work signal systemic inefficiencies that affect predictability and time-to-market.
See aging work before it causes delays with the Kanban WIP Aging chart
Key feature 1: Kanban WIP (Work in Progress) aging chart by workflow stage
This feature allows you to add one or multiple Kanban teams and analyze how long work items have been aging within each workflow stage. Unlike lead time reports focused on completed work, this view is real-time and proactive, showing how long items are currently sitting in each stage of the workflow.
Kanban WIP Aging chart with Health Metrics in Jira
📊 How to read the chart
Each column corresponds to a stage in the workflow (1️⃣) and includes a WIP indicator showing how many items are currently in that stage (2️⃣). Each dot represents a single work item, placed based on how long it has been in that stage. The higher a dot appears, the longer the item has been there–potentially signaling a need for attention.
Above the chart, the following metrics are shown to support deeper analysis:
Historical WIP age (85%) (3️⃣) – shows how long historical tickets have spent across all selected In Progress statuses, based on a selected statistical measure. It represents the typical WIP age in your workflow and serves as a baseline for comparison.
>85% zone breaching issues (4️⃣) – indicates the number of work items that have stayed in a status longer than the 85th percentile of historical tickets. These items are considered to be aging beyond the normal completion range defined by past workflow performance.
Stalled issues (5️⃣) – shows the number of work items that have remained in a WIP status longer than the configured aging threshold. These items may indicate blocked work, workflow bottlenecks, or tasks requiring attention.
✅ This feature is helpful because it
Helps prevent bottlenecks before they become delays
Makes hidden queue problems visible (e.g., Review, QA, Testing)
Aligns team expectations with real historical performance
Supports continuous flow optimization in Kanban systems
In many Kanban workflows, delays don’t happen evenly across all In Progress stages. Instead, work tends to accumulate at specific handoff points, especially in stages such as Code Review, Design Review, or Testing.
These review-related stages often become invisible bottlenecks:
Items appear “in progress” but are actually waiting
Review queues grow silently over time
Teams only notice the issue when delivery is already delayed
Customizable statuses display allows for focus specifically on review-type stages (e.g., Design review, Code Review, Testing).
This allows teams to quickly identify where work is waiting for action rather than actively progressing.
Selecting WIP statuses in the Kanban Aging chart for Jira
✅ This feature is helpful for
Filter for review and verification stages only
Make delayed handoffs immediately visible
Key feature 3: Kanban WIP (Work in Progress) aging chart: blocked and stale work spotlight
Stale issues are work items that remain in one WIP status beyond the defined aging threshold, often indicating blocked work, bottlenecks, or items needing attention.
This feature highlights stalled work on the Kanban WIP (Work in Progress) Aging graph in the Jira dashboard and in health metrics, helping you track both individual items and overall flow health.
Kanban WIP Aging chart with stalled issues
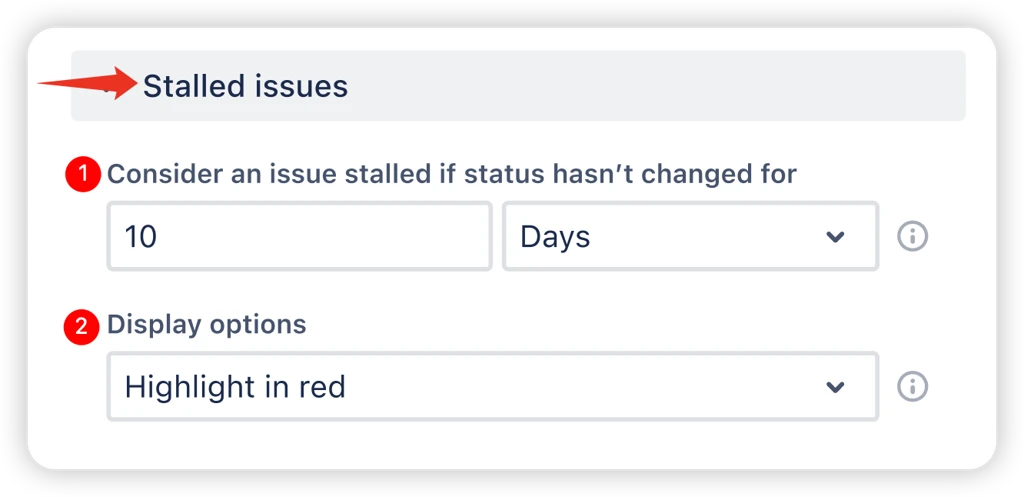
Configuring stalled issues settings
You can set a time limit (e.g., 10 days) (1️⃣) after which an item is automatically marked as stalled if it hasn’t changed status. Also, you can choose how stalled issues are shown (2️⃣):
Show only stalled issues – displays only stalled items
Highlight in red – shows all items, highlights stalled ones
No visual highlight – keeps all items the same, stalled logic used only in metrics
✅ This feature is helpful for
Kanban teams that need fast visibility into blocked or aging work
Detecting hidden flow interruptions before they escalate
Monitoring WIP health in real time, not after delivery delays
Quickly identifying where work is stuck vs actively progressing
What about the native Jira WIP Aging chart for Kanban teams
Jira does provide an Average Age Report, but it falls short of what Kanban teams usually need for effective flow analysis:
❌ It shows only a single aggregated value (average age), without visibility into distribution, outliers, or individual items.
❌ It doesn’t identify which specific items are aging or stalled
❌ There’s no flexibility in defining WIP – the report includes all unresolved issues by default.
❌ It doesn’t break data down by workflow stages, so it’s unclear where work is getting stuck.
❌ It lacks percentile-based insights, making it difficult to distinguish typical aging from outliers.
❌ There are no visual thresholds or highlights to flag at-risk or stalled work items.
❌ It doesn’t support data segmentation through breakdowns (e.g., by Kanban board or by Severity).
❌ It doesn’t support work schedules (e.g., defining working hours, days, or holidays).
Advantages of using Kanban WIP (Work in Progress) aging report
The Kanban work item aging chart helps you manage flow with real-time, actionable insights:
Monitor how long work sits in each Kanban stage in real time
Detect hidden review-stage bottlenecks
Identify aging work before it turns into delivery delays
Highlight stalled items automatically
Break down the flow by stage instead of relying only on overall metrics
Analyze flow across one or multiple Kanban boards
Prioritize at-risk or stalled work items faster and more effectively
Improve flow predictability and overall delivery efficiency
The Agile Reports and Gadgets app includes Kanban WIP Aging chart functionality and a multitude of other reports/charts.
Frequently Asked Questions
1. How often should I check WIP aging data?
WIP aging is most effective when reviewed regularly rather than occasionally. Many teams check it daily during stand-ups or flow reviews to catch aging items early. Continuous monitoring helps prevent bottlenecks from building up unnoticed and keeps Kanban flow stable.
With Agile WIP Charts by Broken Build, teams can monitor aging work in real time without manual tracking, making it easier to spot issues early and take immediate action during daily flow reviews.
2. What causes items to start aging in Kanban?
Items typically start aging when they wait for input, approval, or resources in a specific stage. Common causes include review queues, dependency delays, overloaded team members, or unclear prioritization. WIP aging makes these delays visible before they become delivery risks.
3. Can WIP aging help improve team forecasting?
Yes. By analyzing historical aging patterns and percentile thresholds, teams can better understand how long work usually stays in each stage. This improves forecasting accuracy by basing expectations on real workflow behavior rather than assumptions.
With Agile WIP Charts by Broken Build, teams can analyze aging trends across stages and boards, enabling more reliable forecasts and better planning based on real delivery data.
4. How does WIP aging support continuous improvement?
WIP aging highlights slowdowns and bottlenecks in the workflow. Teams can use this data to adjust processes, rebalance workloads, or improve handoffs. Over time, this leads to smoother flow and more predictable delivery cycles.
Using Agile WIP Charts by Broken Build, teams can go beyond basic aging insights – monitor work in real time, detect hidden bottlenecks, and identify stalled items automatically. With detailed stage-level analysis and support for multiple boards, teams can continuously refine their flow and improve delivery predictability and efficiency.
5. What’s the difference between aging and stalled work?
Aging refers to any work item that remains in a workflow stage for a period of time. Stalled work is a subset of aging items that exceed a defined threshold per stage and are likely blocked or forgotten. Stalled items require immediate attention, while aging items may still be progressing normally.
6. Is WIP aging useful for small teams as well as large organizations?
Absolutely. Small teams use it to improve day-to-day flow and quickly spot blockers, while larger organizations use it to identify systemic bottlenecks across teams, projects, initiatives, or departments. The value scales with workflow complexity.
7. Can WIP aging reveal hidden dependency issues?
Yes. When items consistently age in certain stages, it often signals upstream or downstream dependencies. For example, work waiting in Review or Testing may indicate dependency on specific roles or external inputs that slow down delivery.


.svg)

.png)
