The interactive chart is available on larger screens
Please open this page on a desktop to try it out
Key features of the Lead time chart
The Lead time chart helps Agile teams measure the total time it takes for work items to move through the entire delivery process, from issue creation to completion.
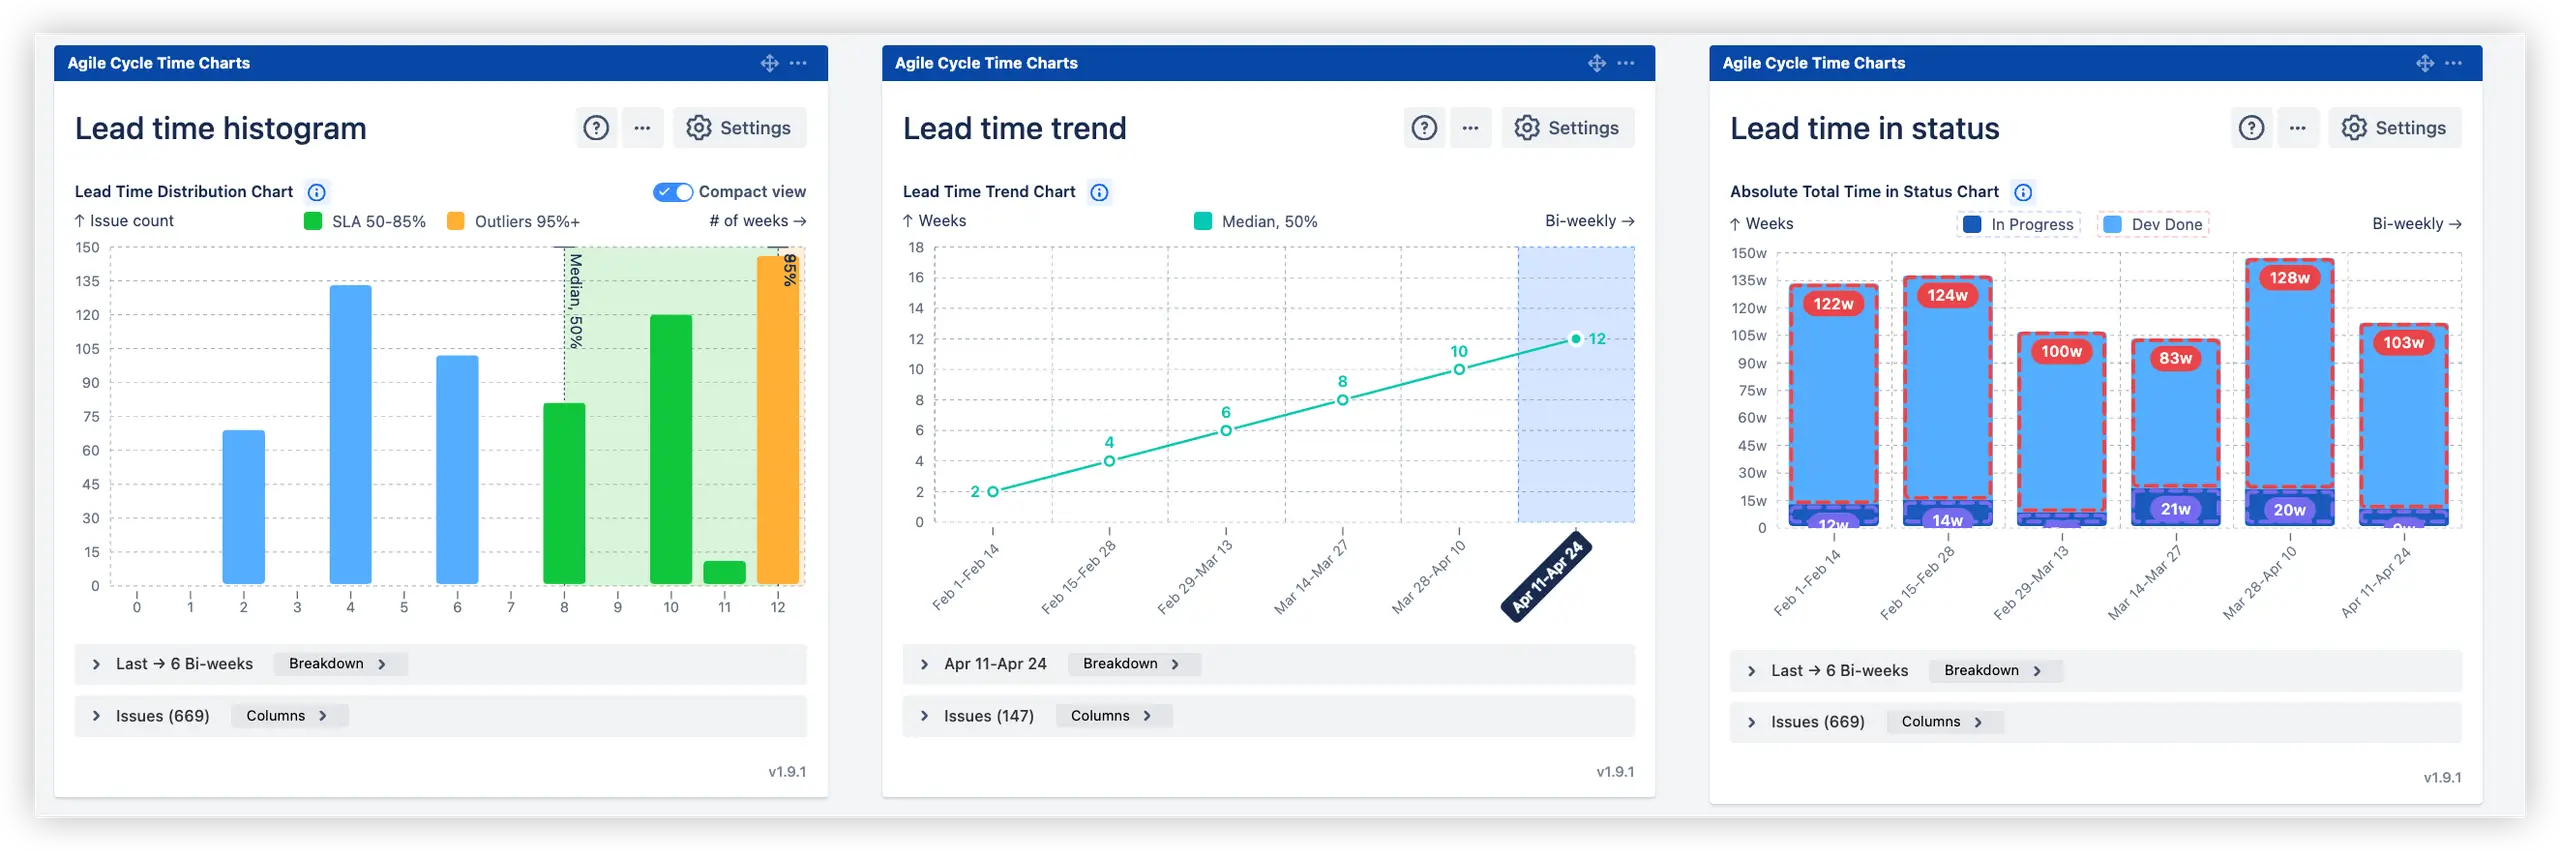
Lead time histogram, Lead time trend, and Time in Status work together to give you a complete view of delivery performance, helping you spot patterns and delays, track changes in value delivery over time, and uncover where work gets stuck across workflow stages. All three are part of the Agile Cycle Time Chart app, built to turn raw Jira data into clear, actionable request-to-delivery timeline insights.
Lead time charts on the Jira Dashboard
Lead Time Chart for Jira helps to:
Track how long it takes to deliver work from the moment it’s created
Detect outliers, bottlenecks, and long-tail issues across delivery timelines
Monitor trends in value delivery pace over time to evaluate process changes
Analyze stage-level breakdowns to uncover workflow inefficiencies
Define and refine SLA targets and team-level lead time KPIs based on real delivery data
The Lead time chart on your Jira dashboard provides real-time visibility into your workflow using existing Jira data, with customizable settings and breakdowns by priority, epic, release, and more.
How do different roles use the Lead time report
✅ Scrum Master: As a Scrum Master, I use the Lead time histogram to identify delivery inconsistencies from the moment an issue is created. It helps surface delays across the entire workflow - from backlog to done - enabling better retrospectives and process tuning.
✅ Product Manager: As a Product Manager, I rely on the Lead time trend chart to monitor how delivery time changes over time, from initial request to completion. It helps me evaluate the impact of scope, team load, or process changes and keep stakeholders aligned.
✅ Release Train Engineer (SAFe): As a Release Train Engineer, I use the Time in status chart to detect where work stalls within the process. I pay close attention to waiting statuses like "Dev Done" or "Waiting for Stakeholder" - so I can remove blockers and accelerate flow across teams.
✅ Support Lead: As a Support Lead, I use both the Lead time Histogram and Trend chart to monitor how fast we resolve issues, from the moment a bug or support ticket is created. This is essential when working under SLAs or prioritizing bugs based on urgency and customer impact.
From Jira ticket creation to resolution - stay in control with LEAD TIME CHART
1. Key feature: Agile lead time analysis across multiple teams
When managing several teams - whether in a single project or across an Agile Release Train - it's useful to add multiple lead time charts to the same Jira Dashboard. This gives you a clear view of how delivery timelines vary between teams, while still allowing for deep dives into team-specific performance.
Lead time chart gadgets on the Jira Dashboard for multiple teams
The Lead time chart example shown above displays data split by 1️⃣ Jira board (used to represent teams) and 2️⃣ types of work items. You can apply two-level breakdowns using any Jira field, such as priority, epic, release, and more, to tailor the charts to your reporting needs.
2. Key feature: Lead time distribution
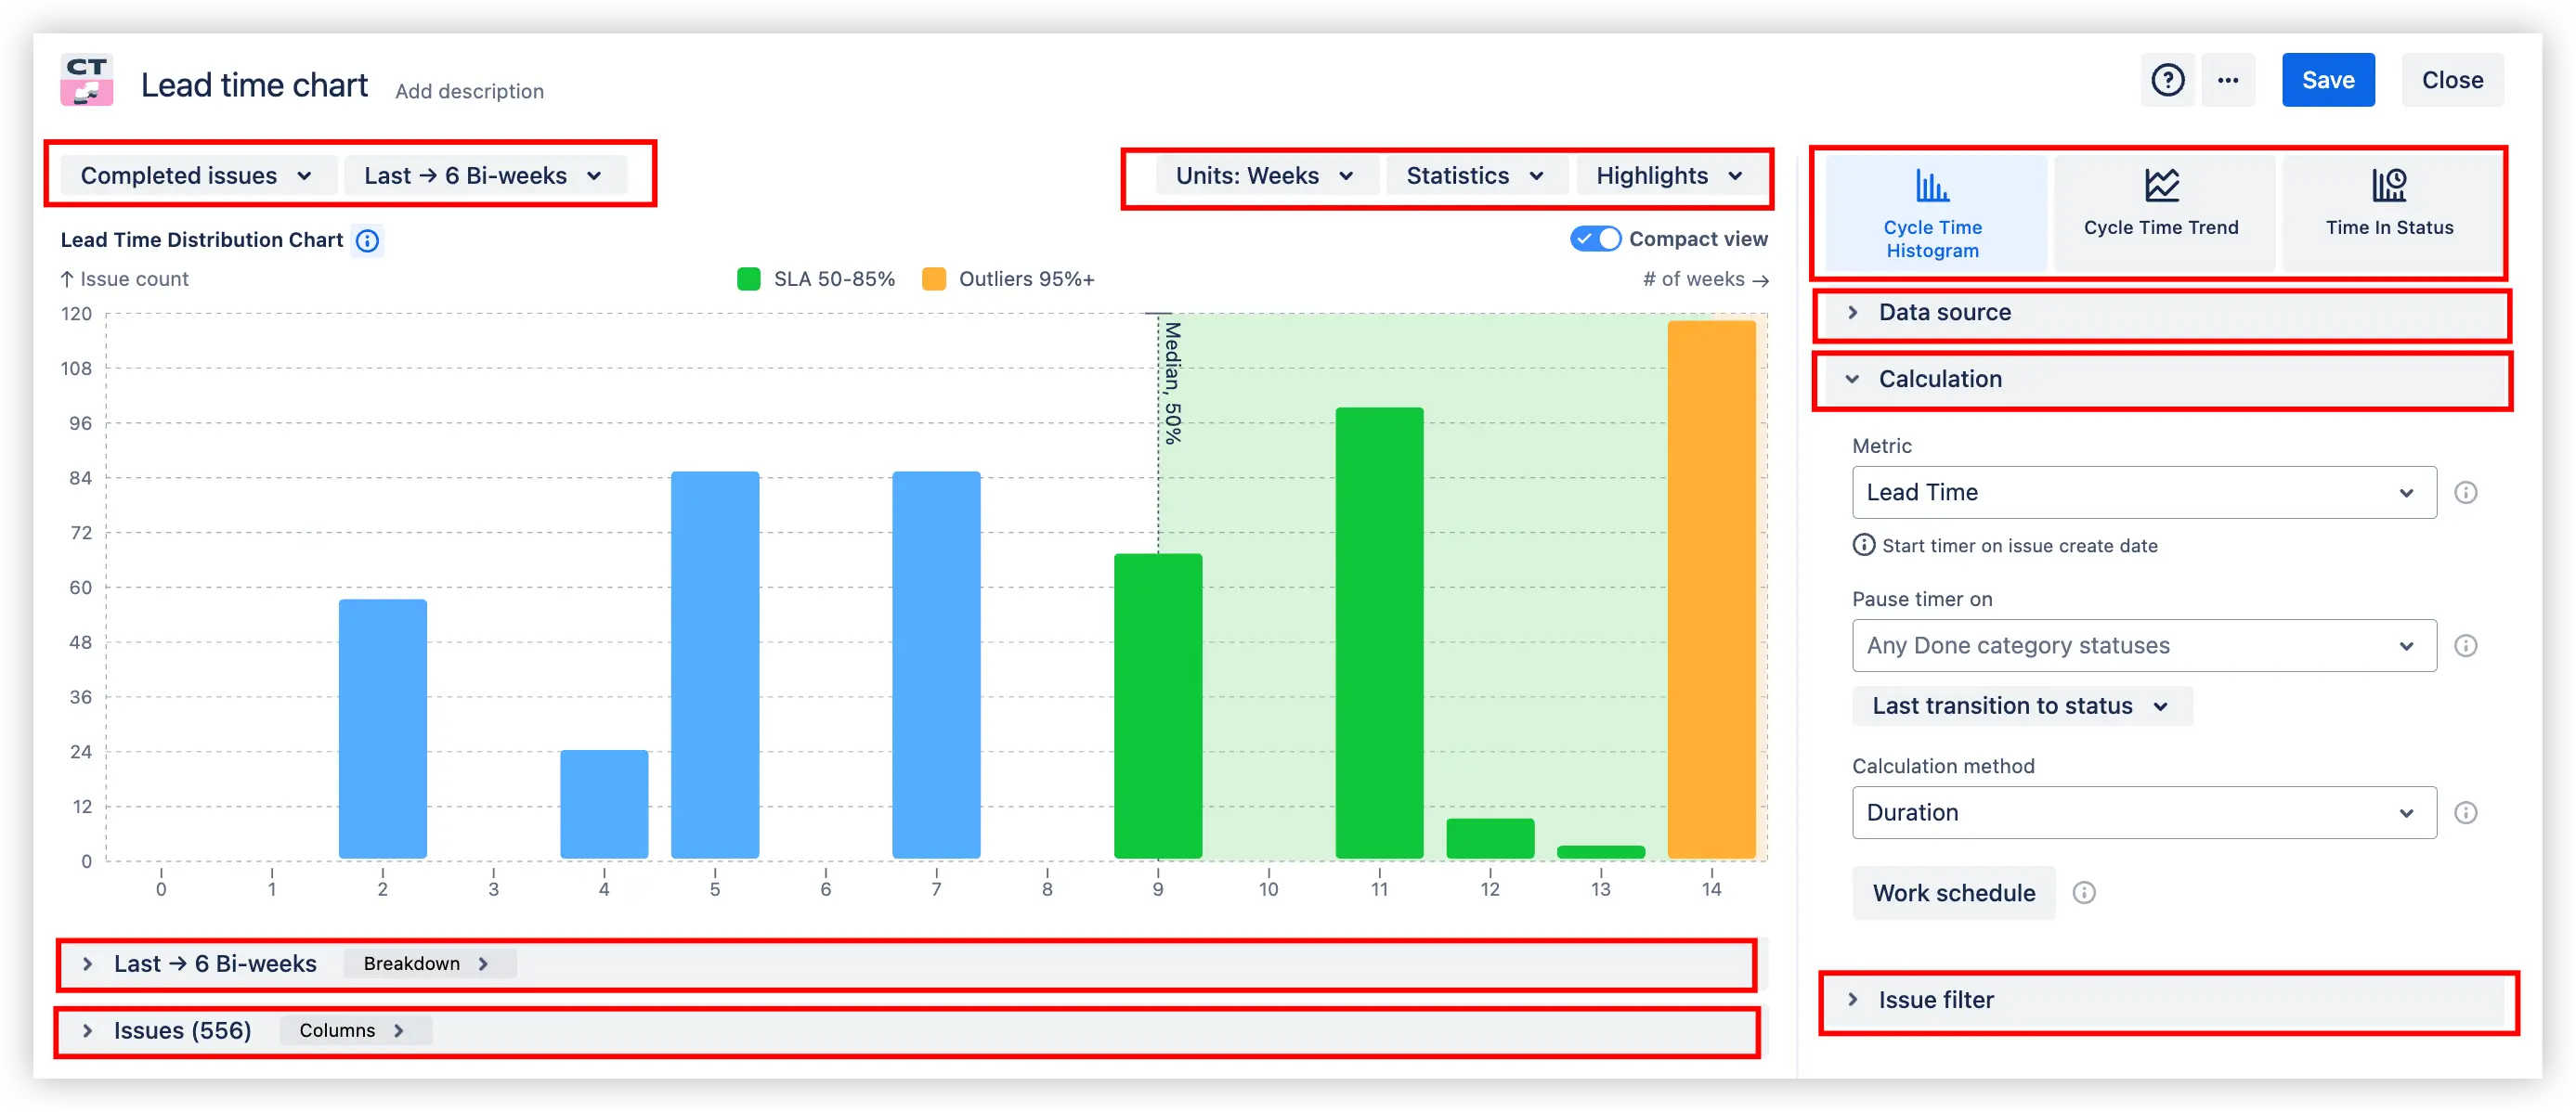
Not all delays happen during development - some happen before work even starts. The Lead time histogram reveals the distribution of completed work items, starting from issue creation to completion. The chart highlights not just execution speed but also process friction in planning, prioritization, and handoffs.
It groups issues into time-based bins (e.g. days, weeks, bi-weeks), providing a clear view of how long work items typically take to flow through your entire delivery system.
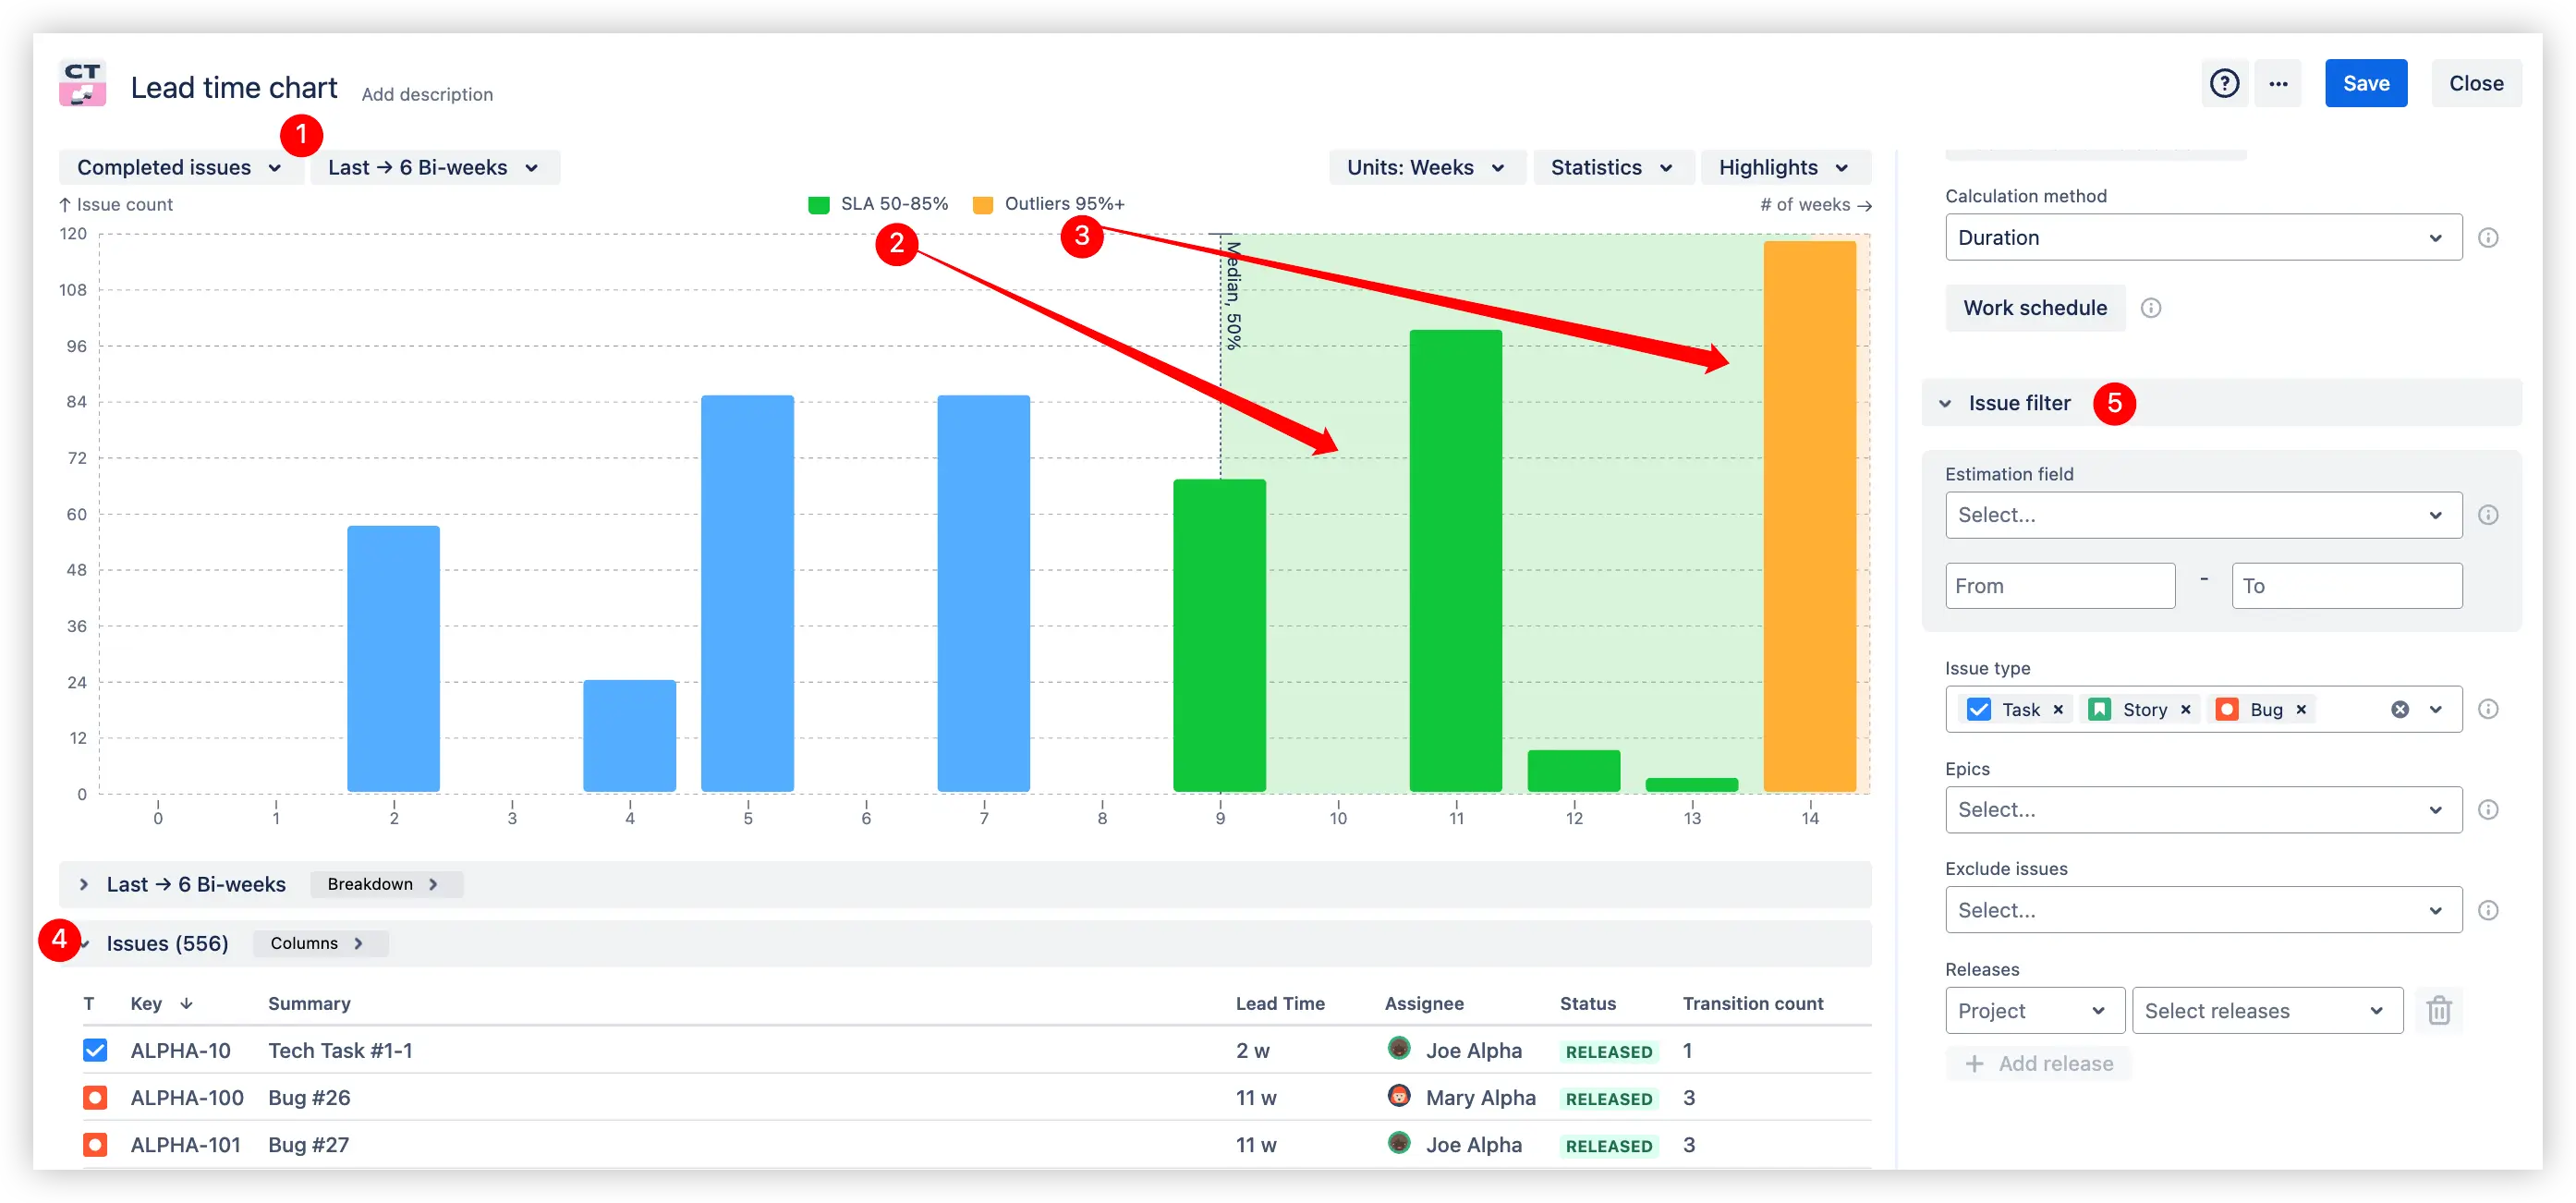
Lead time histogram chart features explained
📊 How to read the chart:
The issue filter "Completed issues in the last 6 bi-weeks" (1️⃣) ensures the chart only includes issues that reached a completed status during that time frame. The green-highlighted bars (2️⃣) represent issues that fall within the 50–85% percentile range of lead times, considered within the expected delivery SLA, while the orange bar (3️⃣) indicates outliers 95%+. The issue list below (4️⃣) provides a detailed breakdown of individual issues contributing to the histogram, including their lead time, story points, assignees, and number of status transitions. The chart setting also lets you apply an issue filter (5️⃣) by estimation field, issue type, epic, or JQL.
✅ Lead time distribution chart helps to:
Understand value delivery consistency by visualizing the distribution of lead times - spot how predictable your process really is.
Detect delays and outliers by drilling down into individual work items - identify blockers, bottlenecks, or one-off anomalies.
Compare teams or work types using breakdowns by Jira fields like board, issue type, or custom fields - highlight process gaps across segments.
Track request-to-delivery timelines by visualizing key percentiles (median, 85th, or custom) - monitor SLAs and manage stakeholder and customer expectations.
Focus analysis on relevant data with flexible filtering by work type, release, epic, estimation field, or custom JQL - zoom in to what matters.
Identify systematic inefficiencies by spotting long tails in your lead time distribution - address root causes, not just symptoms.
Explore the interactive Lead time histogram
Dive into a live, clickable example of the Lead Time Histogram chart. Open settings to adjust filters, test different configurations, and see how your cycle time data transforms in real time. Alongside the chart, you’ll find a detailed overview of all its features.
Try it now and uncover delivery insights your team can act on.
3. Key feature: Lead time trend line
The Lead time trend chart helps Agile teams monitor how long it takes to deliver value, from issue creation to resolution, and how that delivery time changes over time. The trendline based on the median (50th percentile) reflects the median lead time to turn a user-reported bug, priority issue, or internal requirement into a delivered solution.
It’s especially useful in development workflows where issues come with SLA commitments or business-critical expectations. By tracking the trend, you can monitor how consistently your team delivers fixes or features over time and spot when delivery times begin to slip.
By grouping completed issues into time intervals (e.g., bi-weekly), the chart visualizes whether your team is speeding up, slowing down, or staying consistent. This makes it easy to:
Track delivery performance trends to evaluate if your team is improving
Measure the impact of process changes, staffing shifts, or external events
Compare actual lead times to your SLA or performance targets
Share value delivery trends with stakeholders in a clear, visual format
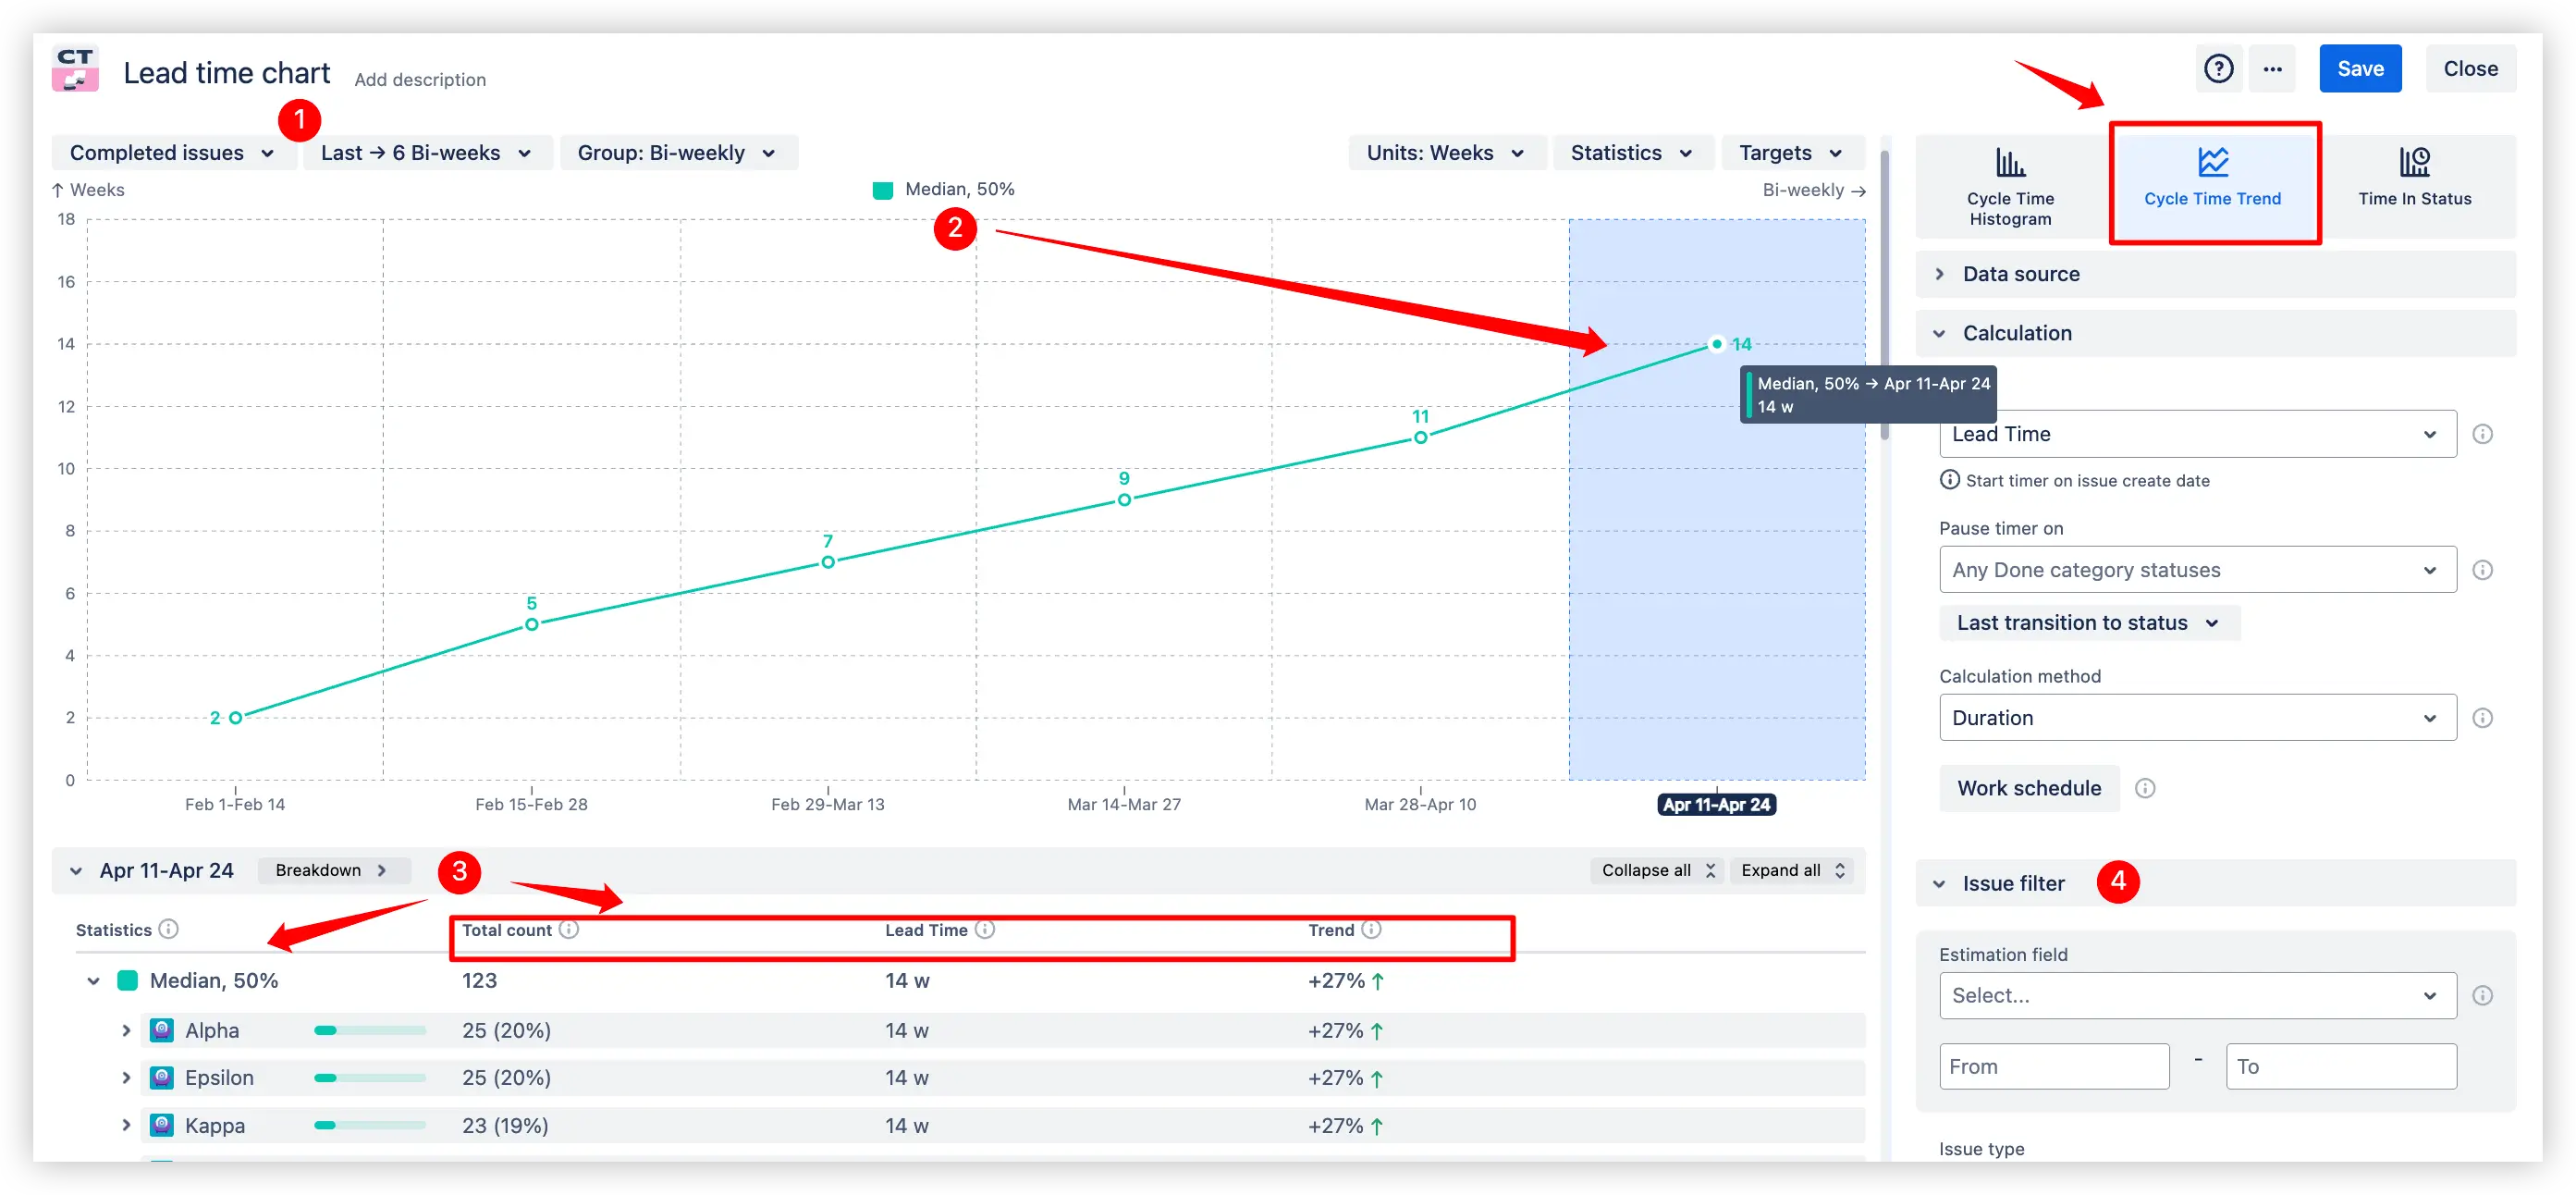
Lead time trend line chart on Jira dashboard
📊 How to read the chart:
The issue filter "Completed issues in the last 6 bi-weeks" (1️⃣) ensures the chart includes only issues that reached a done status within that timeframe. The trend line (2️⃣) displays the median lead time for each period to complete 50% of the teams' backlog. The breakdown (3️⃣) shows that the ALPHA team’s median lead time is 14 weeks for the current period, a +27% trend improvement over the previous one. The issue filter panel (4️⃣) lets you fine-tune the dataset using fields like estimation, issue type, epic, or JQL - helping you focus on what really matters to your teams.
Whether you're trying to reduce delays, validate recent improvements, or anticipate delivery risks, Lead time trend turns raw Jira data into an actionable timeline view, all calculated from the moment each issue is created.
4. Lead time chart additional features
Waiting time across workflow stages analysis
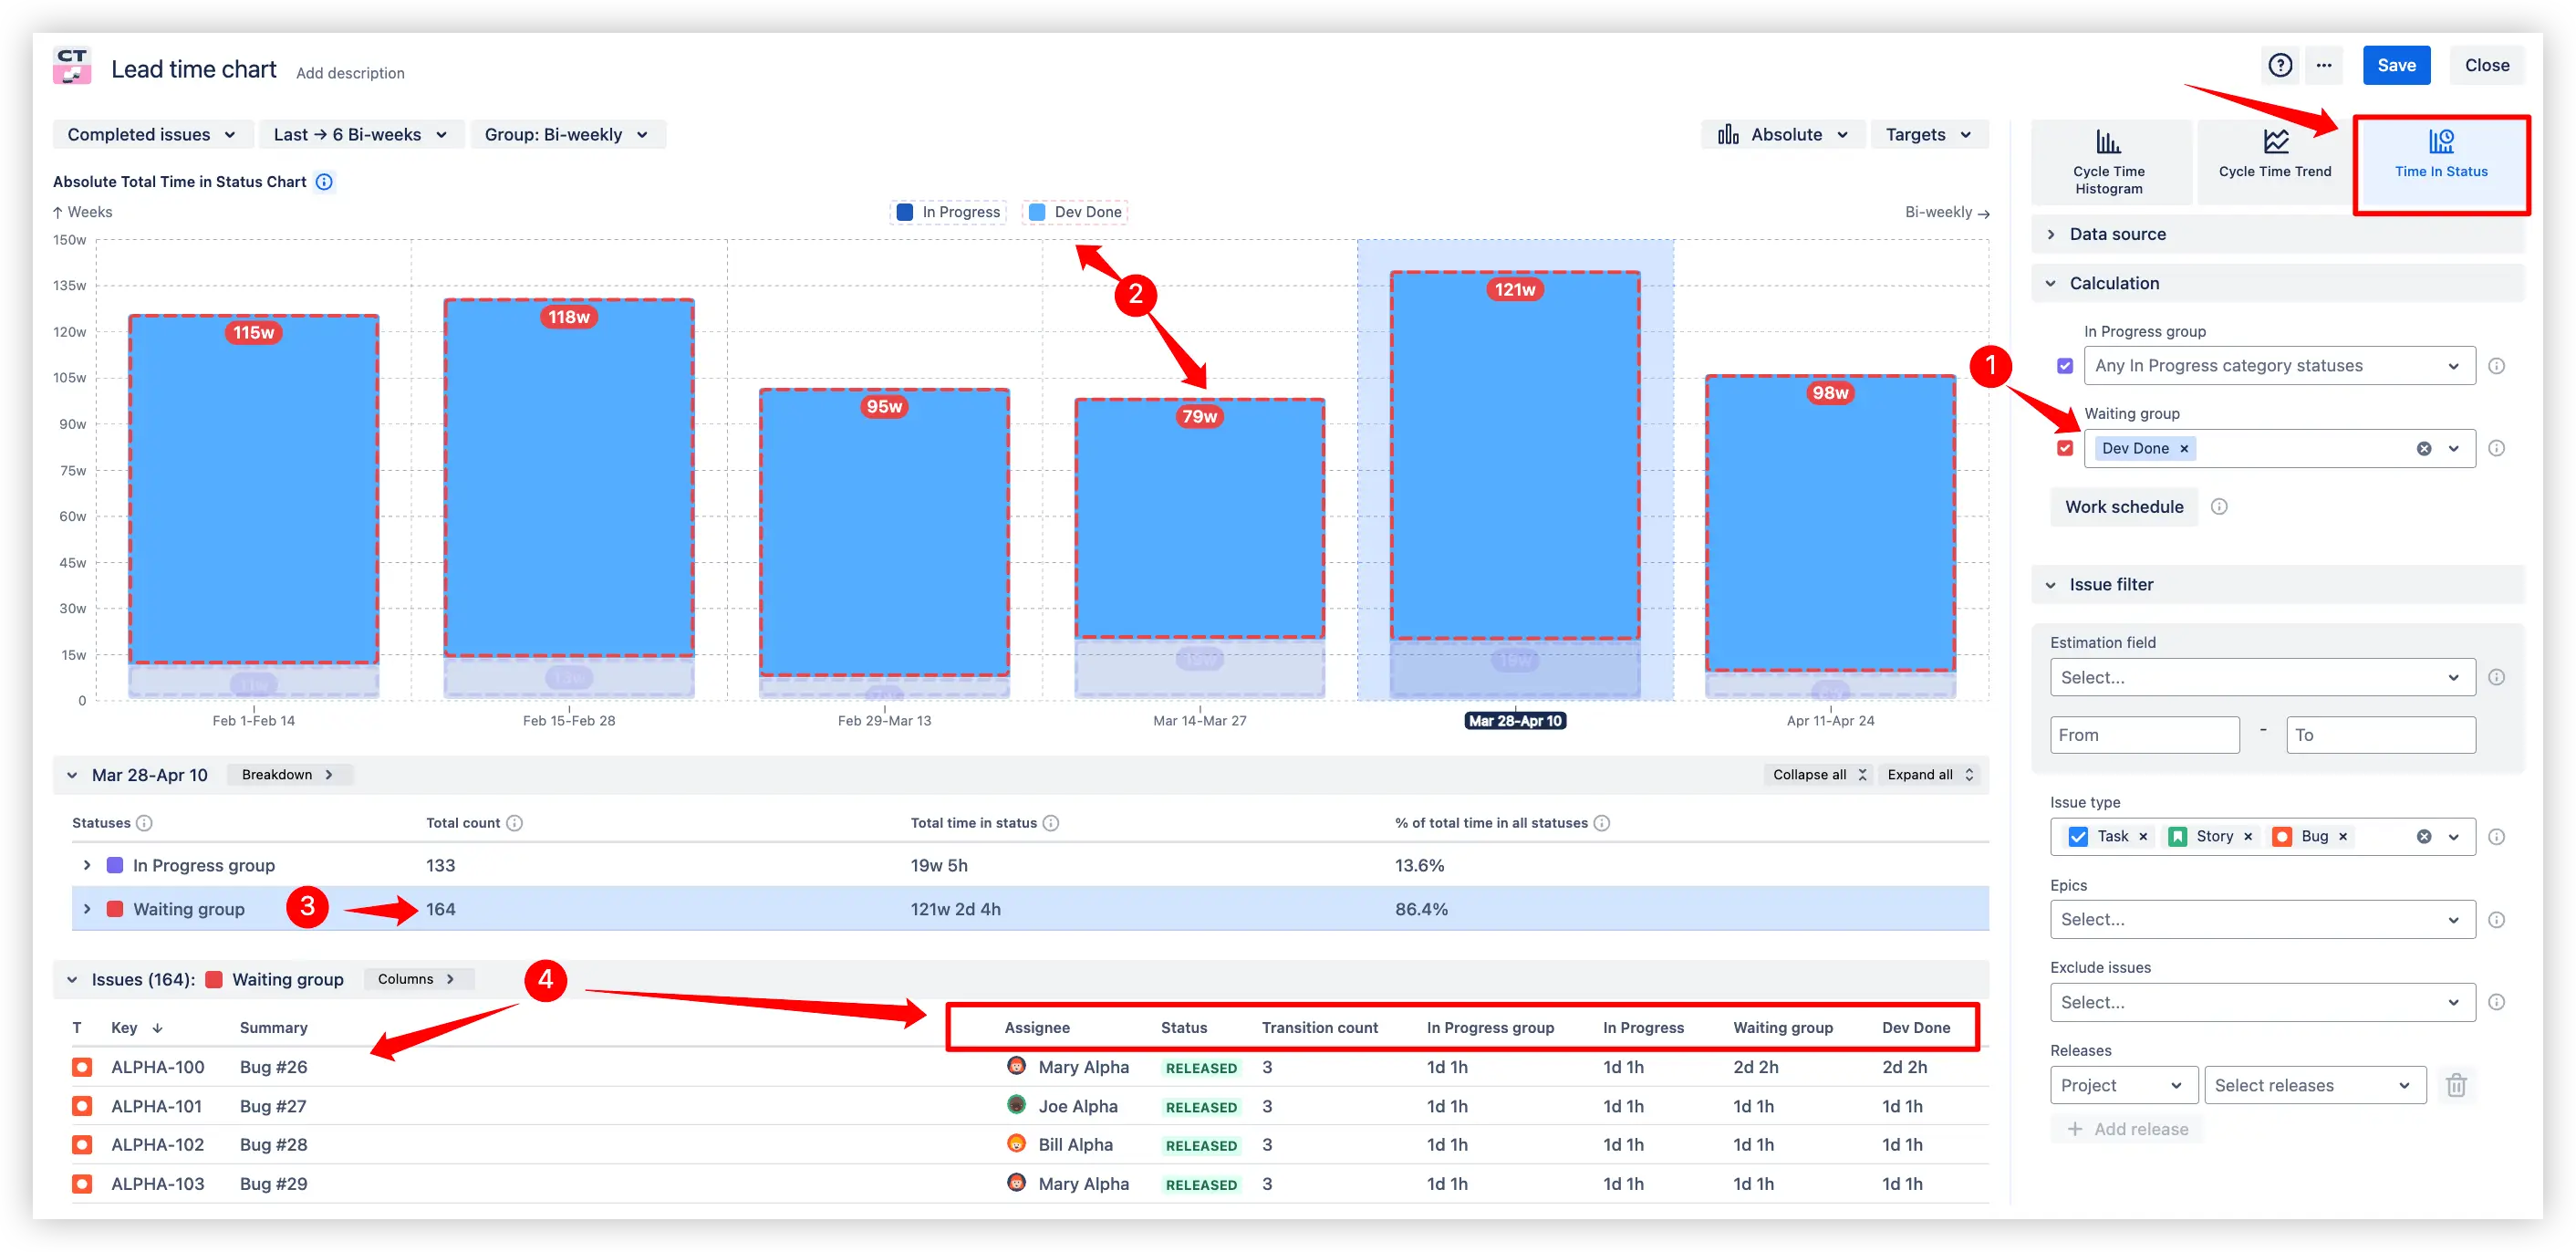
The Time in Status chart helps teams understand where time is lost after active work ends by measuring how long issues stay in waiting statuses, where no progress happens, yet delivery is delayed.
Lead time in status chart on the Jira dashboard
📊 How to read the chart:
The Waiting group selection (1️⃣) defines which statuses are considered "waiting" - for example, “Dev Done” where the development is finished but the issue is still pending QA or stakeholder input. The bar segments (2️⃣) distinguish between In Progress and Waiting time, helping you visualize how much time is spent actively working vs. passively waiting across each bi-weekly period. The status breakdown section (3️⃣) shows total time spent in each group. In this example, 86.4% of total time is spent in waiting statuses - a strong indicator of potential inefficiencies or handoff delays. The issue list (4️⃣) provides a detailed view per ticket, including time in each group, transition count, and assignee, helping teams trace delays and identify bottlenecks hidden behind “done but not delivered” states.
By separating time into In Progress and Waiting groups, this chart shows where work gets stuck, enabling teams to:
Detect invisible delays hidden in “done but not delivered” statuses
Spot prolonged wait times that extend lead time even after development is finished
Prioritize tickets that are technically done but still awaiting QA, review, or stakeholder input
Streamline workflows by reducing idle hand-off time between active stages
Whether you're tracking SLA compliance or managing cross-functional handoffs, this chart turns status-level data into actionable insight, helping you deliver faster by acting before delays become bottlenecks.
WYSIWYG (What You See Is What You Get) editor
Whether you're configuring a Lead time histogram, Trend, or Time in status chart, any change you make is immediately reflected on the chart. Adjust a setting and see the result in real time - no tab switching, no reloads.
WYSIWYG editor on Lead time chart example
As you fine-tune the configuration, be it chart type, breakdowns, issue list, or global settings, the chart updates on the fly, so you always know what you’re getting.
Settings are organized into categories like Data source, Calculation, and Issue filter to help you stay focused.
Need more room to work? Just collapse the right-hand panel. Once ready, you can save your chart as a gadget to any dashboard - or even create a new one right away without leaving the editor.
What about the native Jira lead time chart
There’s no native Jira lead time report available in Jira Dashboards out of the box. Instead, you can use the Control Chart, which tracks how long issues spend in a specific status category (typically reflecting Cycle Time, not Lead Time).
To approximate lead time, teams often rely on the time from issue creation to completion, but this requires careful workflow configuration, and even then:
You can’t group results by time intervals (e.g., weekly, bi-weekly);
You won’t see a trendline or SLA thresholds;
There’s no visibility into waiting statuses or detailed breakdowns.
In contrast, the AgileCycle Time Chart app by Broken Build offers full support for Lead Time analysis, including histograms, trendlines, waiting time detection, and deep filtering by issue fields or JQL.
Advantages of using the Lead time chart
Add multiple Lead time gadgets to your Jira dashboard
Understand how long it really takes to deliver work, from issue creation to completion
Track delivery trends over time to see if your team is improving or slowing down
Spot outliers and delivery variability with lead time distribution
Break down delivery time by workflow stage to find where work gets stuck
Distinguish between active work and waiting time to detect hidden delays
Set realistic SLA targets using percentiles like the median or the 85th percentile
Compare performance across teams, boards, or issue types using flexible filters
Drill down into individual work items for root cause analysis
Visualize progress clearly for stakeholders with trendlines and grouped timelines
The Agile Reports and Gadgets app also supports Lead time chart and includes a rich set of additional reports and chart types.
Frequently Asked Questions
1. What is lead time in Agile?
Lead time in Agile refers to the total time it takes to deliver a work item, from the creation to completion. It includes all stages of the process: waiting, analysis, development, review, and deployment.
Unlike cycle time, which usually starts when actual work begins, lead time captures the full journey, making it a key metric for understanding value delivery speed from a customer or stakeholder perspective.
2. What is a Lead time chart?
A Lead time chart shows how long it takes to deliver work, from the moment a work item is created until it is completed.
It helps teams understand their end-to-end delivery timeline, identify delays across the process (including the time before development starts), and track how delivery performance changes over time.
Lead time charts can be visualized in different formats - for example, histograms to analyze the distribution of lead times, or trend lines to observe how delivery times evolve across selected time periods.
3. How do you calculate lead time?
Lead time is calculated as the time between when a work item is created and when it is completed (usually when it reaches a "Done"-type status in Jira).
In most lead time charts, this includes all the time the issue spends in the backlog, in progress, under review, or waiting, capturing the full duration from request to delivery.
4. What is normal lead time?
There’s no universal “normal” lead time - it depends on your team’s process, work type, and delivery expectations.
For example, P1 bug fixes may have a lead time of a few days, while new features could take several weeks.
Instead of aiming for a fixed number, teams often define target lead time ranges (e.g. 1-2 weeks) and track what percentage of work falls within that range.
With the Lead time trend chart, available as part of the Agile Cycle Time Chart, you can visualize how your actual lead time changes over time and add custom target lines directly on the chart to monitor performance against your expected thresholds.
5. How is a Lead time chart generated in Jira?
First, lead time charts in Jira are generated based on the work items that match the selected filters and data sources. Then, lead times are organized into time intervals such as hours, days, weeks, or months. The generated Lead time chart then visualizes this data, whether as distributions or time trends, with the option to break down results by any Jira field and view detailed information for each issue.
6. How to add a Lead time chart to a Jira dashboard?
Jira does not provide Lead time charts out of the box, but you can add them using the Agile Cycle Time Chart Marketplace app.
To add a Lead time chart gadget (Histogram, Trend, or Time in Status) to a Jira Dashboard:
Ensure the Agile Cycle Time Chart app is installed.
Go to your Jira Dashboard and use the gadget search to find “Agile Cycle Time Chart”.
Select your data source, choose the chart type, and instantly generate a Lead time chart with a wide range of real-time configuration options.


.svg)


.png)
