
Thank you! Your submission has been received!
Oops! Something went wrong while submitting the form.


The Scrum Created vs. Resolved chart shows whether Scrum teams are resolving work at the same pace that new issues are being created. For each sprint or reporting interval, the report compares incoming work to completed work, so teams can see when demand is balanced, when intake starts to exceed output, and when a sprint ends with unresolved carryover.
This example is built around five Scrum teams, seven closed sprints, and one active sprint. The same Scrum Created vs. Resolved report can be read as a weekly sprint balance view or as a cumulative carry-over lens over the same Last 16 weeks range. Together, these views help Scrum Masters, Product Owners, and delivery managers connect sprint commitments with real Jira issue movement.
Unlike a static Jira dashboard gadget, Agile Created Resolved Charts lets teams choose the data source, define what counts as Created and Resolved, switch between Cumulative and By period modes, select a time range, group results by period, and drill into the issues behind each point or bar. The result is a practical Scrum created vs. resolved chart in Jira that works for a single team or multiple Scrum teams.
✅ Product Owner: I use the Scrum Created vs. Resolved chart to see whether new backlog items are entering the sprint faster than the team can close them. If the created work stays above the resolved work, I review scope, intake rules, and refinement quality before the next planning session.
✅ Scrum Master: I review the Scrum Created vs. Resolved report during retrospectives. A weekly spike in created issues often points to interruptions, production work, or unclear requirements, while a late resolved spike can reveal end-sprint closure pressure.
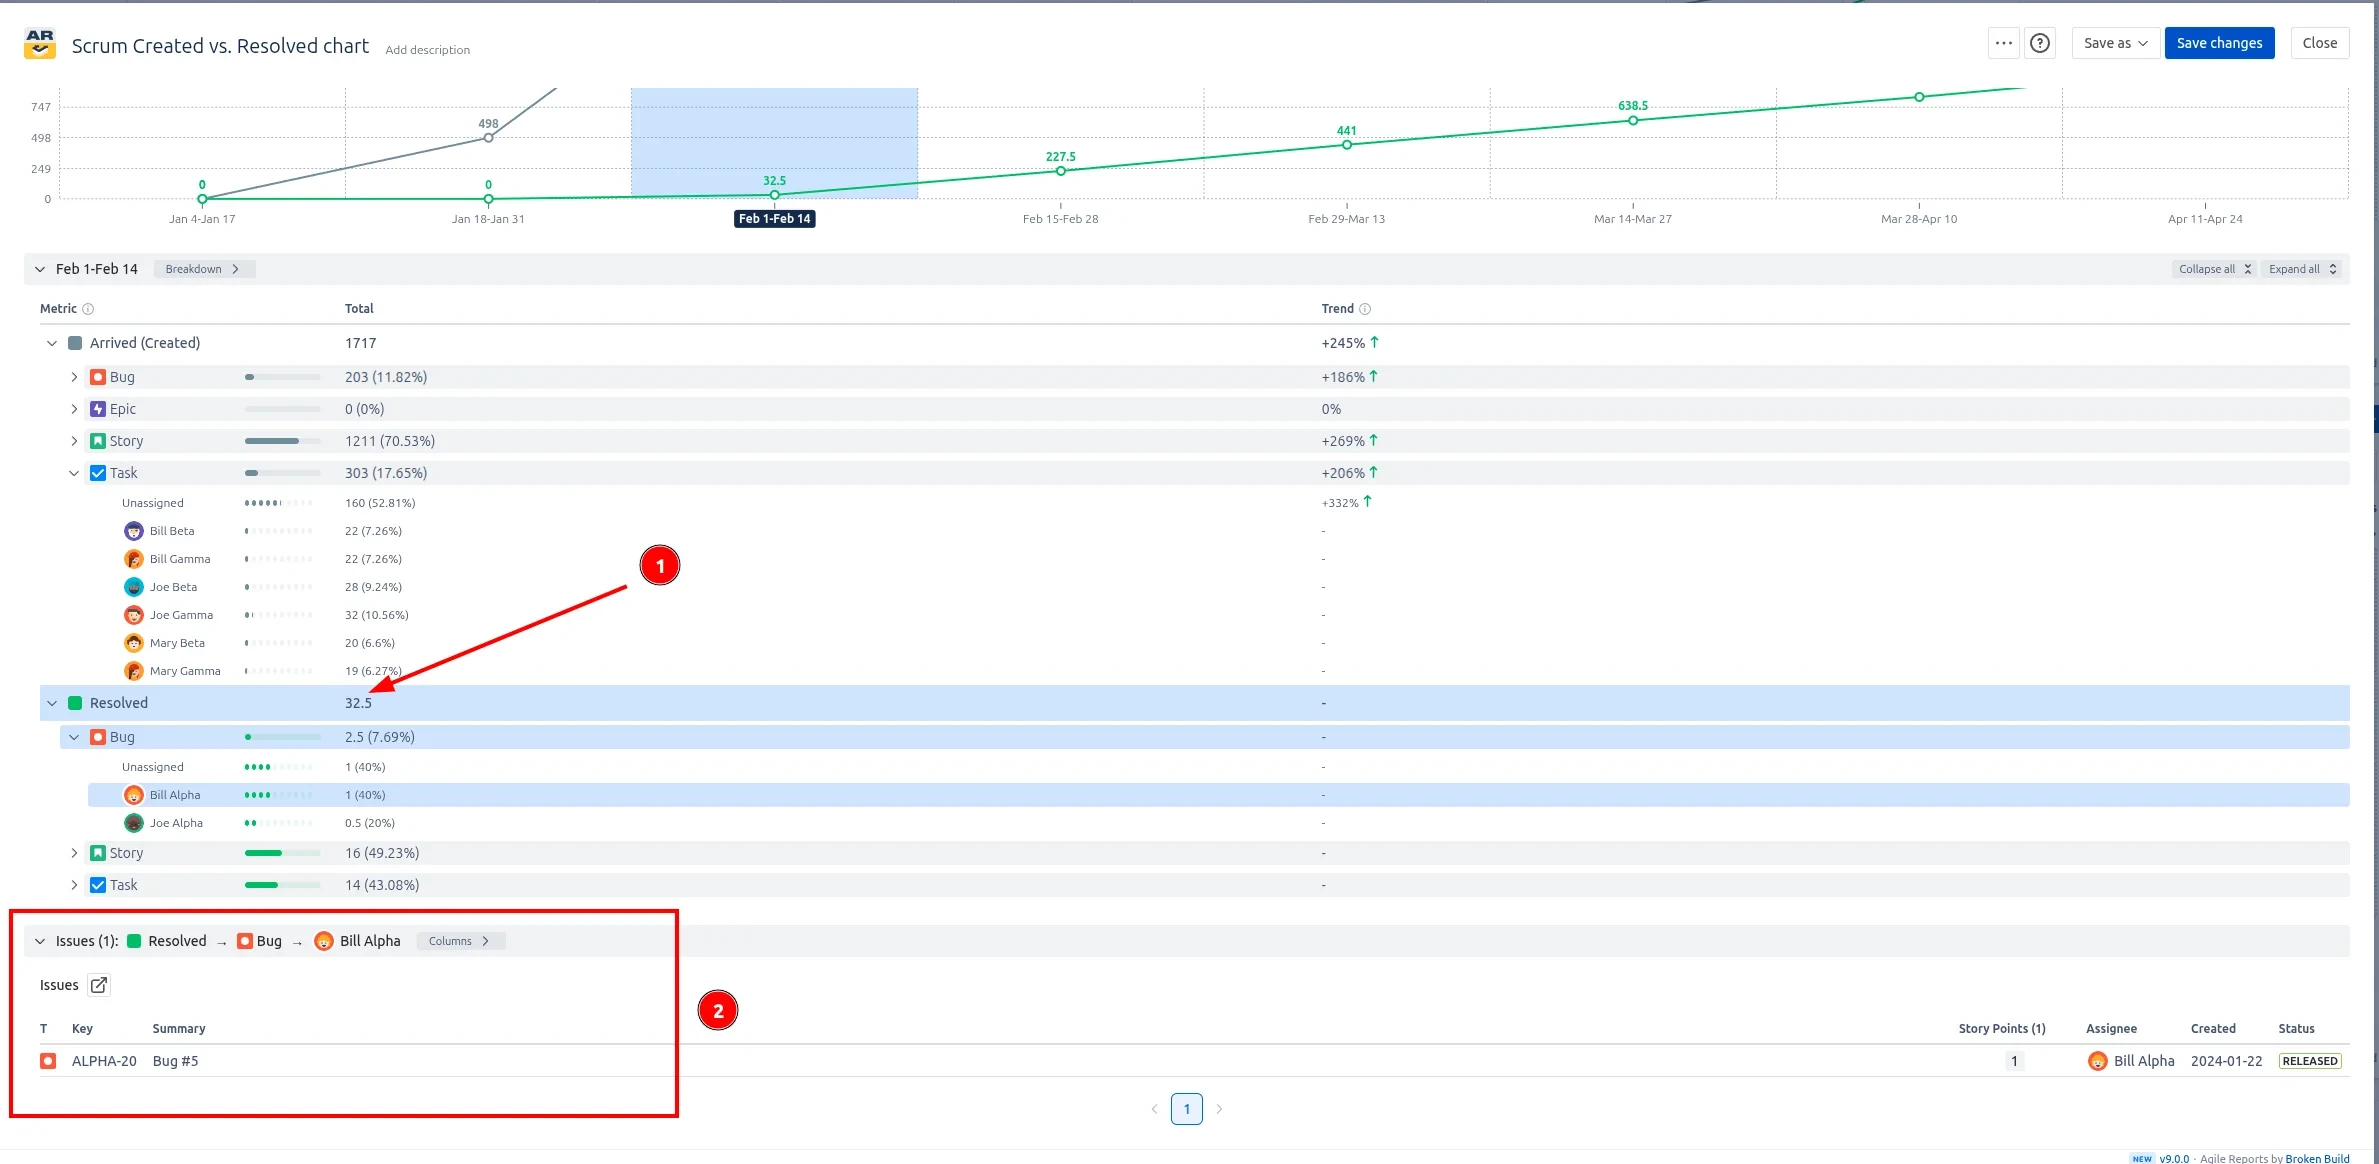
✅ Team Lead: I use the chart to drill into a period and check which issues caused the imbalance. The issue list and breakdown help me separate delivery bottlenecks from normal sprint variation.
✅ Engineering Manager: I compare created vs. resolved chart data for multiple Scrum teams to see where capacity is stable and where backlog swell is becoming a trend across teams.


The sprint balance view answers a direct Scrum question: Did the team resolve at least as much work as it created during the selected reporting window? This view uses Boards -> Scrum boards as the data source, Last 8 bi-weeks as the time range, and Group: Bi-weekly. It is useful when the team wants to monitor short-term balance while a sprint is still active.
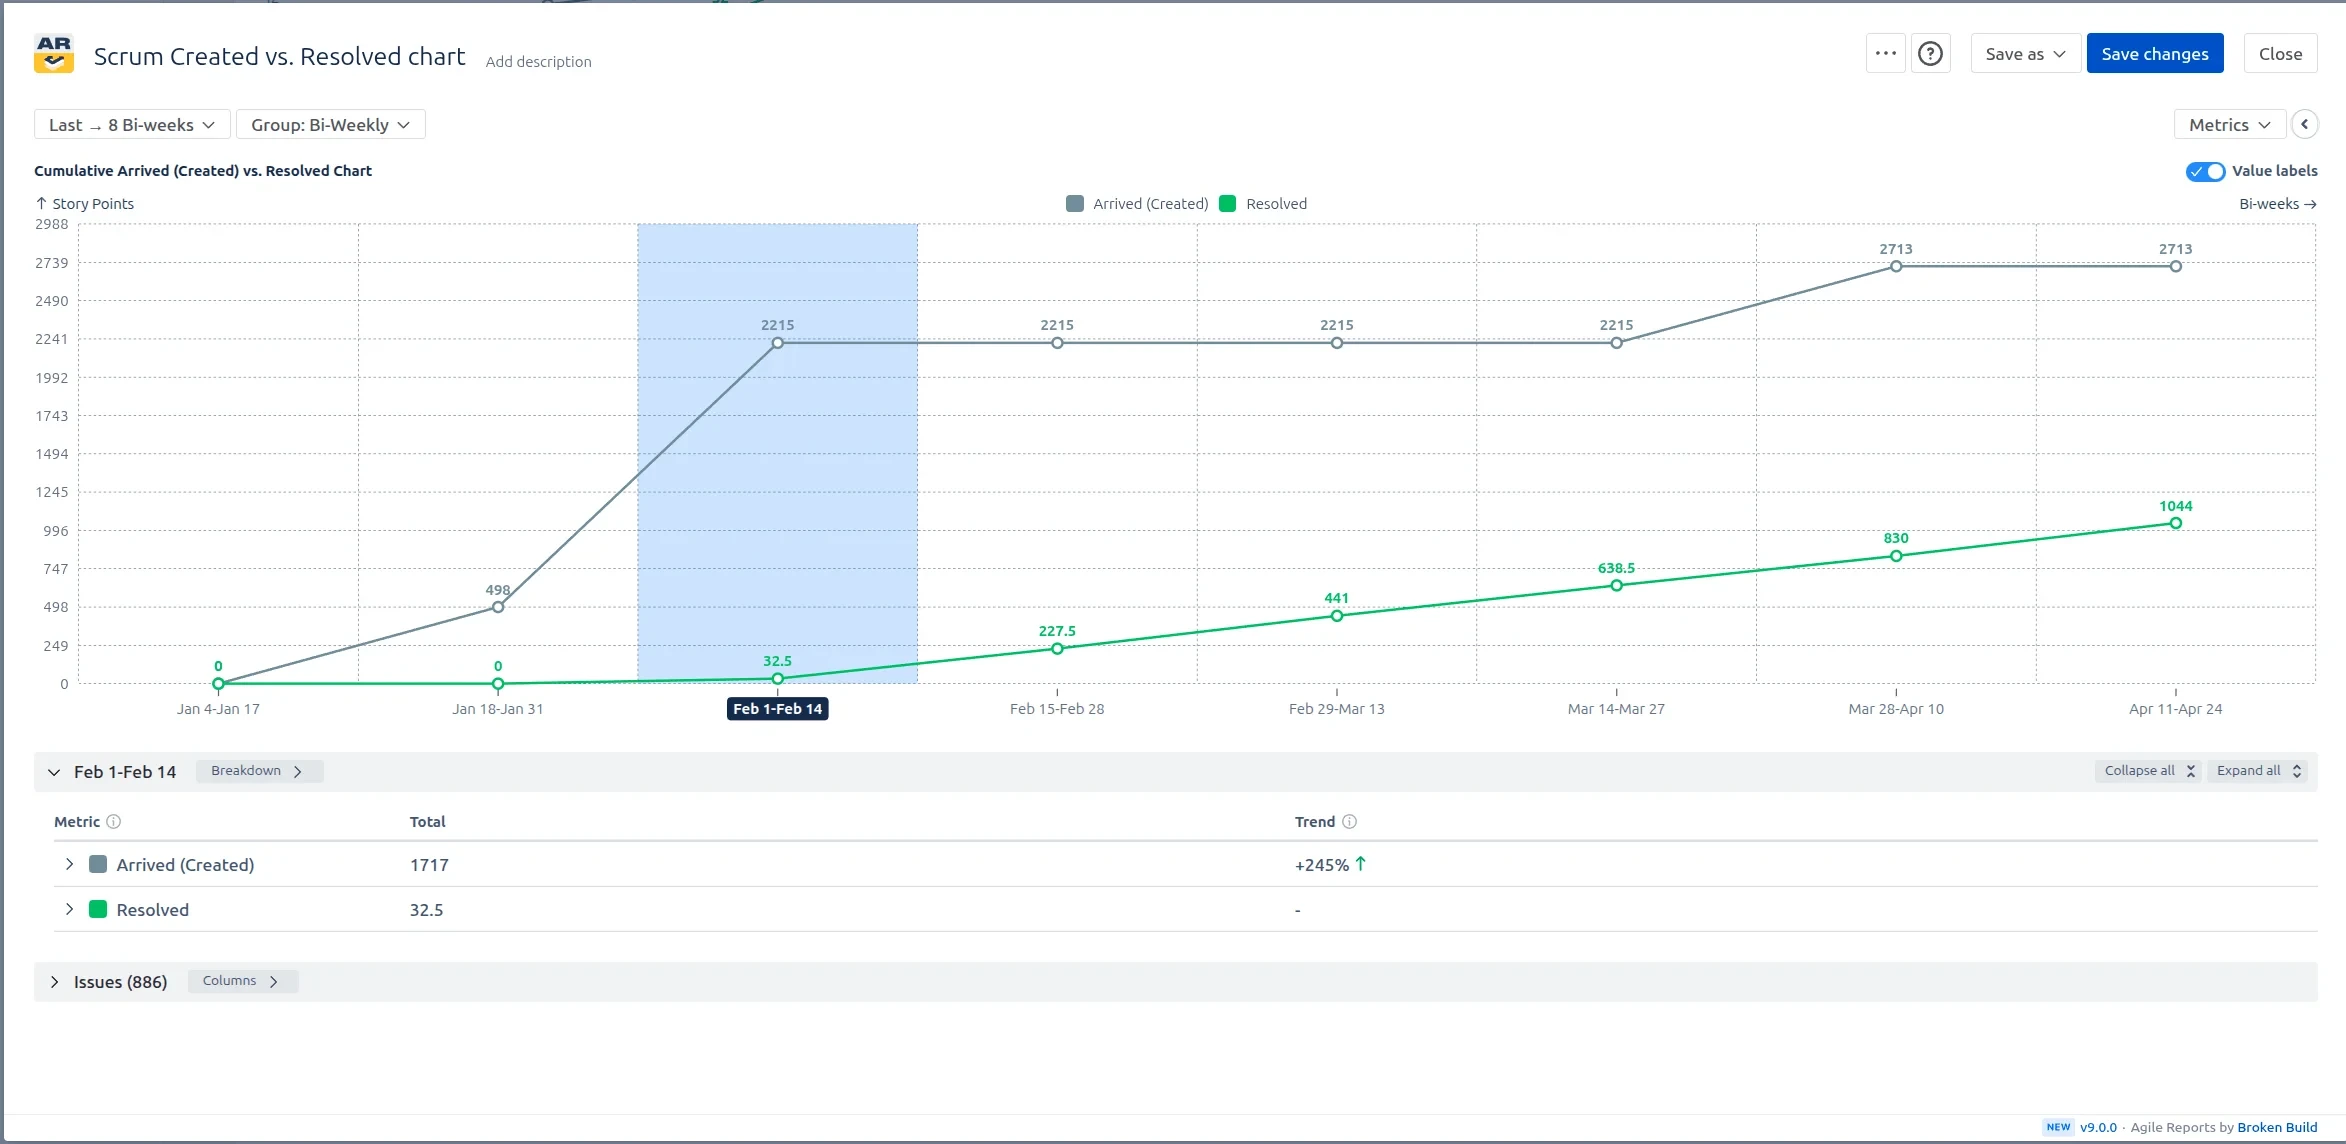
In this setup, the Last 8 bi-weeks bring in matching issues from the selected Scrum boards and groups the results bi-weekly. When Created is higher than Resolved, the chart highlights backlog growth risk inside the active sprint. When Resolved catches up later in the range, the team can see recovery rather than treating the sprint as uniformly unhealthy.
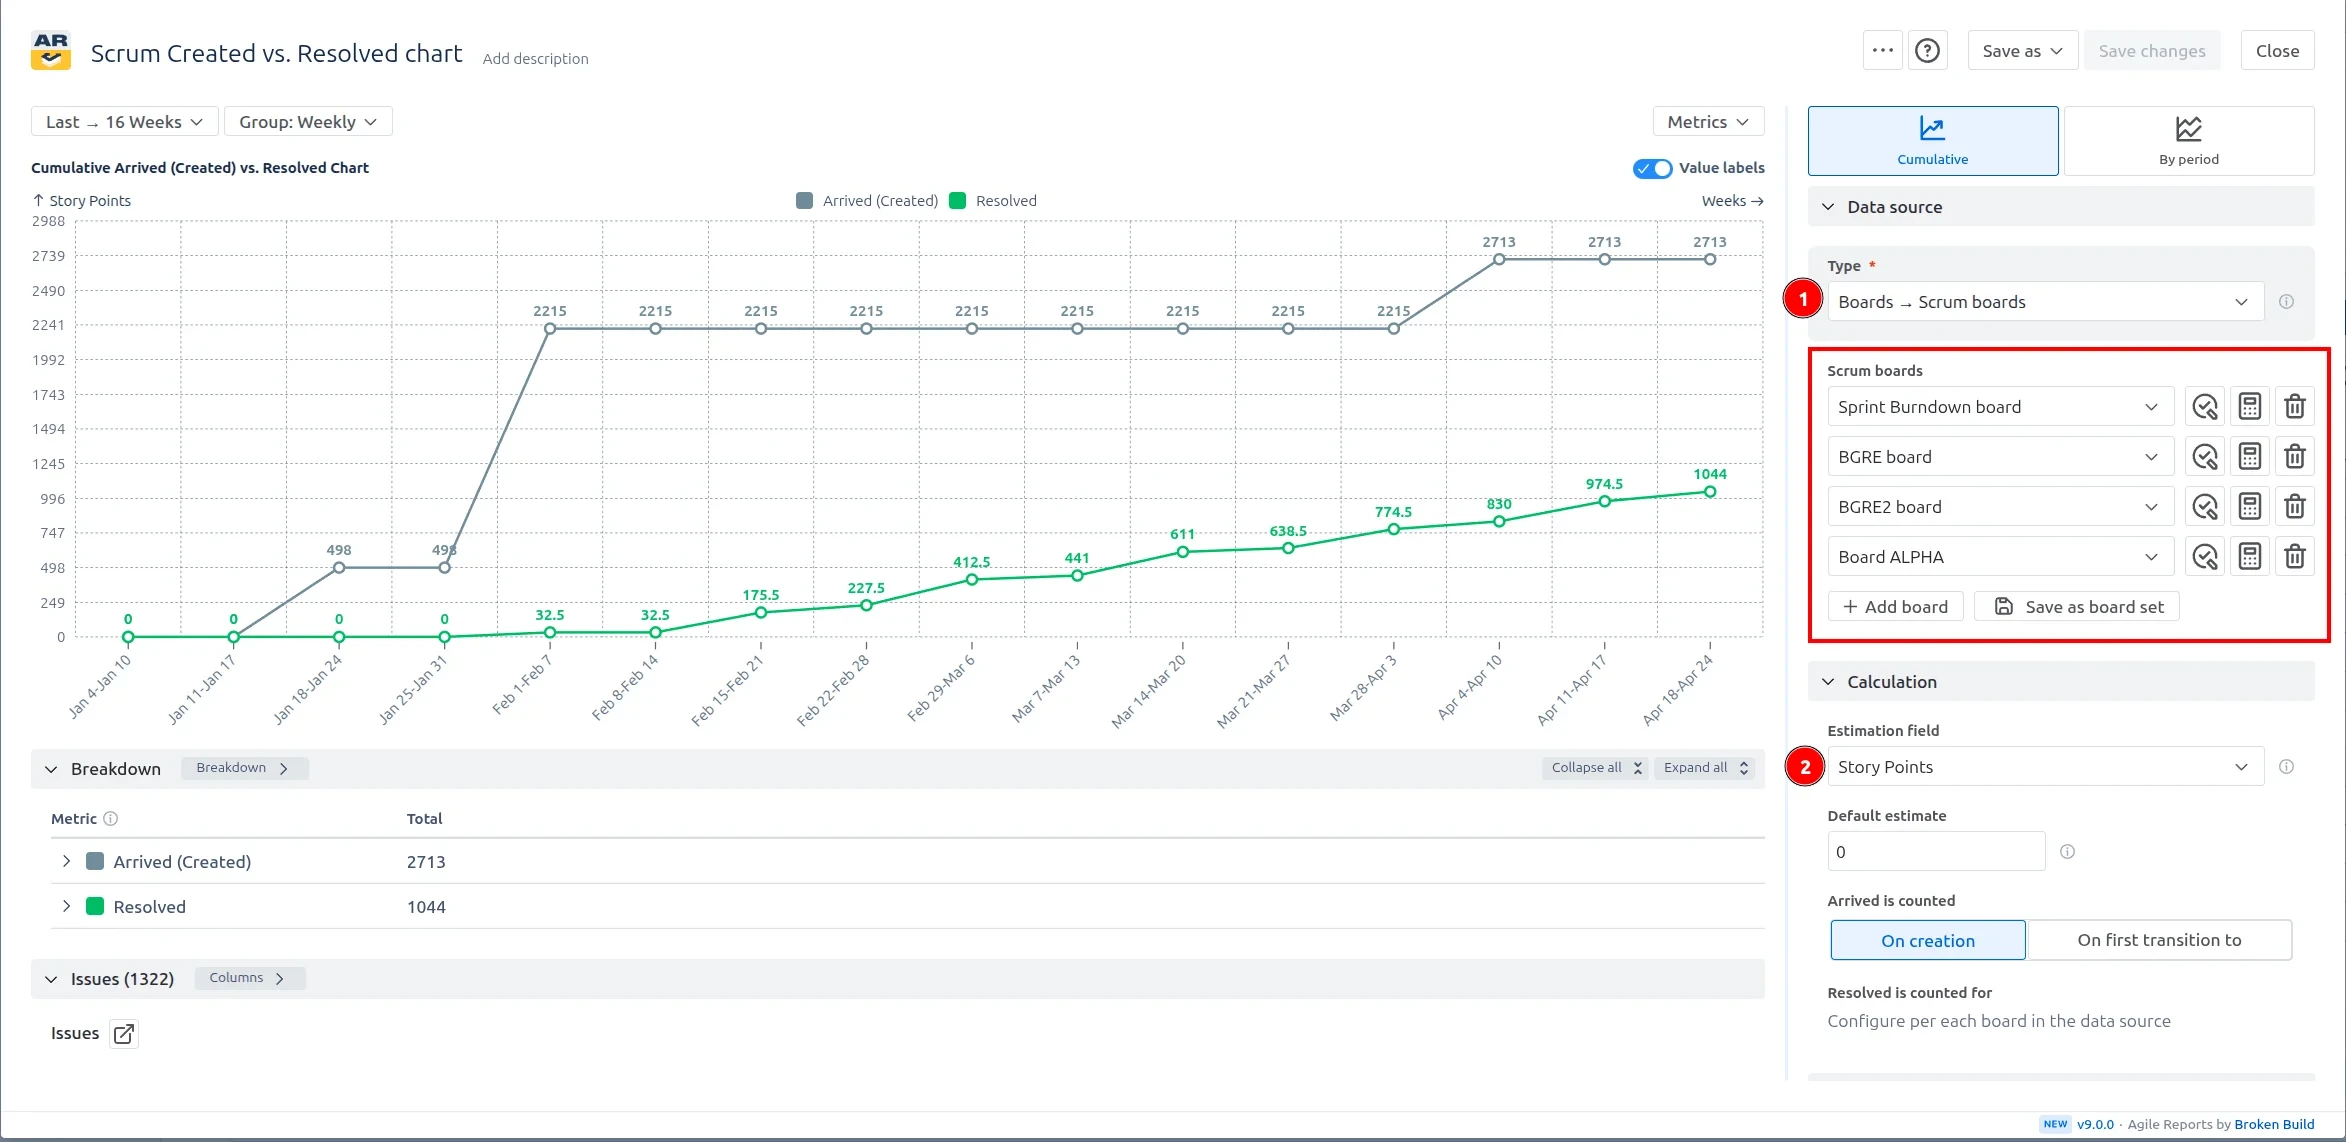
The sprint carry-over lens uses the same Scrum Created vs. Resolved report but changes the reading frame to Cumulative mode over Last 16 weeks with Group set to Weekly. This makes carry-over patterns visible: repeated late closure spikes, unresolved work that carries into the next sprint, and teams that consistently create more work than they resolve.
For multiple Scrum teams, this view is especially useful because the chart can expose which teams have stable sprint closure and which teams need help with intake control, dependency management, or scope splitting. It also helps managers avoid judging a single sprint in isolation by showing whether the same imbalance repeats over time.
Jira has a native Created vs Resolved report that can show opened and resolved issues over time for a project or filter. It is useful for a basic backlog trend, but it is limited when a Scrum team needs a sprint-level delivery conversation. Native Jira reporting is less flexible for multiple Scrum teams, custom Done definitions, issue weighting, breakdowns, and sprint-specific drill-down.
The Scrum Created vs. Resolved chart in Jira from Broken Build is designed for teams that need more control. You can focus on Scrum boards, combine teams, choose the time range and period grouping, define what counts as resolved, and inspect the issues behind the numbers without leaving the dashboard context.
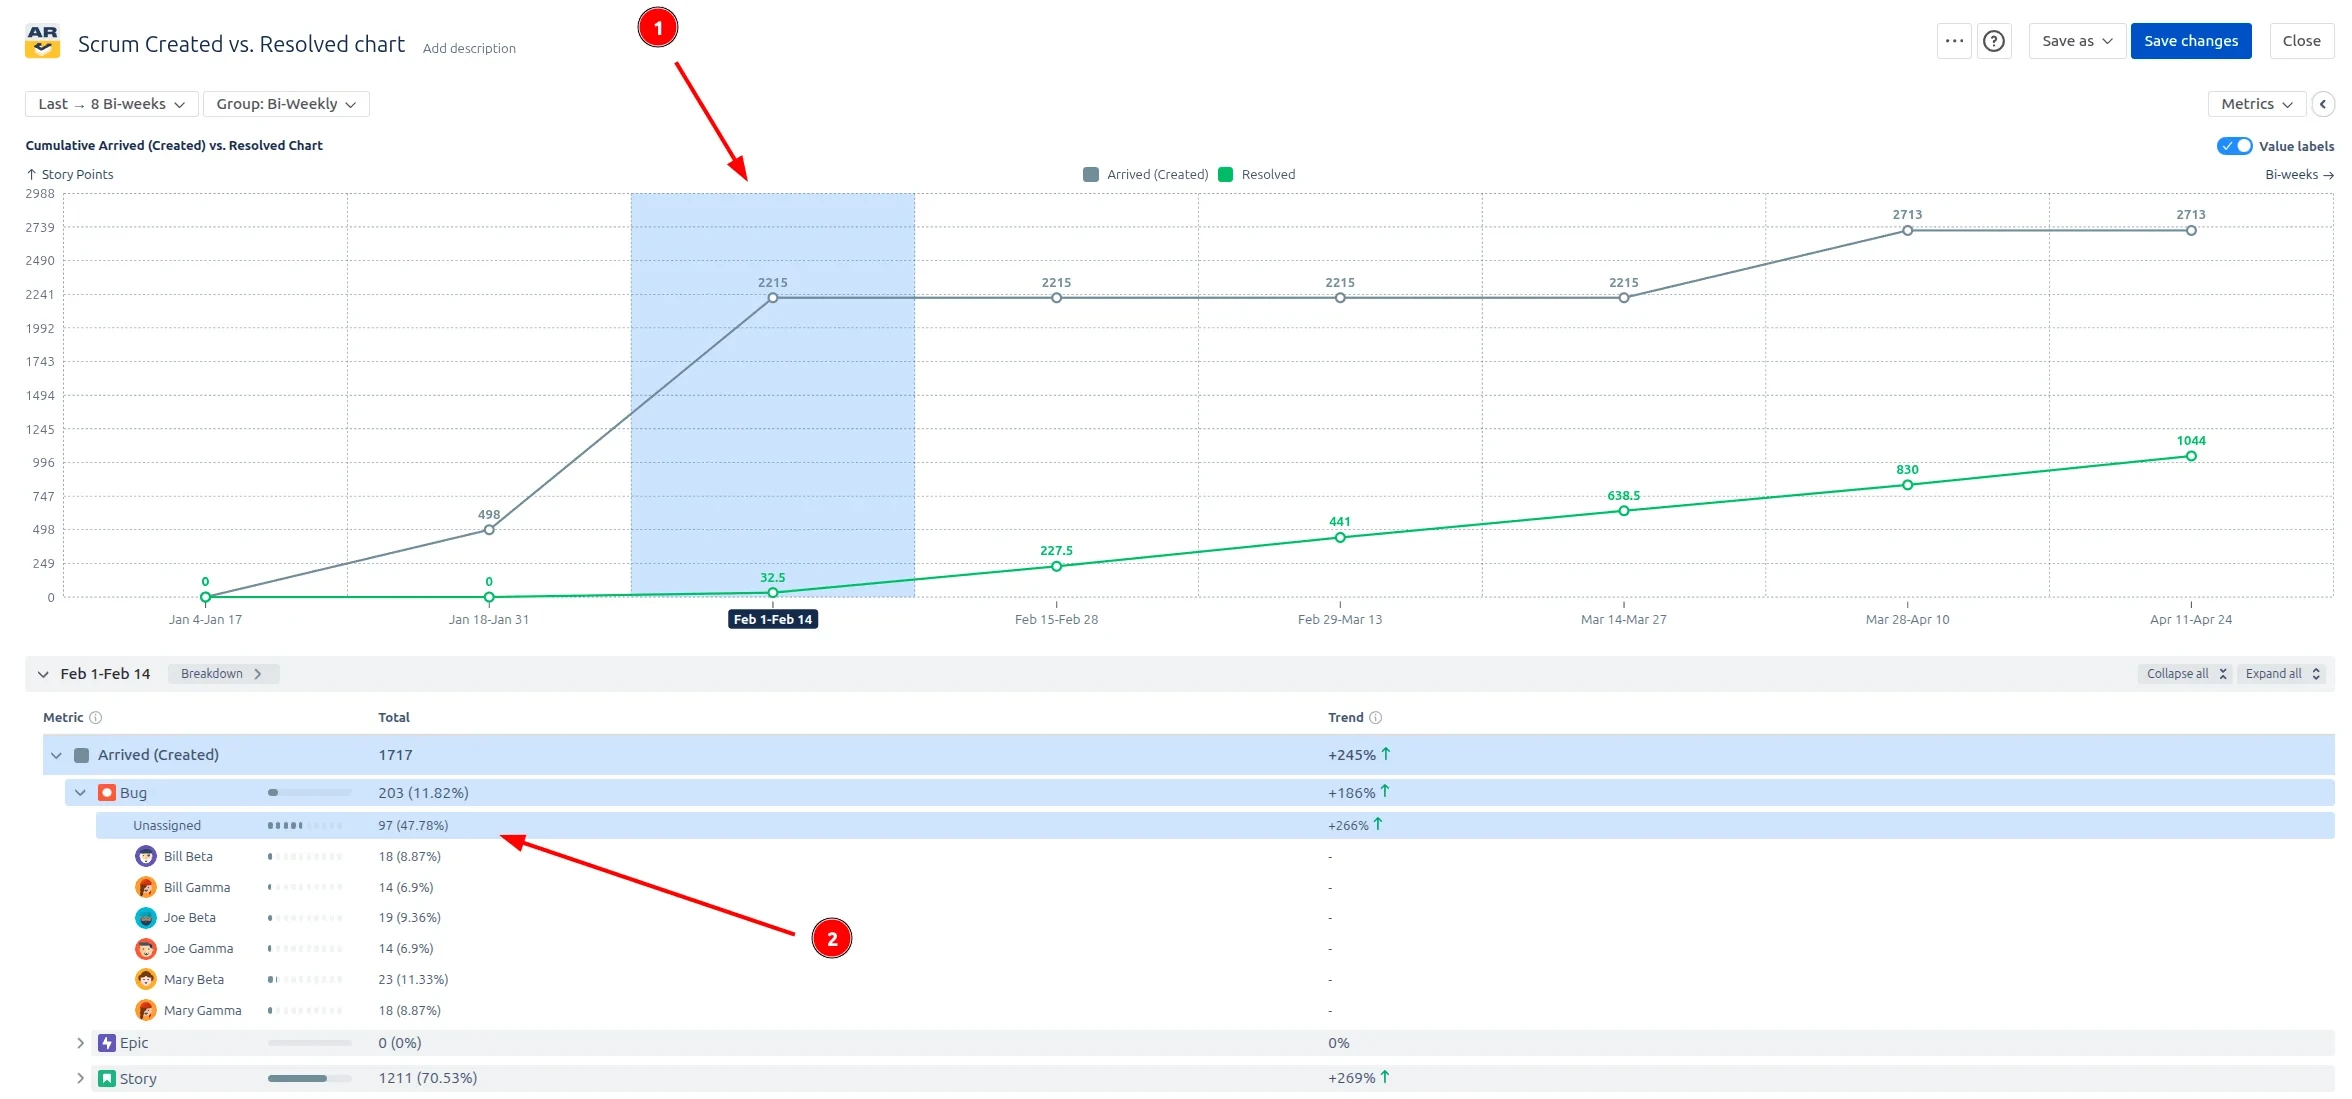
An Agile Created vs. Resolved chart for Scrum turns created and resolved counts into a working delivery signal. Instead of only asking whether the backlog is growing in total, teams can see when the imbalance happened, which sprint it affected, and which issues or work categories contributed to it.
Use this example to recreate a similar Scrum Created vs. Resolved report on a Jira dashboard or to build a custom chart for your own Scrum teams.
The Agile Reports and Gadgets app includes Created vs. Resolved functionality together with other Jira dashboard reports for Scrum, Kanban, and scaled agile teams.
Both apps have a 30-day free trial and are free for teams under 10 people.


.svg)

.png)
.png)
