
Thank you! Your submission has been received!
Oops! Something went wrong while submitting the form.


The Version report helps you track throughput and forecast release completion based on velocity trends. Instead of being limited to a single release, you can analyze one or multiple fix versions across projects, compare contributions from different teams, and put performance into context with benchmarks and targets.
With flexible breakdowns, custom calculations, and filtering options, the Agile Velocity Chart Gadget app adapts to any workflow and provides stakeholders with a clear, release-focused view of delivery progress.
✅ Product Owner: I use the Jira release report to see how our velocity trends impact delivery timelines, helping me forecast feature completion and set realistic expectations with stakeholders.
✅ Technical Team Lead: I use the breakdown by project, board, or assignee to see how my team contributes to a shared release and to catch any bottlenecks early.
✅ Delivery Manager: I monitor throughput across multiple releases and projects, using benchmarks and target lines to ensure consistent velocity and keep multiple teams on track toward shared milestones.
✅ Product Manager: I rely on the Jira version report gadget to validate that roadmap items tied to releases are progressing, and I use filtering to focus only on the scope I own.
✅ Portfolio manager: I compare releases across ARTs and projects to assess whether delivery velocity supports our portfolio-level investment priorities.


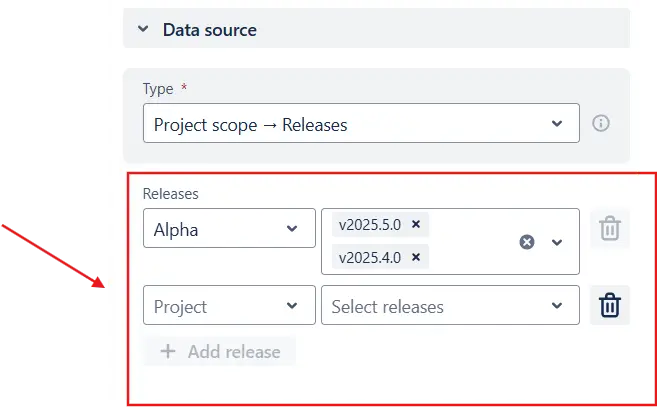
Use fix versions as the data source to build a velocity chart focused on releases instead of boards. This allows you to analyze the throughput delivered toward a release and forecast its completion date based on past velocity trends. You can select one or multiple releases, even across different projects.

The “Release-based velocity tracking“ feature is helpful for:
Click on a sprint or interval (1️⃣) in the Version chart in Jira to open a detailed breakdown. You can compare throughput across individual releases (2️⃣) or projects and see how different teams contribute to the overall delivery. The breakdown fields are fully customizable - group by assignee, board, label, or any other Jira field (3️⃣). At any level of nesting, you can drill down further into the Issue list (4️⃣) to view the exact issues included in the metric and even edit them directly from the Version report.
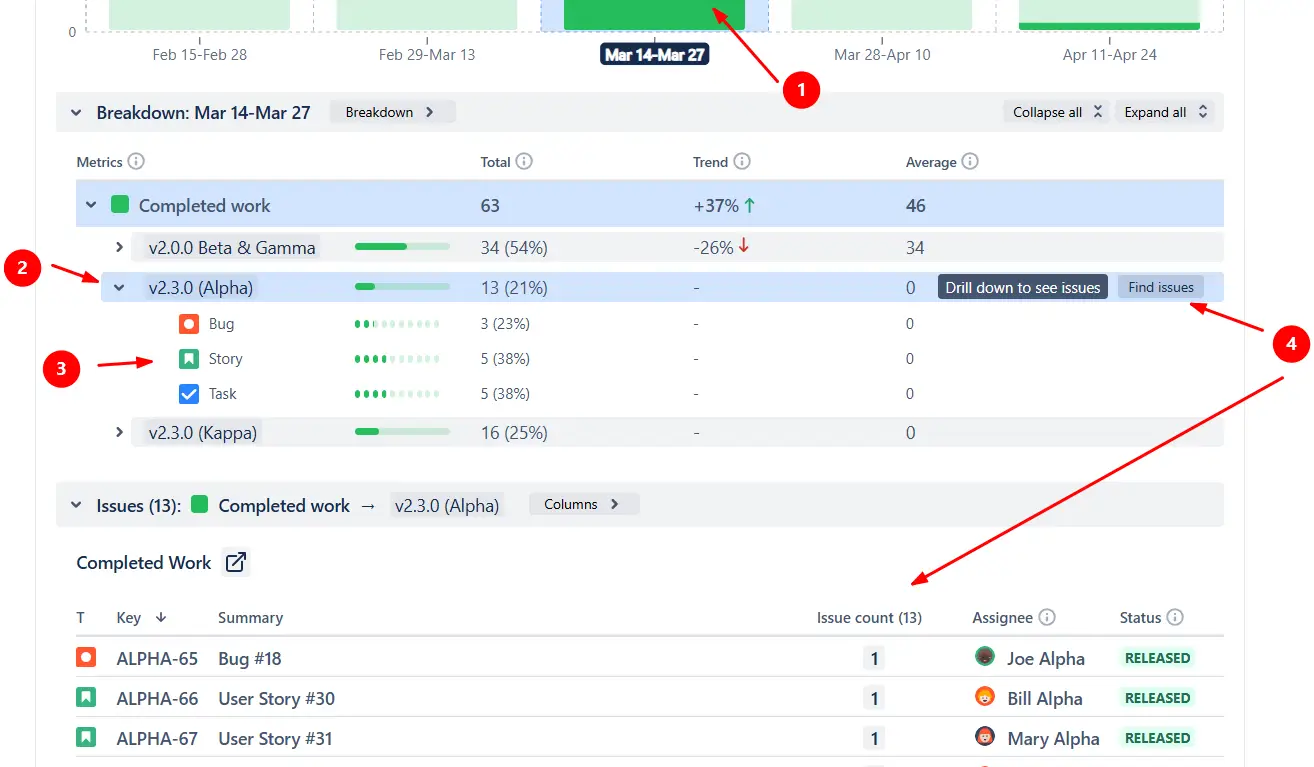
The “Breakdown” feature is helpful for:
Use horizontal reference lines in the Version report in Jira to put throughput into context. Display a line for the median or average (1️⃣), customized over a chosen number of past sprints. You can also add target lines (2️⃣) to track KPIs or delivery goals, making it easy to spot whether teams are meeting expectations.
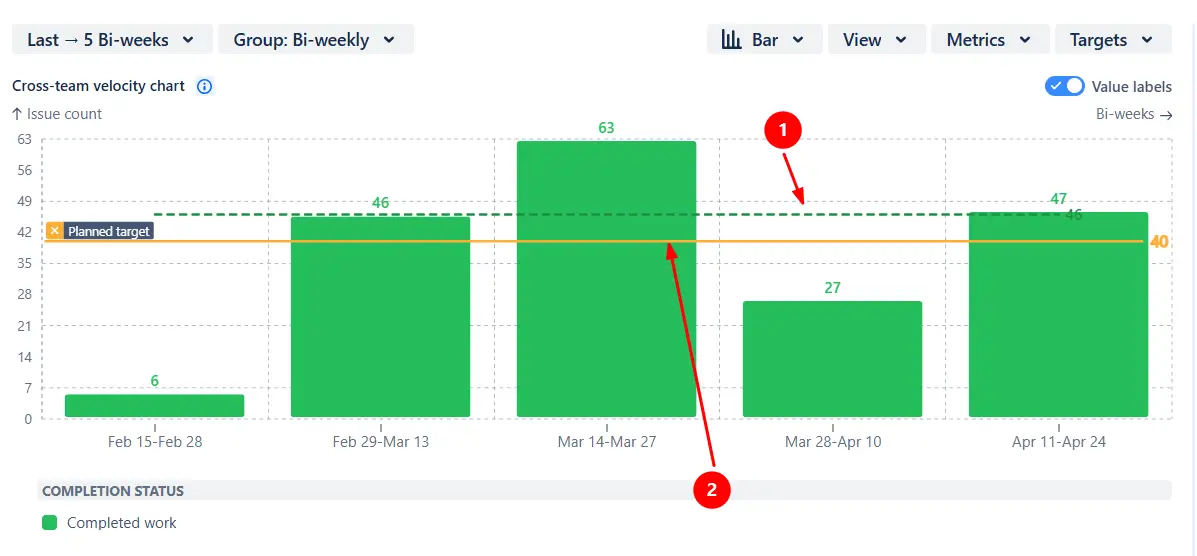
The “Benchmark and target lines” feature is helpful for:
Tailor the velocity Release velocity chart to match your team’s workflow and reporting needs:
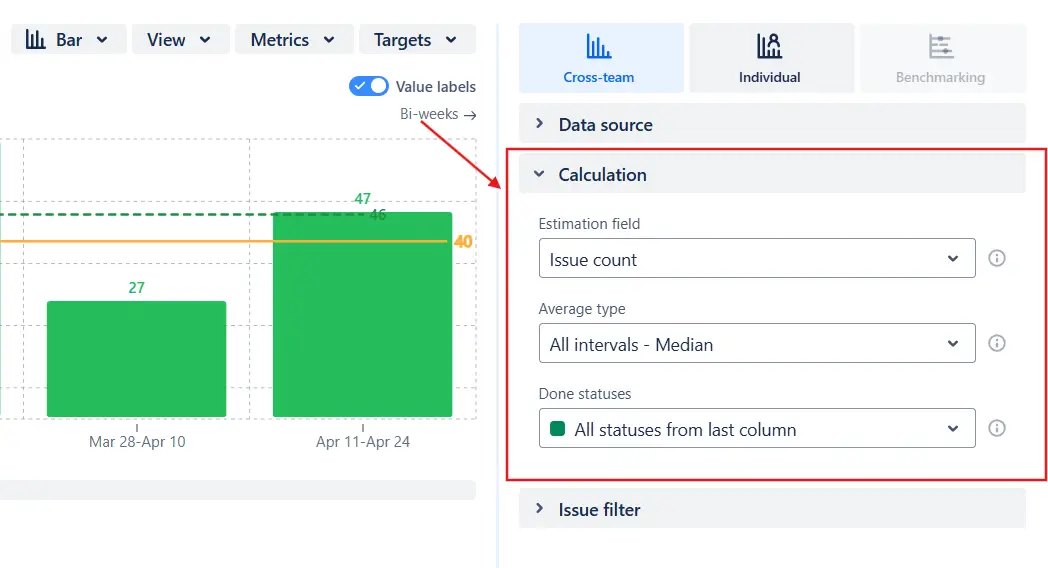
The “Custom calculations” feature is helpful for:
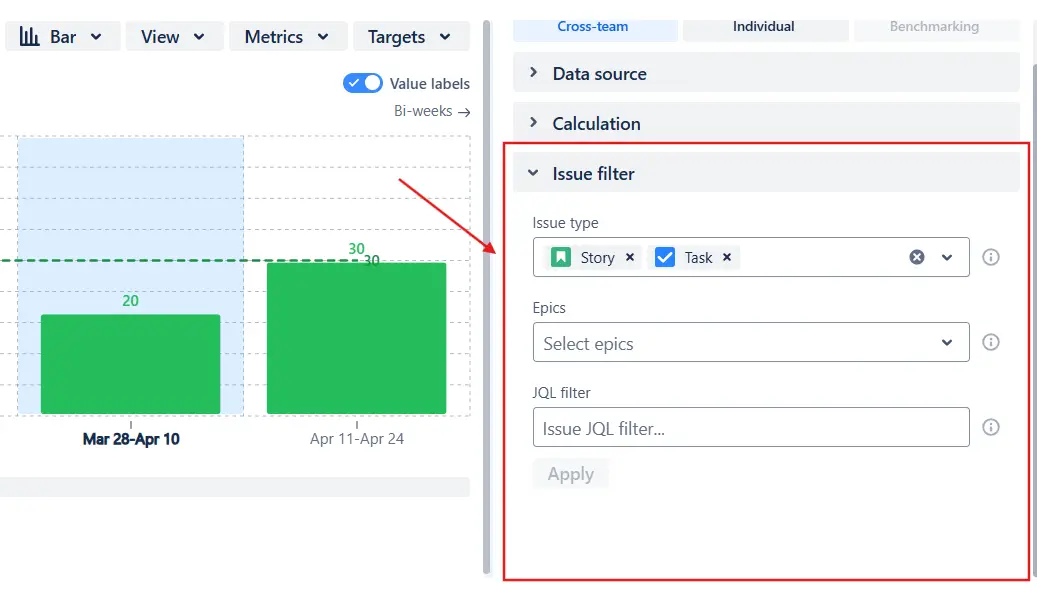
Filter the work items included in the chart scope to focus on the data that matters most. You can narrow the view by issue type, epic, or apply custom JQL for complete flexibility.
Share or archive your insights outside of Jira. Export the Release velocity chart data to CSV for further analysis, or generate ready-to-use PNG and PDF files for reporting and presentations.
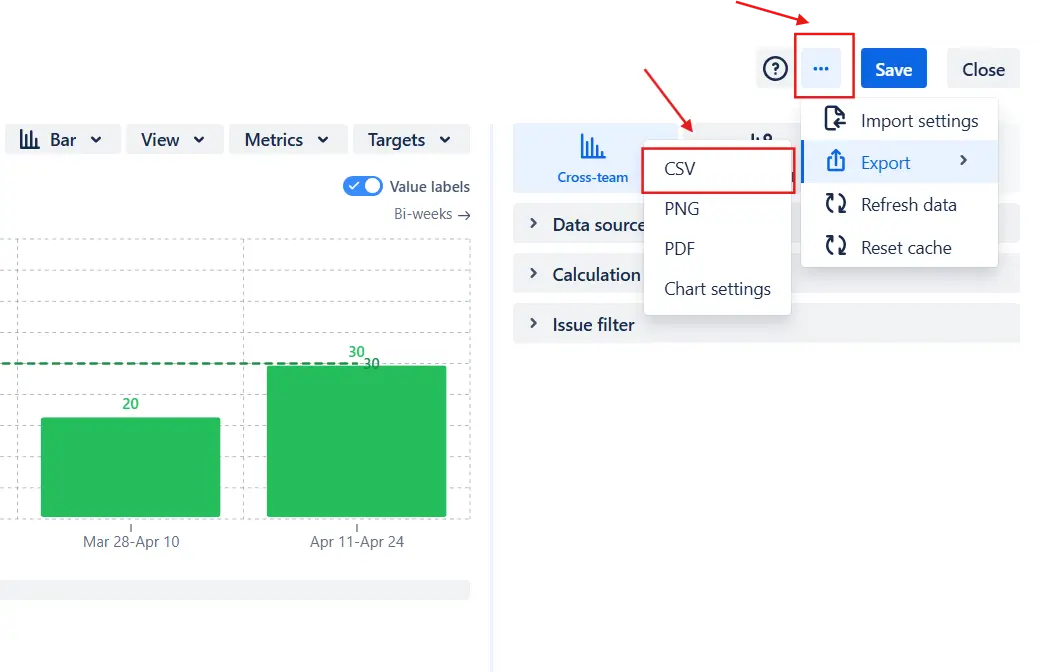
Export settings of the version report for Agile releases
Jira comes with built-in Version Report and Release Burndown, but their focus is on burnup and burndown views rather than velocity. They also have significant limitations:
❌ Each chart is restricted to a single release, cannot group data by time interval instead of sprint, and lacks breakdown options by project, issue type, or other fields.
❌ Customization is limited - you cannot adjust the estimation field, Done statuses, or the displayed period.
❌ Native Jira reports don’t support visual benchmarks or target lines, issue filtering, or switching to a line view to spot velocity trends.
The Version report by Broken Build extends Jira’s reporting with:
Use our examples to build your use cases on the Jira Dashboard.
Both Jira apps (plugins) used in these examples have a 30-day free trial and are completely free for teams under 10 people:
The Agile Reports and Gadgets app also includes Jira version report functionality and a multitude of other reports/charts.
Yes. You can select one or multiple releases from different projects as the data source and use the breakdown feature to group results by release or project. It’s also possible to apply custom JQL filters to refine the scope. The Jira version chart updates instantly to reflect your selections.
By default, the Version report in Jira uses story points, but you can select any estimation field available in your Jira instance, such as issue count, effort, or business value. You can also define a default estimate for items without estimation to keep the velocity calculation accurate.
The Version report gadget shows how much work is completed toward each release and what the team’s average velocity looks like. You can use this data together with your own release plan to estimate when the remaining work is likely to be finished. For date-based forecasting, you can also use the Release Burndown report included in the Agile Reports and Gadgets bundle by Broken Build.
A spike may occur when many small or previously blocked issues are completed at once. A drop can signal blockers, underestimation, or work on non-estimated items, which the chart counts as zero story points by default. To identify the cause, try switching the estimation field to issue count or using the breakdown and issue list to investigate further.


.svg)


.png)
.png)
