
Thank you! Your submission has been received!
Oops! Something went wrong while submitting the form.


The Throughput chart provides a consolidated view of work completed by one or multiple teams. By combining several boards in one report, you can track trends across an entire ART or program, compare results against averages or KPI targets, and drill down into team-level details to uncover bottlenecks and opportunities for improvement.
➡️ Unlike the native Jira Velocity Chart, which is limited to one board, fixed averages, and no filtering flexibility, the Agile Velocity Chart Gadget app delivers advanced throughput tracking available directly on your Jira Dashboard.
✅ Release Train Engineer (RTE): I rely on the Throughput graph to monitor delivery trends and throughput health across all teams in the ART. By spotting imbalances or declining throughput early, I can take corrective action during PI planning or ART syncs.
✅ Product Manager: The Throughput report helps me track how teams are delivering against strategic priorities. By comparing throughput trends and health metrics across boards, I can make informed decisions about roadmap adjustments and investment focus.
✅ Agile Coach: I use the Throughput chart to analyze delivery trends across teams, assess throughput health, and uncover systemic bottlenecks. These insights help me guide process improvements and drive continuous delivery excellence.
✅ C-level Executive: The Throughput chart gadget gives me a clear view of delivery trends against KPIs, helping me track progress toward strategic goals and spot risks early.


Select several boards as the chart data source to track collective throughput in one place. Since teams often run sprints on slightly different dates, the Throughput report in Jira lets you normalize results by grouping data on the x-axis by month or quarter.
For deeper insights, drill down into the throughput of individual teams by clicking a time period and opening the Breakdown section. There, you can group results by board and add another layer of analysis by fields such as assignee, status, or issue type.
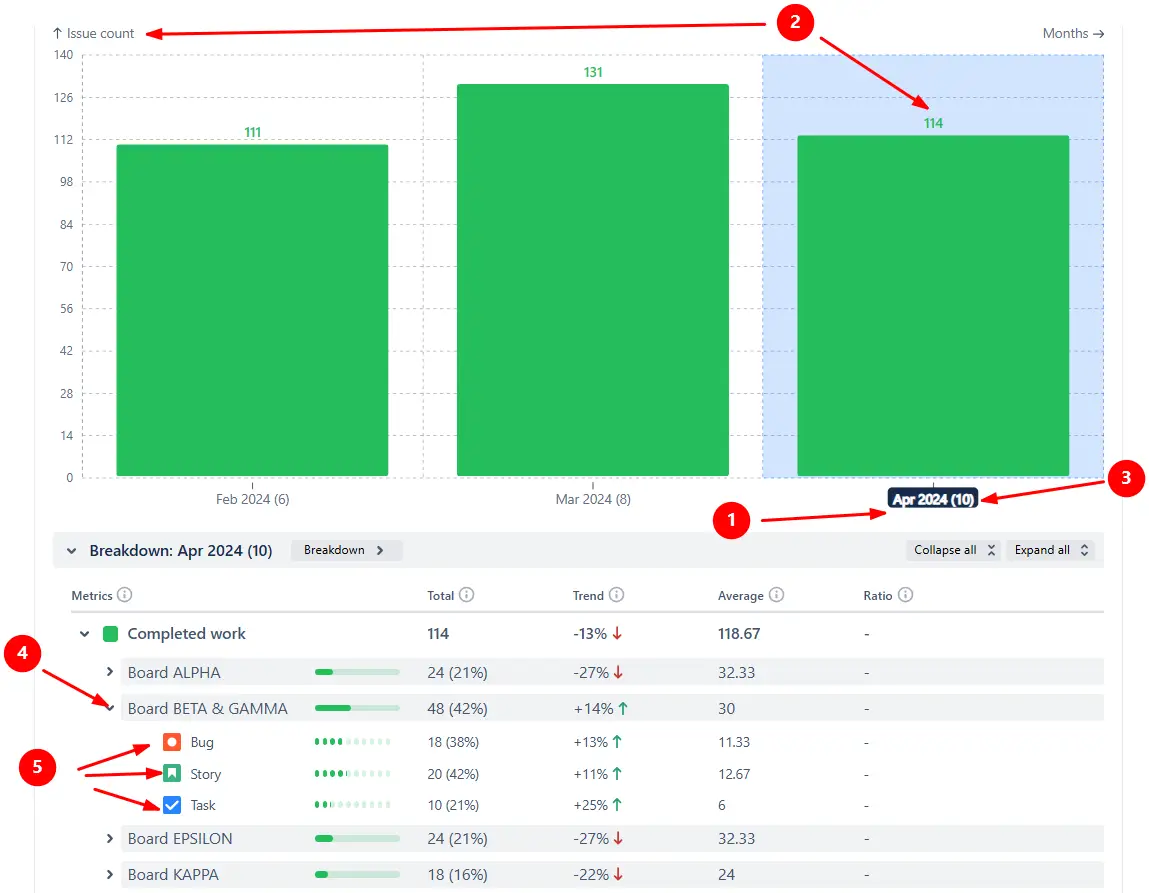
The “Multi-board throughput analysis” feature is helpful for:
Switch the Throughput graph to the Lines view (1️⃣) to make throughput trends easier to spot over time. Completed work can be visually compared against the average throughput (2️⃣), displayed as a horizontal line across the chart. You can configure how the average is calculated - either the mean across all sprints, the mean over a selected number of recent sprints, or the median (3️⃣).

The “Trend lines & averages” feature is helpful for:
Add target lines to the Throughput chart to visually track team or ART KPIs. You can customize the color of each line (for example, green, amber, and red to indicate good, average, and under target results) and assign meaningful names to make expectations clear.
The “Target lines” feature is helpful for:
Adapt the Throughput chart in Jira to your team’s processes by selecting a custom estimation field - such as issue count, effort, or any other field from your Jira instance. You can also configure what counts as completed work by choosing relevant statuses from the Done category (for example, Released or Dev Done).
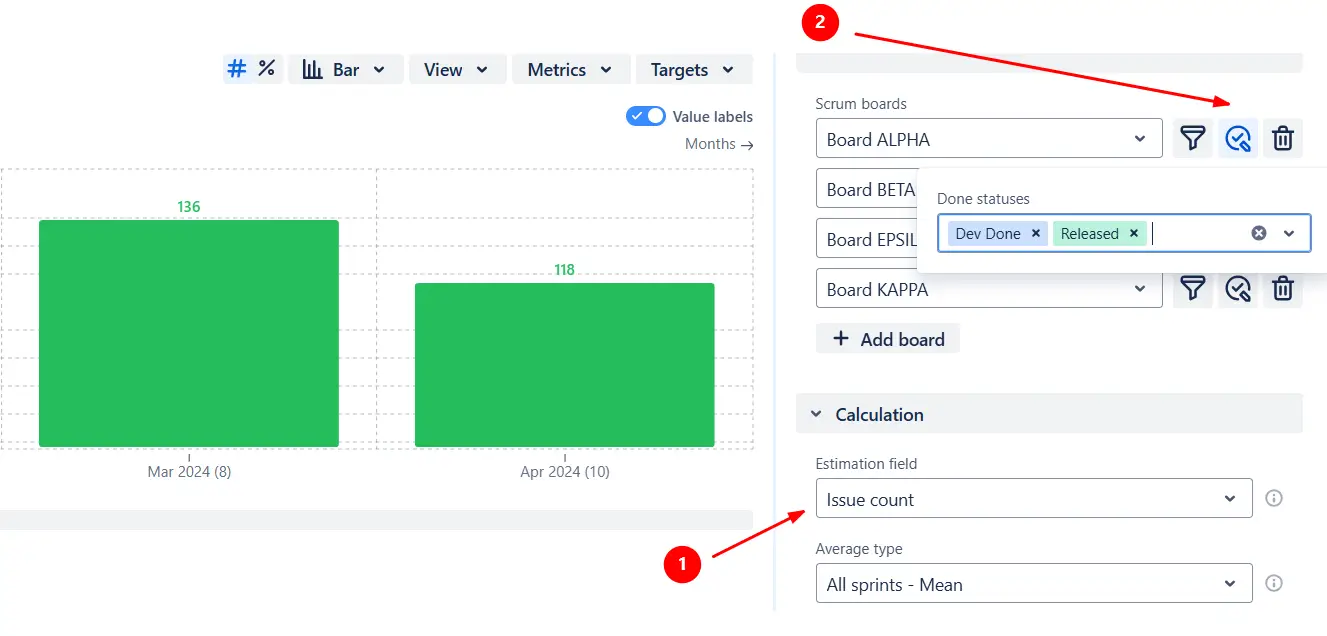
The “Custom estimation & done criteria” feature is helpful for:
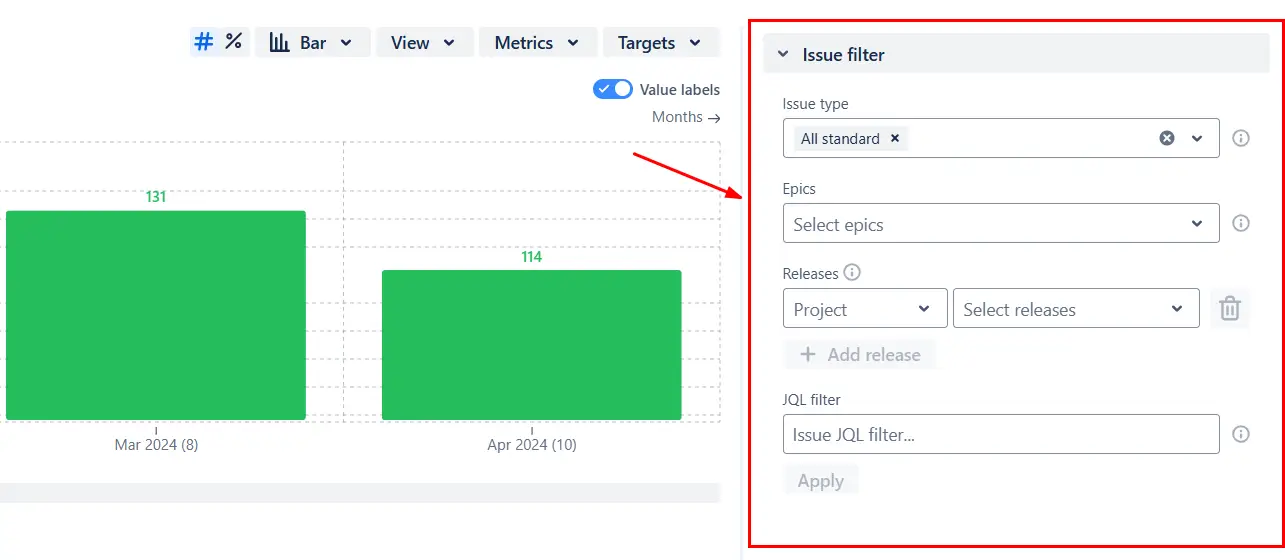
You can filter the issues by issue type, epic, release, or a custom JQL query to only focus on user stories or to analyze only work relevant to a specific Program Increment:
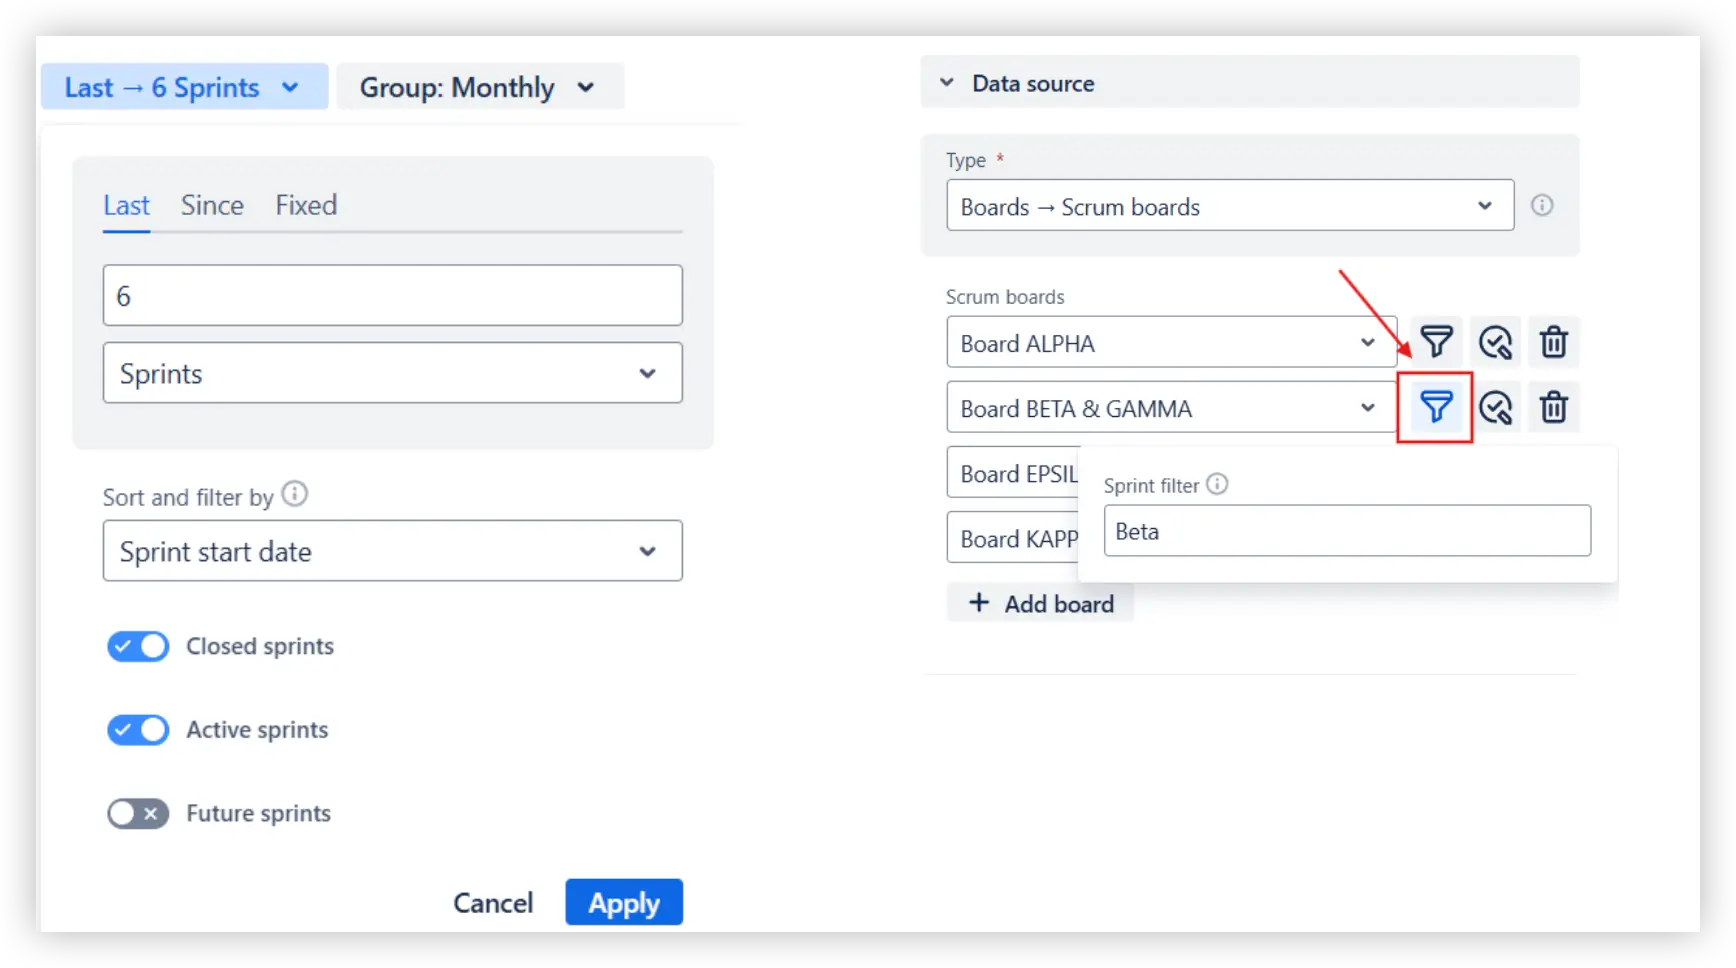
The Throughput chart also allows you to clean up reporting by configuring which sprints are displayed in the chart: choose how many sprints to show, include or exclude closed, active, or future sprints, or filter sprints by name:
Jira includes a basic Velocity Chart that shows a single team’s committed vs. completed work compared against a fixed average. While useful for a quick snapshot, it comes with significant limitations:
❌ Works with only one board - no multi-team or ART-wide view.
❌ Groups results by sprint only - no option for months or quarters.
❌ No breakdowns by custom fields such as issue type, status, or assignee.
❌ No flexibility to choose estimation fields or define what counts as done.
❌ No issue filtering (by epic, release, JQL, etc.).
❌ No sprint filtering or time period configuration.
❌ The average is not customizable.
❌ No KPI target lines.
These examples highlight how you can configure and display the chart directly on your Jira Dashboard.
Both Jira apps that power this functionality come with a 30-day free trial and stay free for small teams (up to 10 users):
With Agile Reports and Gadgets, you’ll also get access to the Throughput chart, together with a wide set of additional reports and analytics tools.
Throughput is classically defined as the number of work items a team completes in a given time period, regardless of their size. Some teams, however, prefer to measure throughput in story points or another estimation field to reflect effort. The Throughput chart supports both approaches by letting you select the estimation field that best matches your process.
Jira’s native Velocity Chart shows committed vs. completed work for a single team, but it’s limited to fixed metrics and one board. To get a full view of throughput, you can use the Agile Velocity Chart Gadget app by Broken Build. It lets you combine multiple boards, group results by sprint, month, or quarter, and customize estimation fields, done criteria, and filters to match your process.
You can create the Throughput chart from the app’s Getting started page using the default setup or one of the available templates, then save it as a gadget to a Jira dashboard of your choice. Alternatively, you can start directly from the dashboard where you want to display the chart and use the Add gadget button to add the Throughput report.
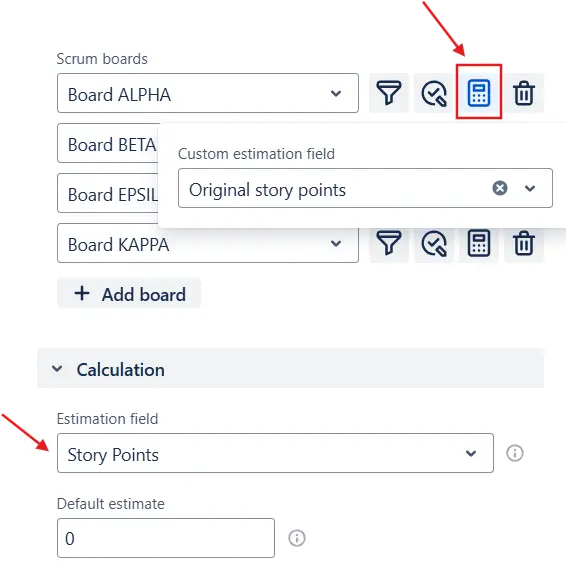
Yes. When you add multiple boards as the data source, you can use the calculator icon next to each board to set a custom estimation field. If you don’t configure it, the board inherits the general estimation field defined in the Calculation section.
Note: board-specific estimation fields are not available if the general estimation field is set to Issue count or Time spent and remaining time.
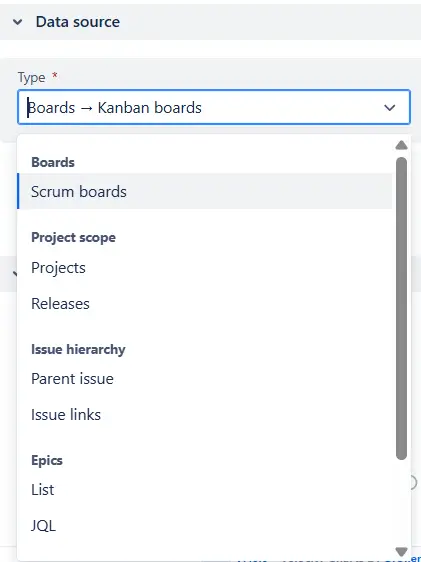
Yes. The Throughput chart works with multiple types of data sources, including Scrum boards, Kanban boards, projects, releases, Epics, and Initiatives. You can even use a custom JQL filter - for example, if one team works in Scrum and another in Kanban.


.svg)


.png)
.png)
