The interactive chart is available on larger screens
Please open this page on a desktop to try it out
Key features of Kanban throughput chart
Throughput is one of the most important Kanban metrics: it shows how much work your team delivers per interval and helps:
Identify bottlenecks or unstable delivery patterns
Improve forecasting accuracy
Support data-driven retrospectives and planning
Unlike native Jira, which does not have a Kanban throughput report, the Agile Velocity Chart Gadget app provides interactive, customizable insights - right on your dashboard.
How different roles useKanban throughput report
👨💻 Team Lead: Monitor delivery trends, identify dips in velocity, and use data in stand-ups and retrospectives.
📈 Project Manager: Track throughput across multiple boards to forecast delivery timelines and spot risks.
🧑🔧 Developer: Drill into work items per interval to analyze patterns, blockers, and hand-offs.
🏢 Stakeholder: Quickly check whether delivery is on track vs. set targets.
Identify bottlenecks or unstable delivery patterns with KANBAN THROUGHPUT CHART
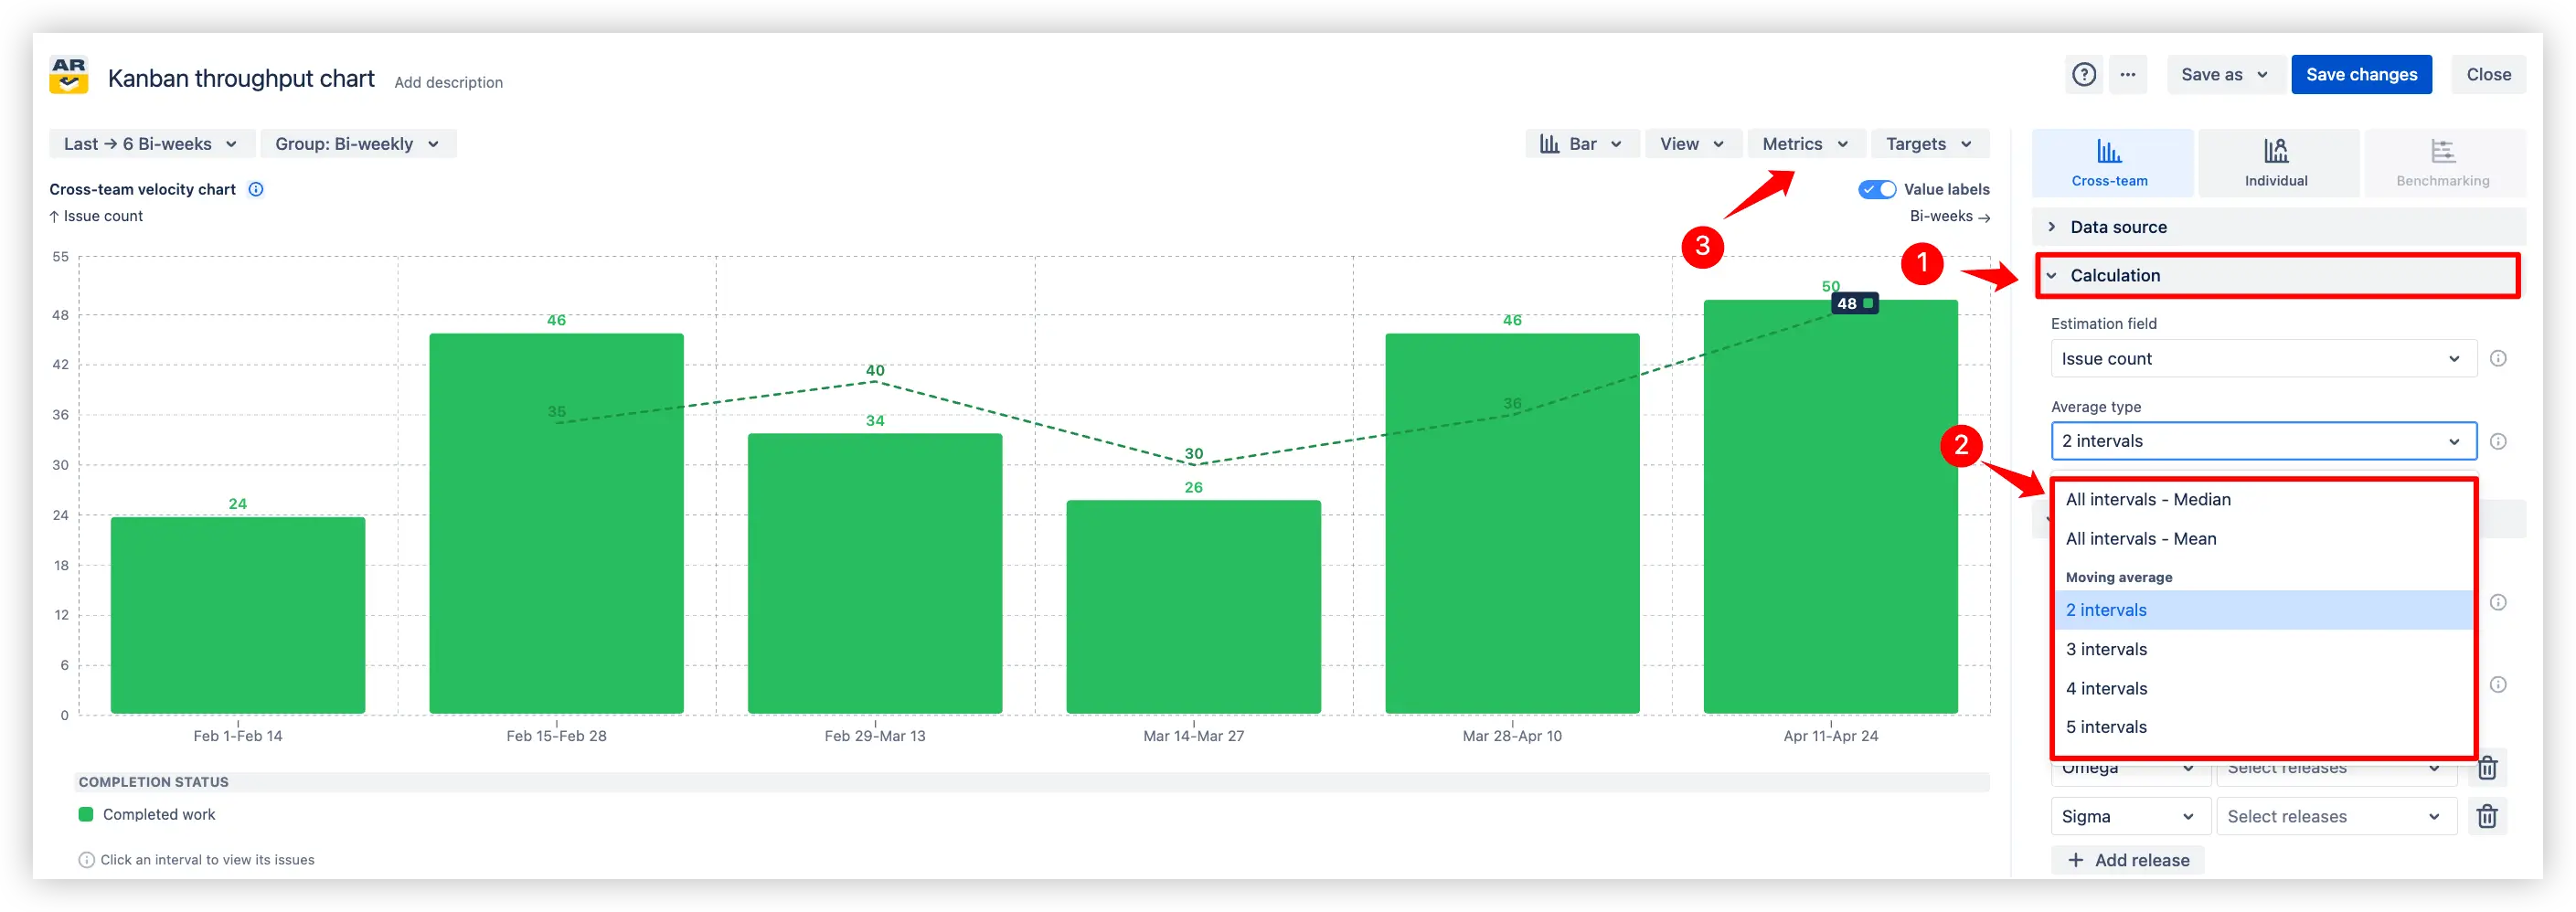
This chart includes a configurable average line to visualize your team’s long-term delivery trend.
Open the Calculation section in the settings to select an average type.
Choose from:
All intervals – Median
All intervals – Mean
2, 3, 4, or 5 intervals (moving average based on previous intervals)
The average line is enabled by default, but you can toggle its visibility in the Metrics section of the chart.
Use this feature to smooth out fluctuations, highlight actual delivery capacity, and improve throughput forecasting.
A configurable moving average line on Kanban throughput chart in Jira
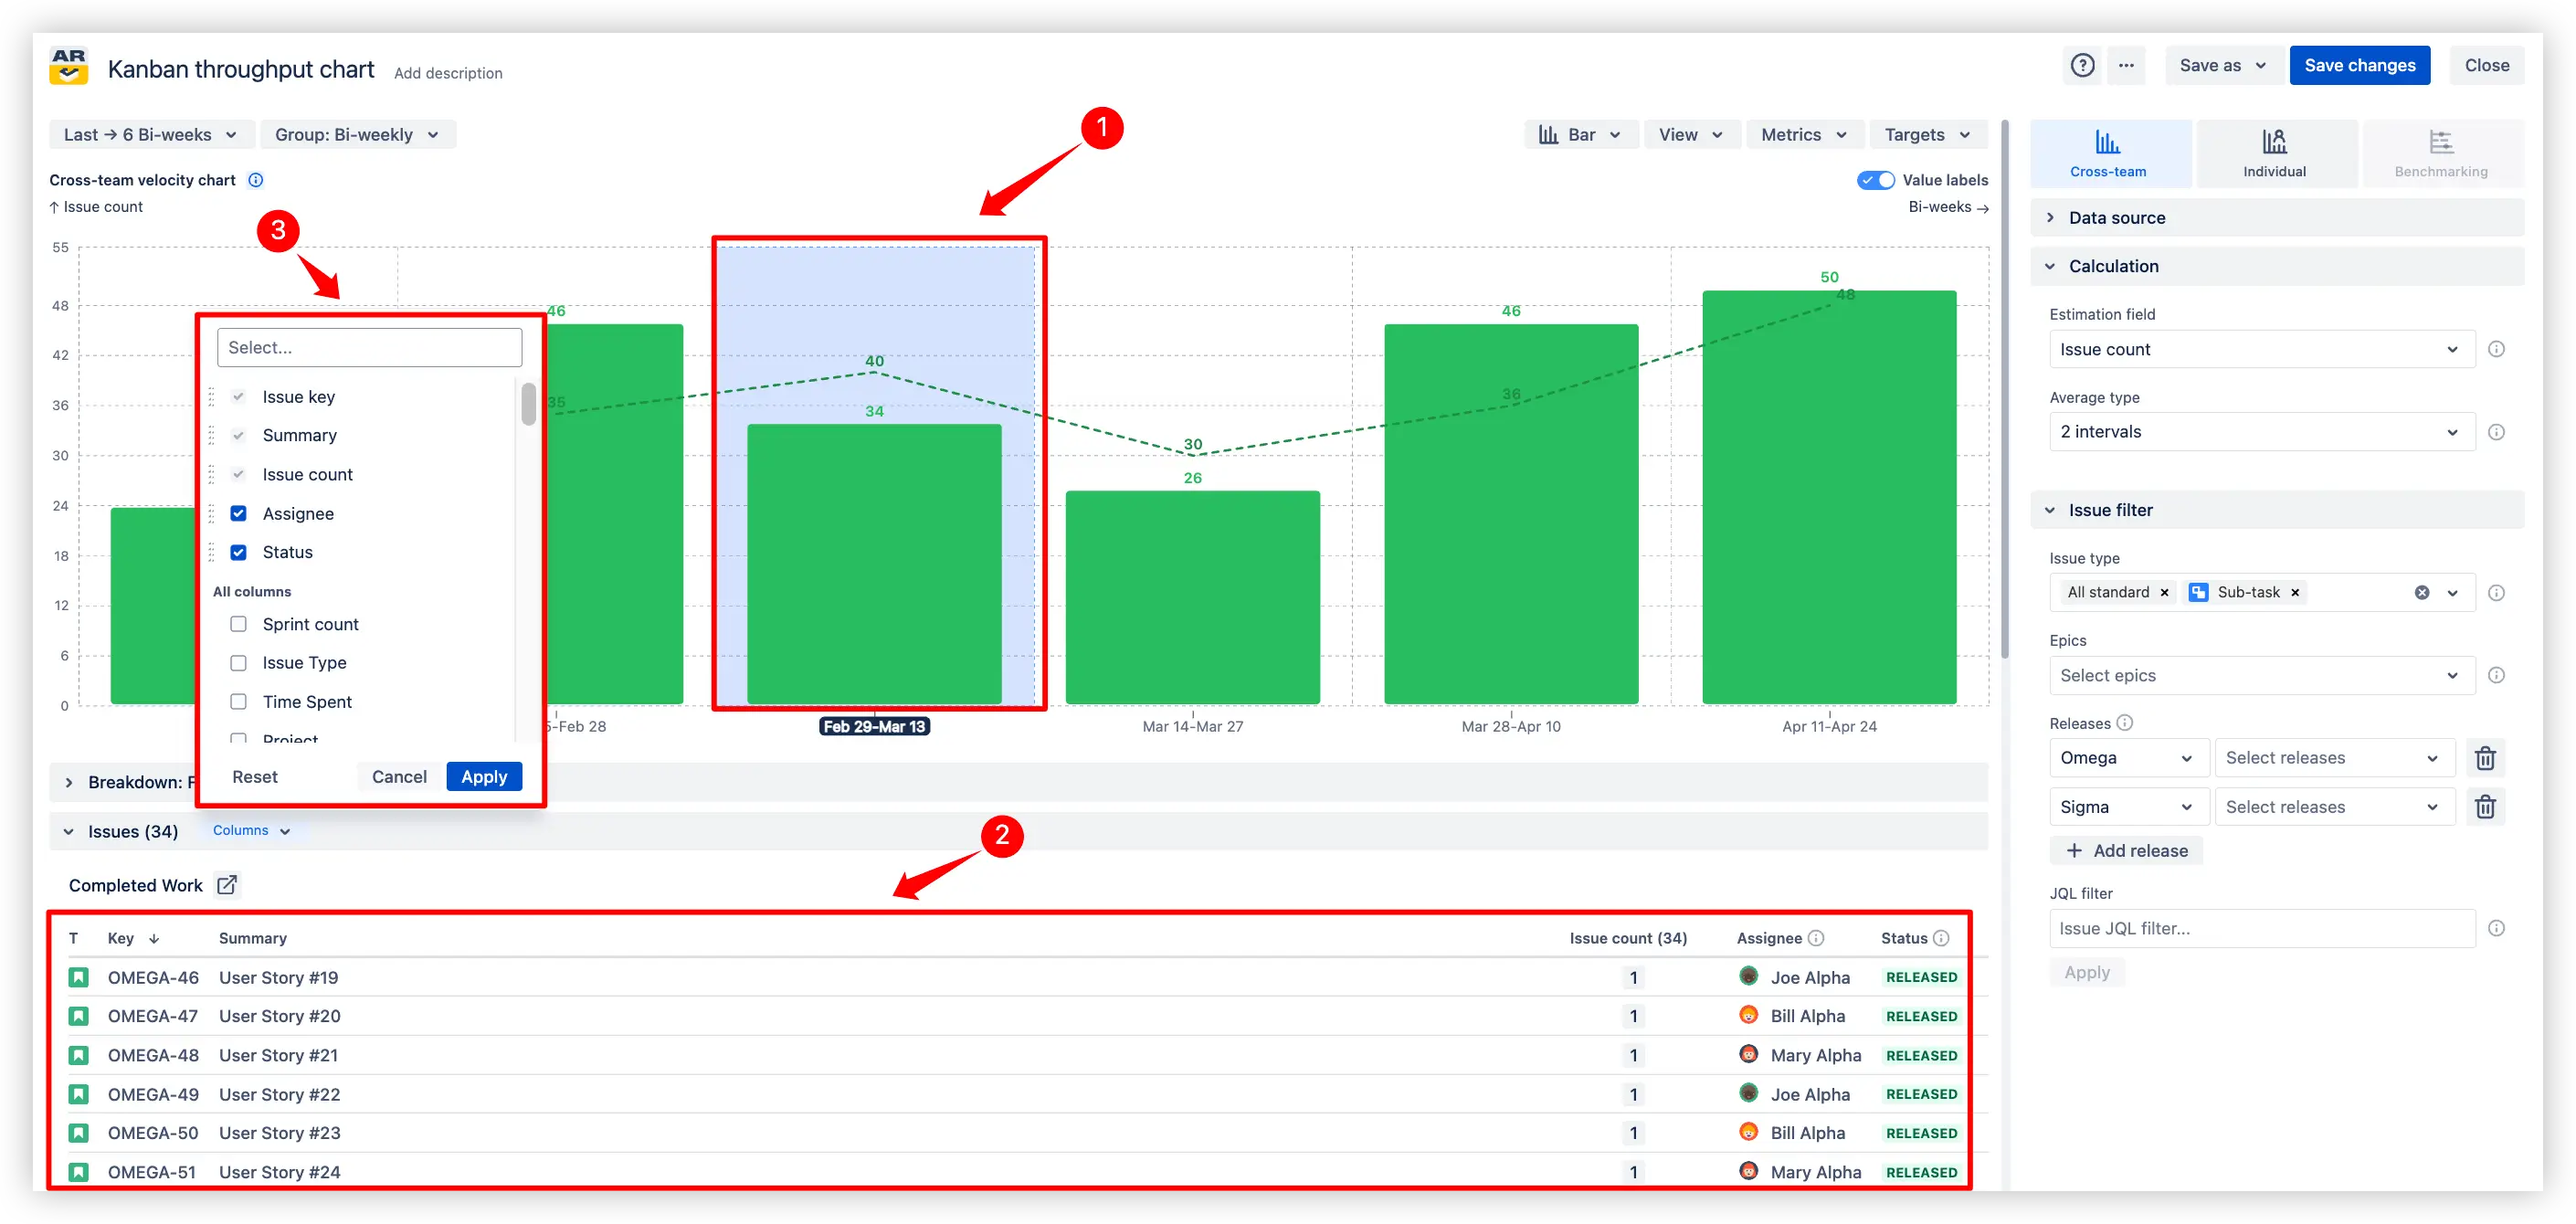
2. Key feature: Work item list
Each bar on the Kanban throughput report represents your team’s completed work for that interval. You can drill down into the details of any interval:
Click a bar on the chart to open the Work Item List.
Review all issues completed during that time period directly in a table view.
Customize visible columns by clicking the Columns button – a searchable checklist lets you display any field available in your Jira instance.
This feature helps you connect velocity numbers with real work items and supports deeper analysis during retrospectives or reviews.
Work item list kanban in Kanban throughput chart in Jira dashboard
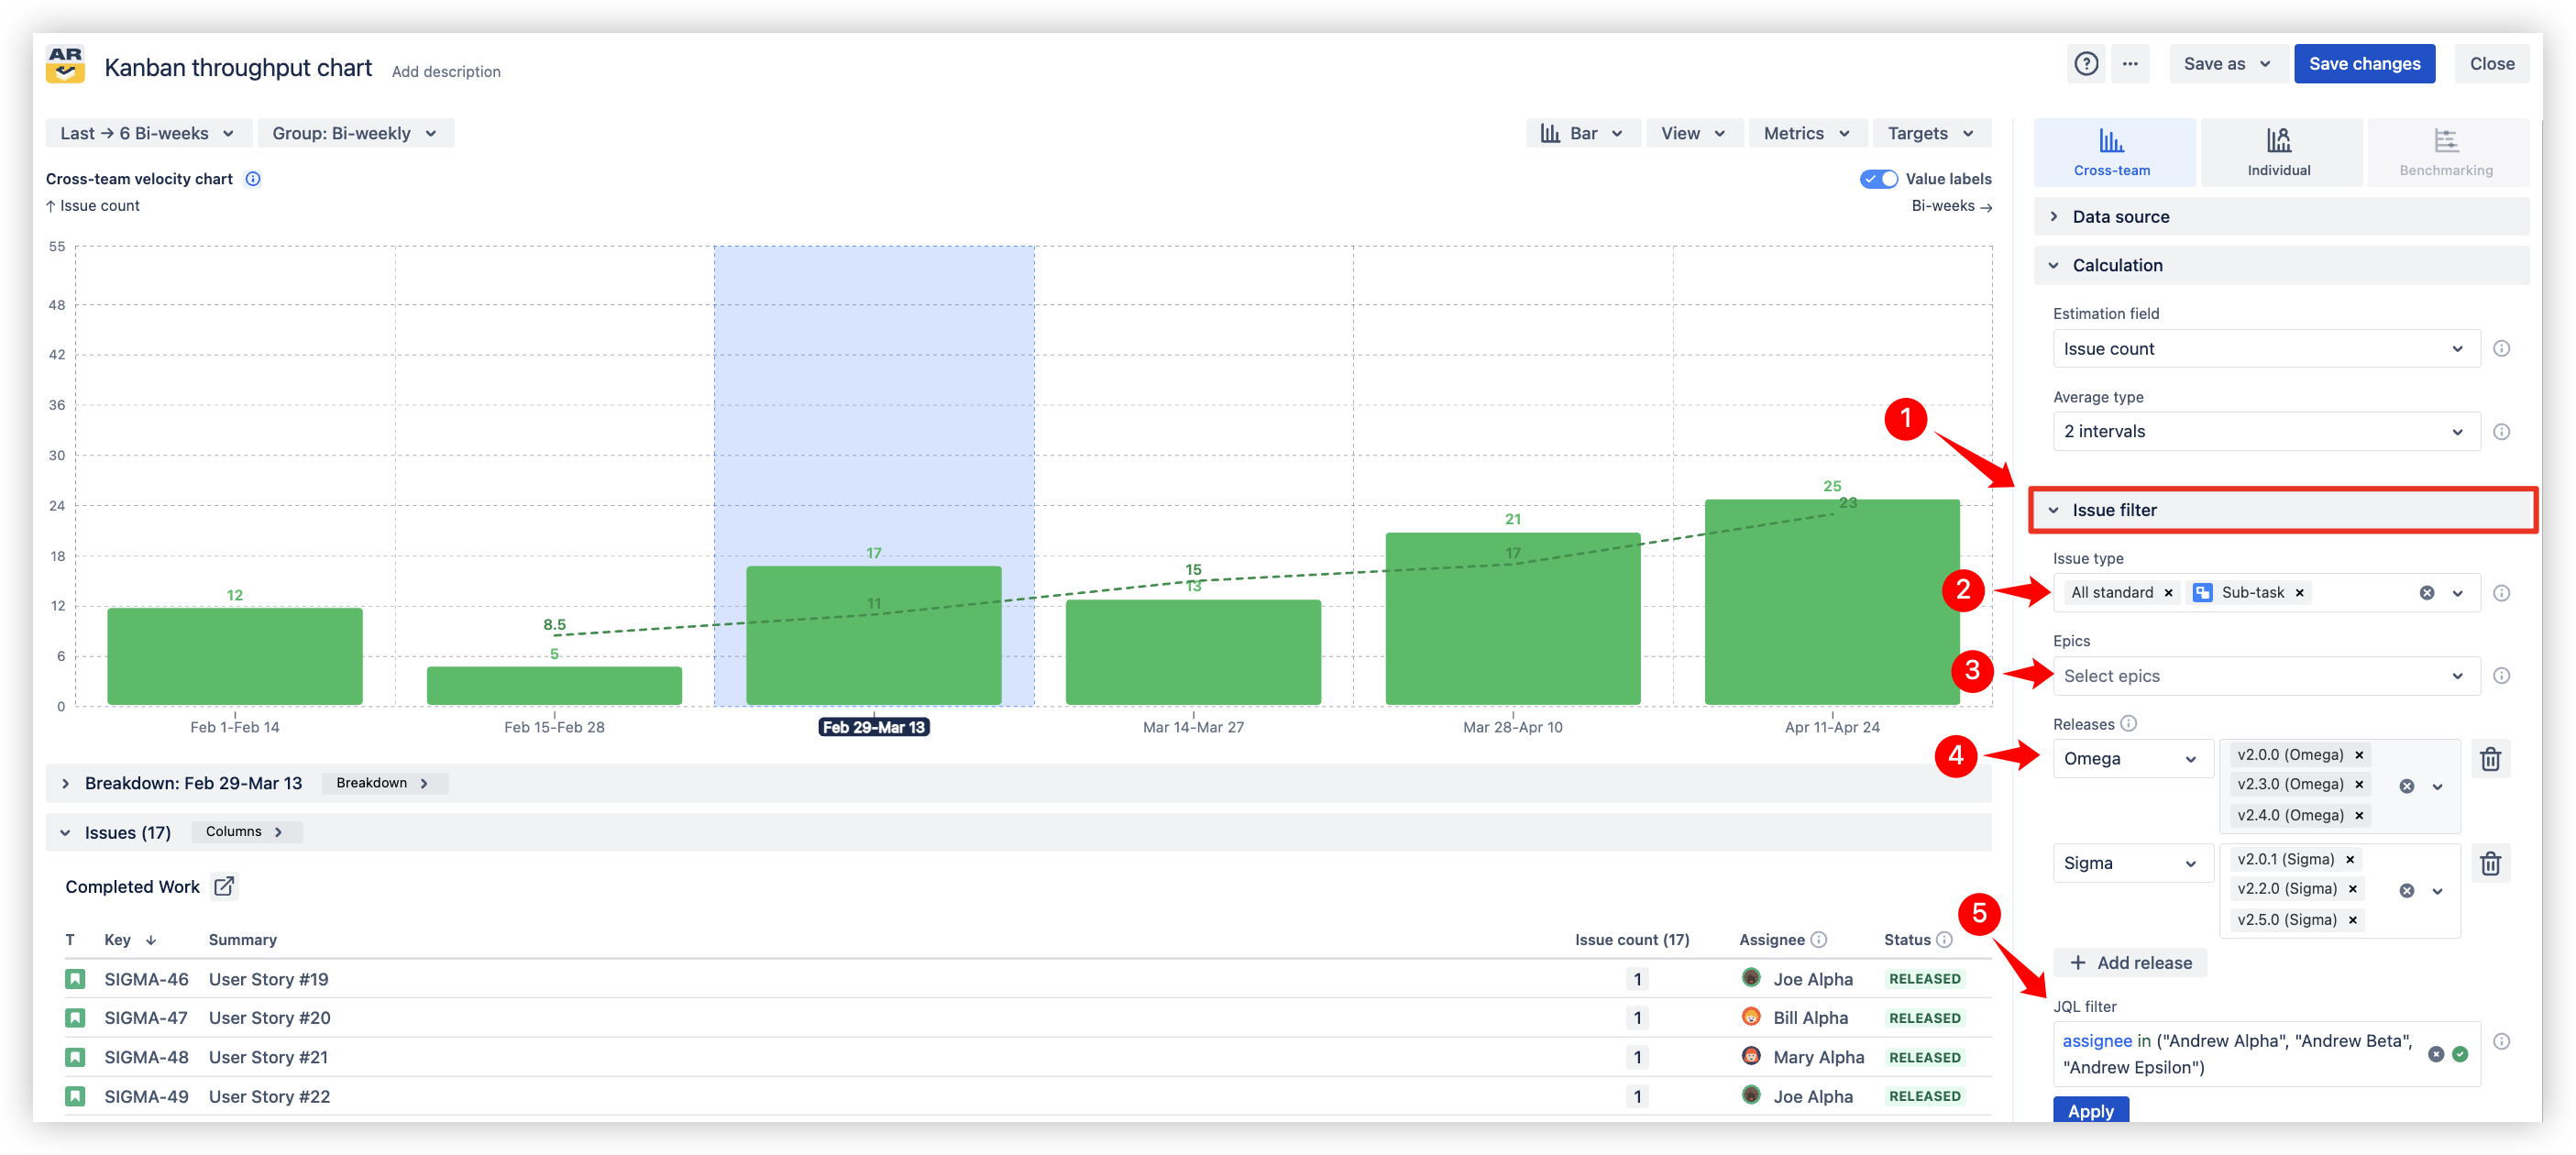
3. Key feature: Issue filter
Focus on exactly the issues of Kanban throughput you want to analyze with powerful, built-in filters:
Open the Issue Filter section in the settings after selecting a Kanban board.
Filter by issue type – choose specific types or entire groups (e.g., all standard issues, all sub-tasks).
Filter by epics – use a searchable multiselect to include only the relevant epics.
Filter by releases – select a project and choose releases to narrow down the scope.
For advanced cases, apply a custom JQL filter to get full control over the dataset.
These filters make it easy to focus on the work that matters and generate meaningful throughput insights.
Issue filter in Kanban throughput report in Jira
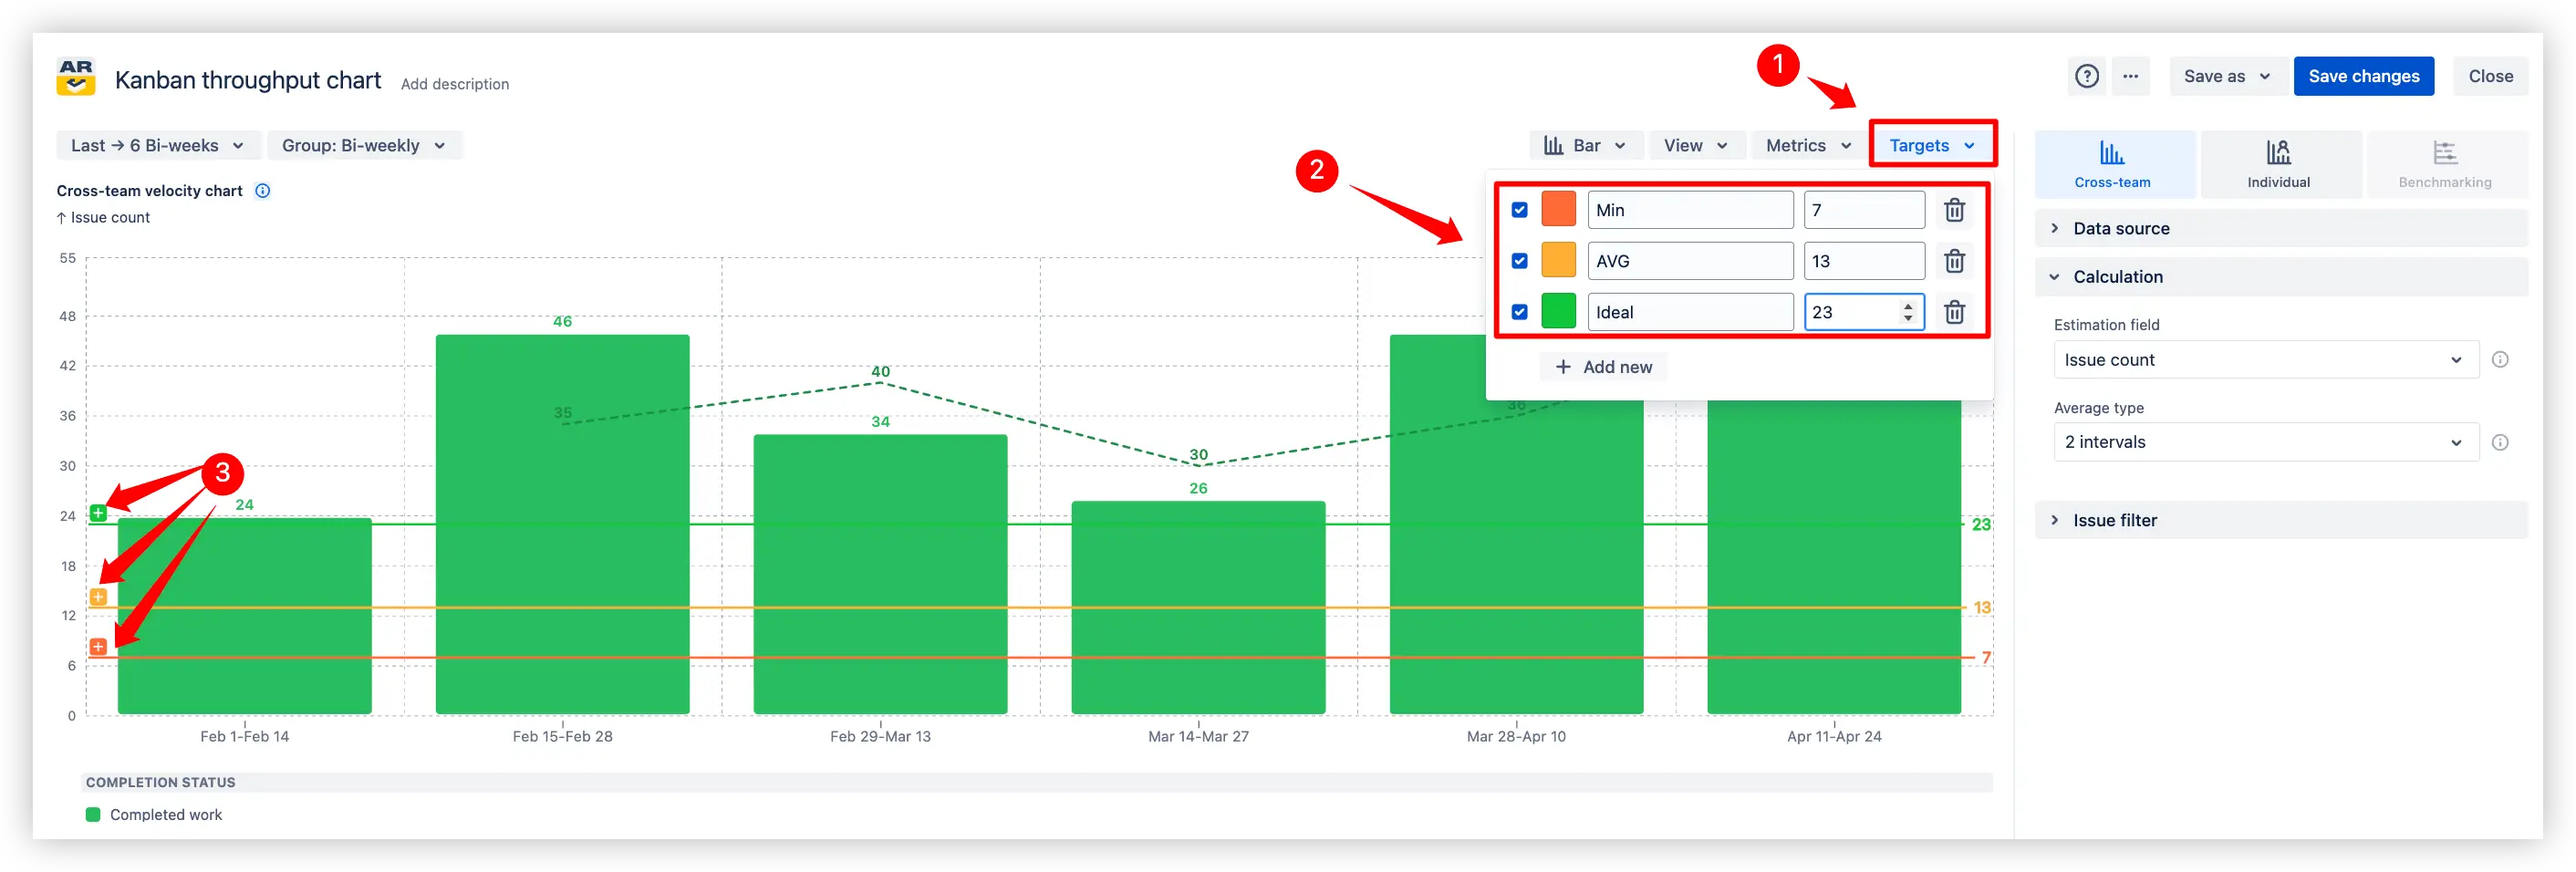
4. Key feature: Target lines
Track your goals directly on the Kanban throughput chart gadget with custom target lines:
Open the Targets section.
Add one or more target lines using the simple form.
Compare your current throughput against targets to see whether you’re on track or deviating from the plan.
This feature helps teams visualize performance expectations and stay aligned on delivery goals.
Target lines on Kanban throughput report in Jira dashboard
What about native Jira Kanban throughput report
Jira does not provide a built-in Kanban throughput report. Jira lets you see issue lists or some basic board statistics, but it doesn’t provide a chart that shows completed work over time, moving averages, or let you drill down into individual items.
Our gadget fills that gap by offering:
📊 Clear throughput visualization - see how much work was completed in each interval
🧠 Moving averages - identify trends and spot changes in team velocity
🎯 Targets - track progress directly on the chart
🗂 Detailed work item list - configurable columns let you inspect every completed issue
🎛 Advanced filters - filter by epics, releases, or custom JQL
With these features, the gadget provides a fully interactive, all-in-one solution for tracking Kanban delivery right on your Jira dashboard.
Advantages of using Kanban throughput report in Jira
The Kanban throughput graph in Jira offers powerful insights and advanced functionality that Jira does not provide natively. Key advantages include:
Complete visibility into team delivery – track completed work and monitor trends over time.
Moving averages – see true team capacity and forecast future delivery.
Custom targets – set goals and compare actual performance against them for better planning.
Detailed work item drill-down – click any interval to see exactly what was completed, with configurable columns.
Advanced filtering – filter by issue type, epics, releases, or JQL.
Cross-team and multi-board support – analyze throughput across multiple Kanban boards in a single chart.
Interactive and configurable – customize chart appearance, metrics, and settings to match your workflow.
Supports data-driven retrospectives – use real data to identify bottlenecks, adjust processes, and improve delivery.
Forecasting and planning – use historical throughput trends to plan work for upcoming intervals with confidence.
With these features, the Kanban throughput report turns raw Jira data into actionable insights that help teams deliver predictably and continuously improve.
With Agile Reports and Gadgets, you’ll also get access to the Kanban throughput chart, together with a wide set of additional reports and analytics tools.
Frequently Asked Questions
1. What is throughput in Kanban?
Throughput in Kanban is the number of work items completed within a specific time frame (for example, per day, week). It reflects the actual delivery pace of the team and helps assess how much value is being delivered over time. By tracking throughput, teams can:
Measure productivity in terms of completed tasks.
Identify trends and patterns in delivery speed.
Use historical data for more reliable planning and forecasting.
2. Can I use multiple Kanban boards in a single chart?
Yes! You can combine data from multiple boards to get a full picture of team or cross-team throughput.
3. Does the app offer a trial period?
Absolutely. There’s a 30-day free trial, and the app is free for teams of up to 10 users.


.svg)


.png)
.png)
