
Thank you! Your submission has been received!
Oops! Something went wrong while submitting the form.


The Epic Time in Status chart shows how long issues within an epic spend in different stages of your workflow, helping you identify bottlenecks and reduce delays. By grouping statuses into In Progress and Waiting categories, you can see where work is actively moving and where it’s being held up. Interactive breakdowns, trend views, KPI targets, and customizable work schedules make it easy to track performance over time and measure the impact of process changes.
Since Jira doesn’t offer a native Epic Time in Status chart, the Agile Cycle Time Chart app fills that gap, all inside your Jira Dashboard for clear visibility and control.
✅ Scrum Master: The Time in Status by Epics report helps me spot when issues are stuck in a particular status, investigate the underlying cause, and escalate blockers quickly. By monitoring trends in In Progress and Waiting groups, I can facilitate workflow improvements and keep delivery on track.
✅ Release Train Engineer (RTE): I use the epic-level Time in Status report to compare status patterns across multiple teams. If I see similar delays in different teams, I can address them during ART syncs and coordinate cross-team solutions to remove systemic blockers.
✅ C-Level Executive: I rely on time-in-status insights to make informed capacity decisions. For example, if testing stages consistently take longer than our targets, I may decide to allocate more QA resources or adjust delivery expectations for the epic.


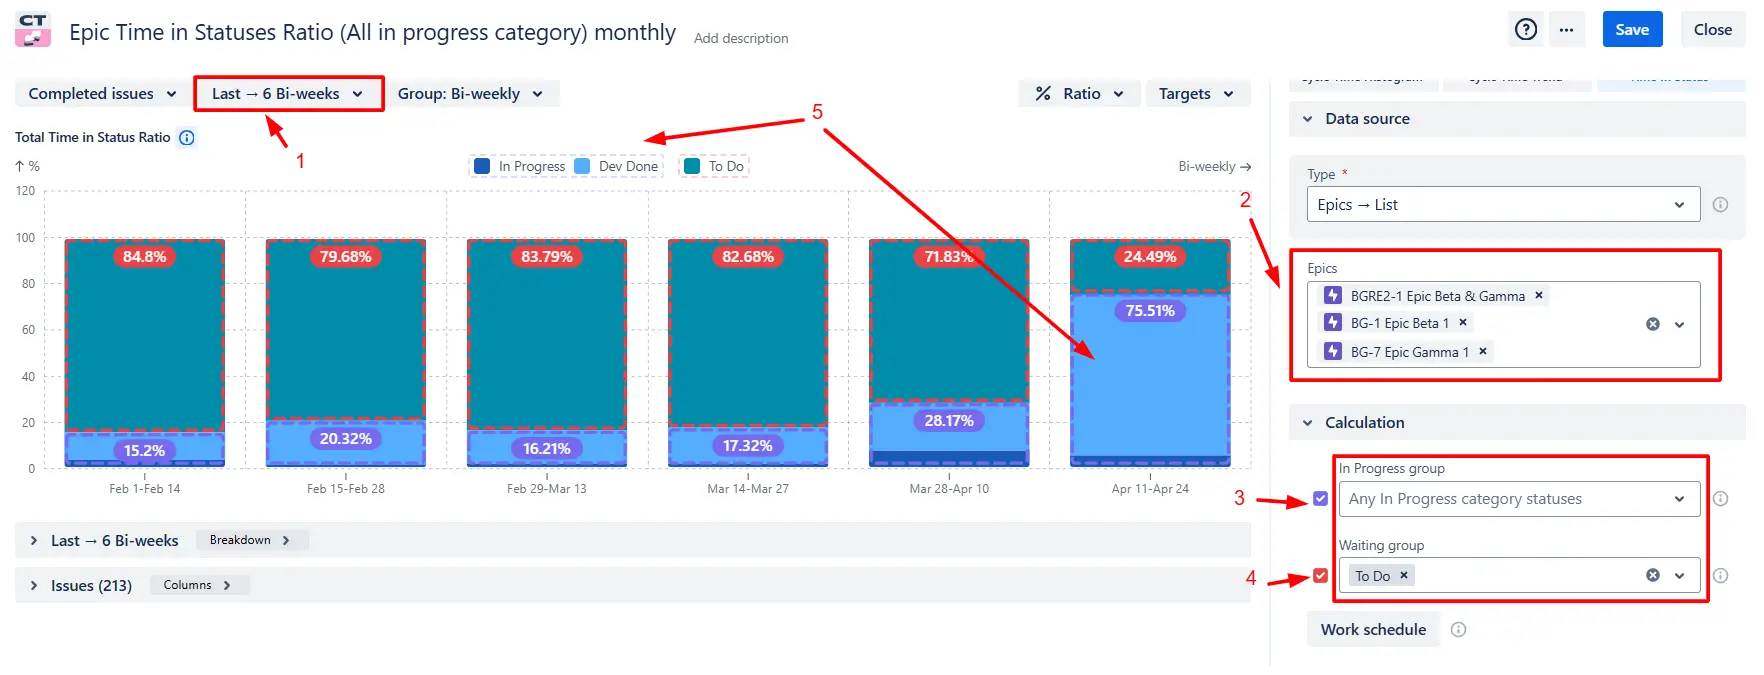
Track how work items move through statuses and spot if they’re getting stuck. The Epic Time in Status chart in Jira shows the percentage of time issues spend in different In Progress statuses, with the option to define exactly which statuses belong to the In Progress group. You can also create a custom Waiting group to monitor delays - for example, issues waiting for customer feedback.
✅ Why use it:
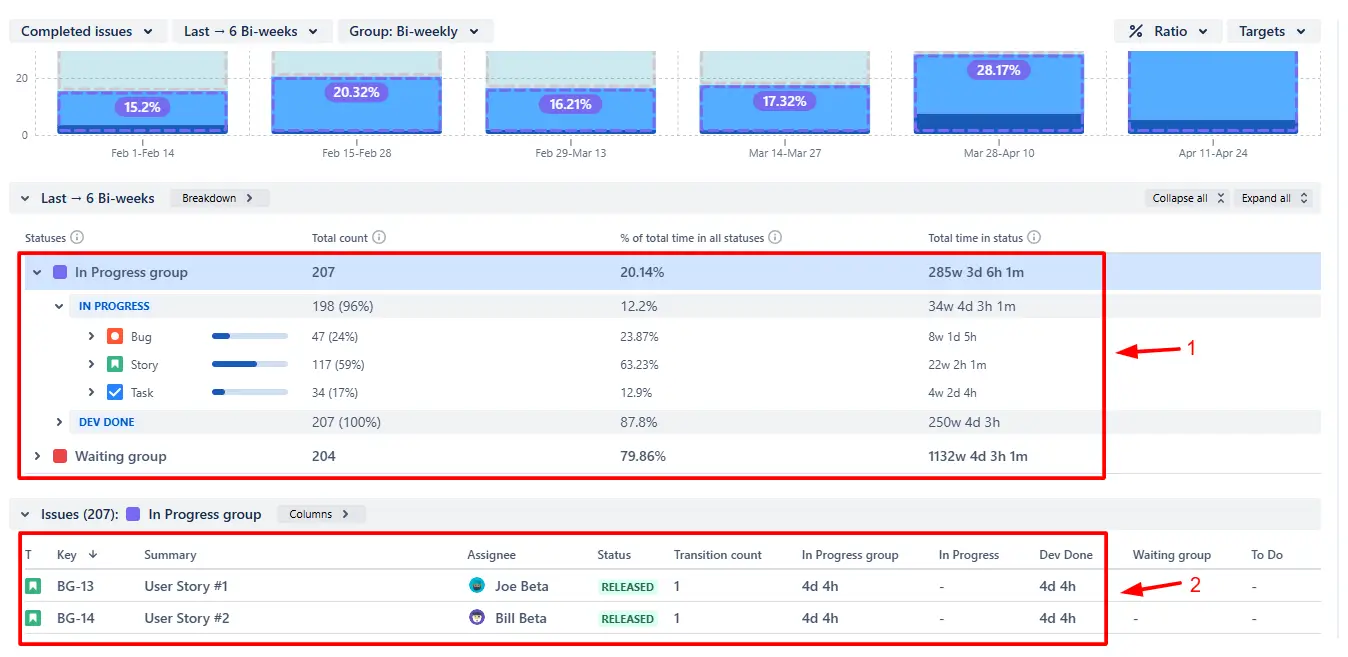
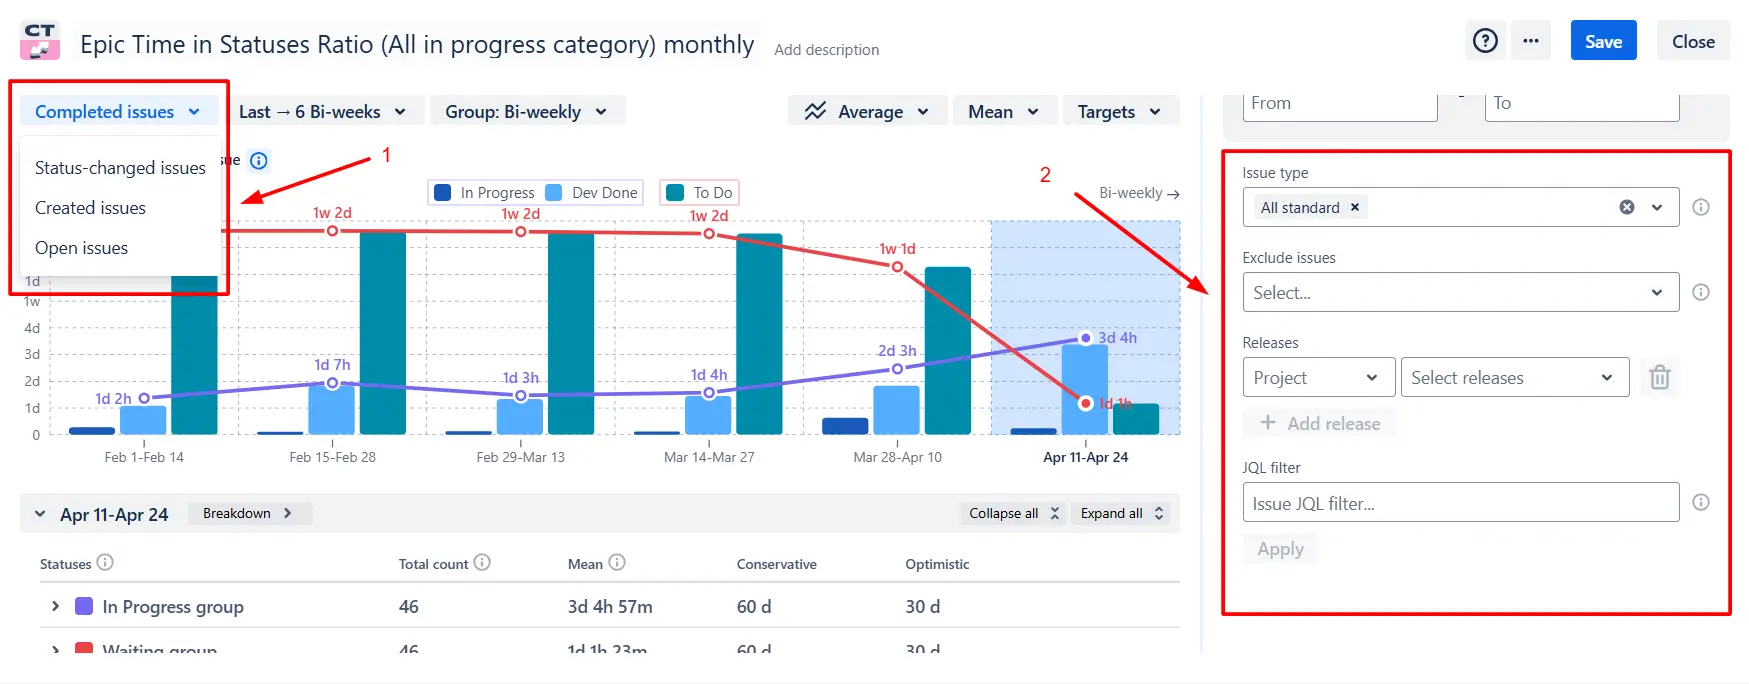
Click any time period on the chart to see a detailed breakdown for the In Progress and Waiting groups (1️⃣). Issues are grouped by status, and you can select two more nested levels for deeper analysis: issue type, assignee, or any other meaningful Jira field. You can then go to the issue list, where each item links to its Jira ticket (2️⃣).
✅ Why use it:
Switch to the Average view (1️⃣) to see how much time issues spend in each status group over time. You can choose the statistical measure - mean, median, or a specific percentile (2️⃣) - to match your analysis needs.
✅ Why use it:
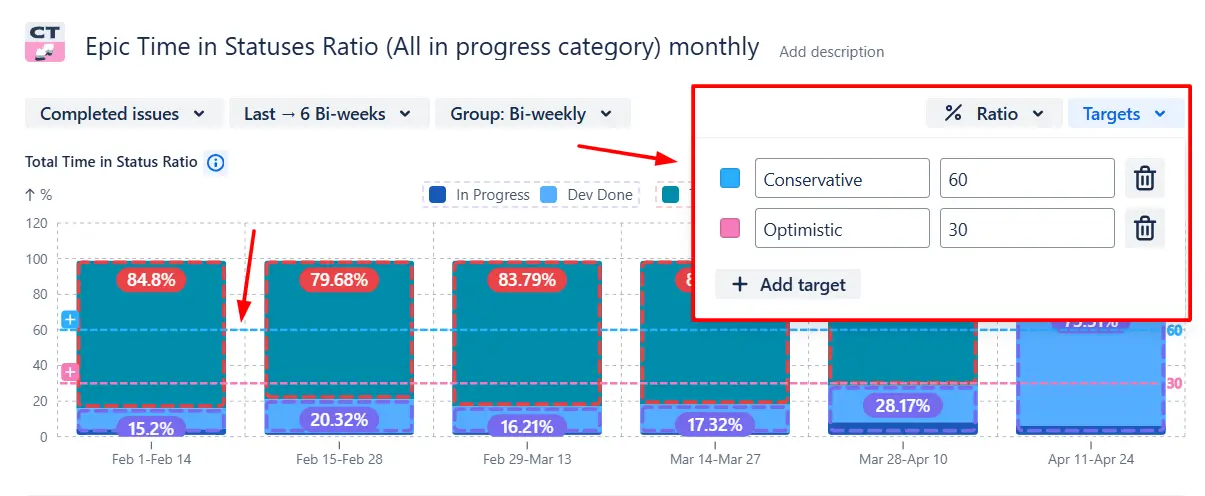
Add target lines to the chart (for example, 30% and 60%) to compare actual time spent in a status group against your desired threshold. This makes it easier to track KPIs and monitor the impact of process changes.
✅ Why use it:
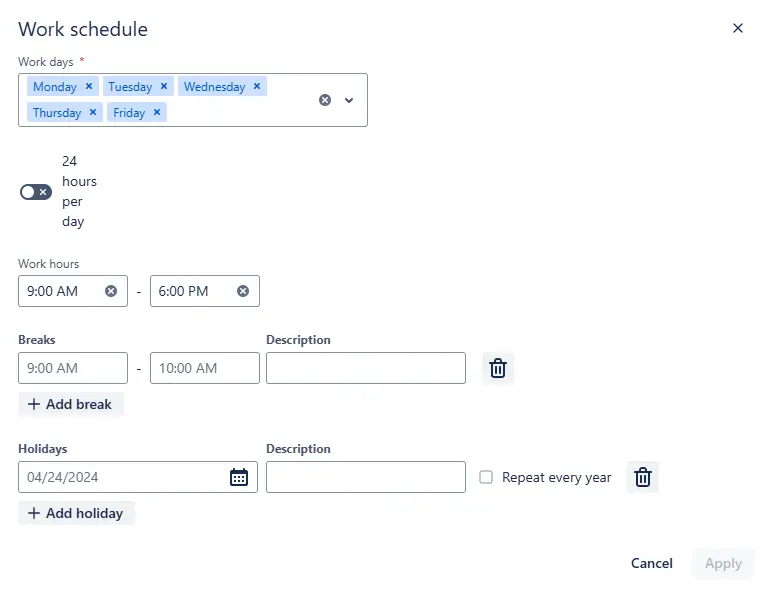
The Epic Time in Status chart measures time in status based on your defined work schedule. You can set the number of working days, working hours, breaks, and holidays to ensure calculations match your team’s actual availability.
✅ Why use it:
Jira doesn’t offer a native Time in Status report. With Jira’s built-in reports, you can’t:
❌ See how much time issues spend in specific statuses.
❌ Track workflow performance for any scope (project, board, epic, initiative).
❌ View trends showing how the workflow changes over time.
❌ Drill down into issues by status to identify problem areas.
❌ Compare actual workflow performance against a target.
Explore these examples to create your own use cases directly on the Jira Dashboard.
Both Jira apps highlighted here come with a 30-day free trial and remain free for teams of up to 10 users:
The Agile Reports and Gadgets app also offers Epic Time in Status chart functionality, along with many other useful reports and charts.
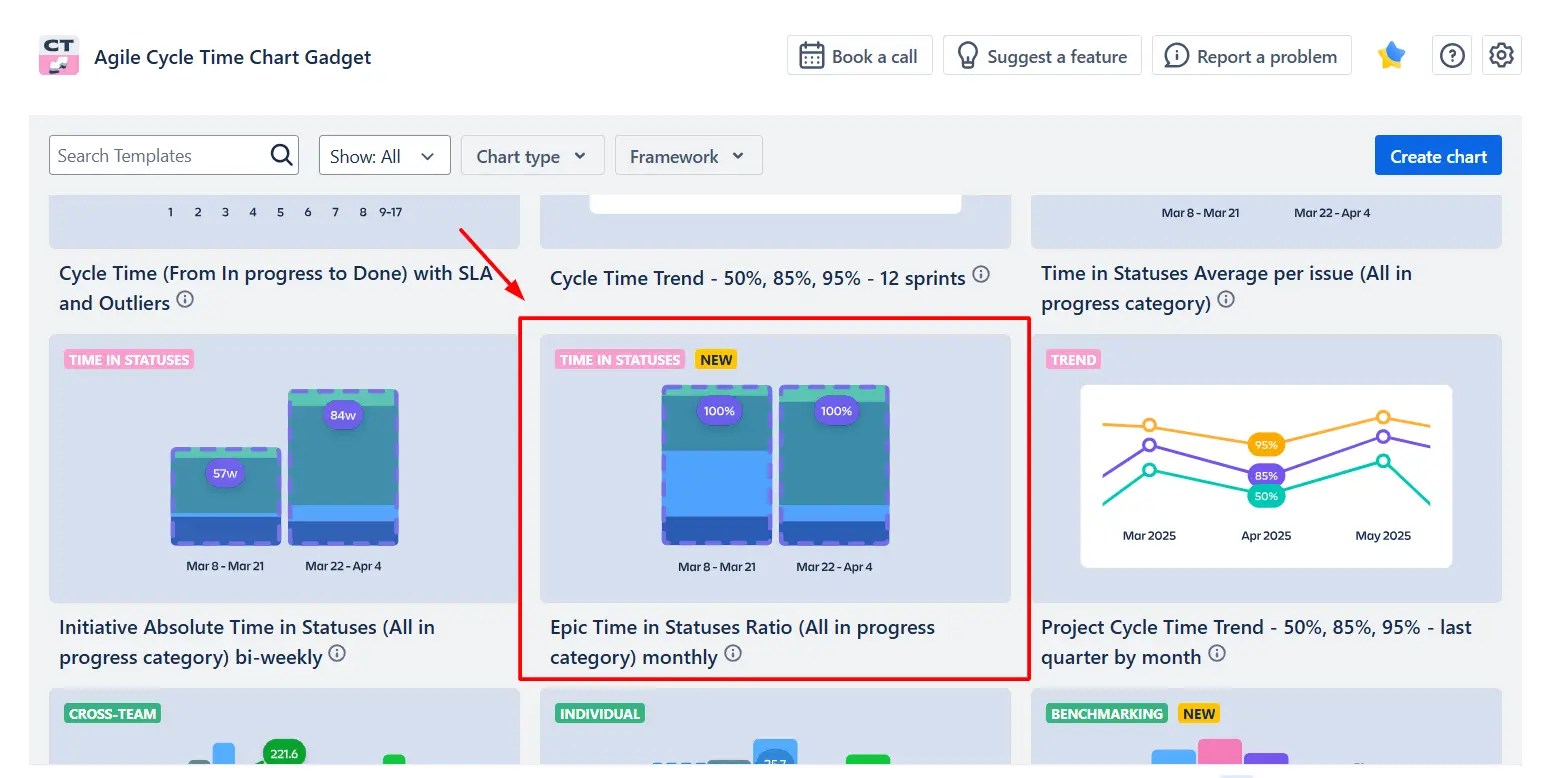
Jira doesn’t include Epic Time in Status reporting, but you can create one with the Agile Cycle Time Chart app by Broken Build. Open the Epic Time in Statuses Ratio (All In Progress category) – monthly template, select the epics you want to track, and configure the settings - such as custom status groups, time period, and filters.
By default, the Epic Time in Status chart in Jira dashboard only displays statuses from the In Progress group. If you configure a Waiting group, you can include any statuses from your Jira workflows that make sense for your process - for example, To Do, Blocked, or Waiting for Customer.
Yes. The Epic Time in Status report lets you select any number of epics as your data source and view them together in one report. You can also choose other scopes, such as projects, boards, initiatives, or apply a custom JQL filter.
Select completed, open, created, or status-changed issues (1️⃣). You can also use the Issue filter (2️⃣) to include or exclude issues based on the estimation field, release, issue type, or by applying a custom JQL query:


.svg)


.png)
