The interactive chart is available on larger screens
Please open this page on a desktop to try it out
Key features of the Cross-team burnup chart
The Cross-team burnup chart is a powerful tool for advanced users who want to be at the forefront and maintain complete visibility into team progress. It offers a robust set of features to help you build your ideal chart, including: auto-calculated forecasts based on historical performance; unlimited custom forecasts, configurable by date, velocity, percentile, or Monte Carlo simulations, you can use any combination that suits your needs; flexible work scope selection, with the ability to drill down using breakdowns by both default and custom fields.
Get a comprehensive view of your work with the Agile Burnup Burndown Chart, which includes the Cross-team burnup chart as one of its most powerful components.
How different roles use Cross-team burnup report
🎯Scrum master: Tracking progress has never been easier. I can spot delays before they become real problems.
🚀Product manager: This strong tool helps me to plan work based on historical progress and avoid costly mistakes.
⚙️ Team lead: I get a clear overview of how my team's efforts align with the bigger picture — it's easy to drill down into the details when needed.
Track progress and forecast work with the Cross-team burnup chart
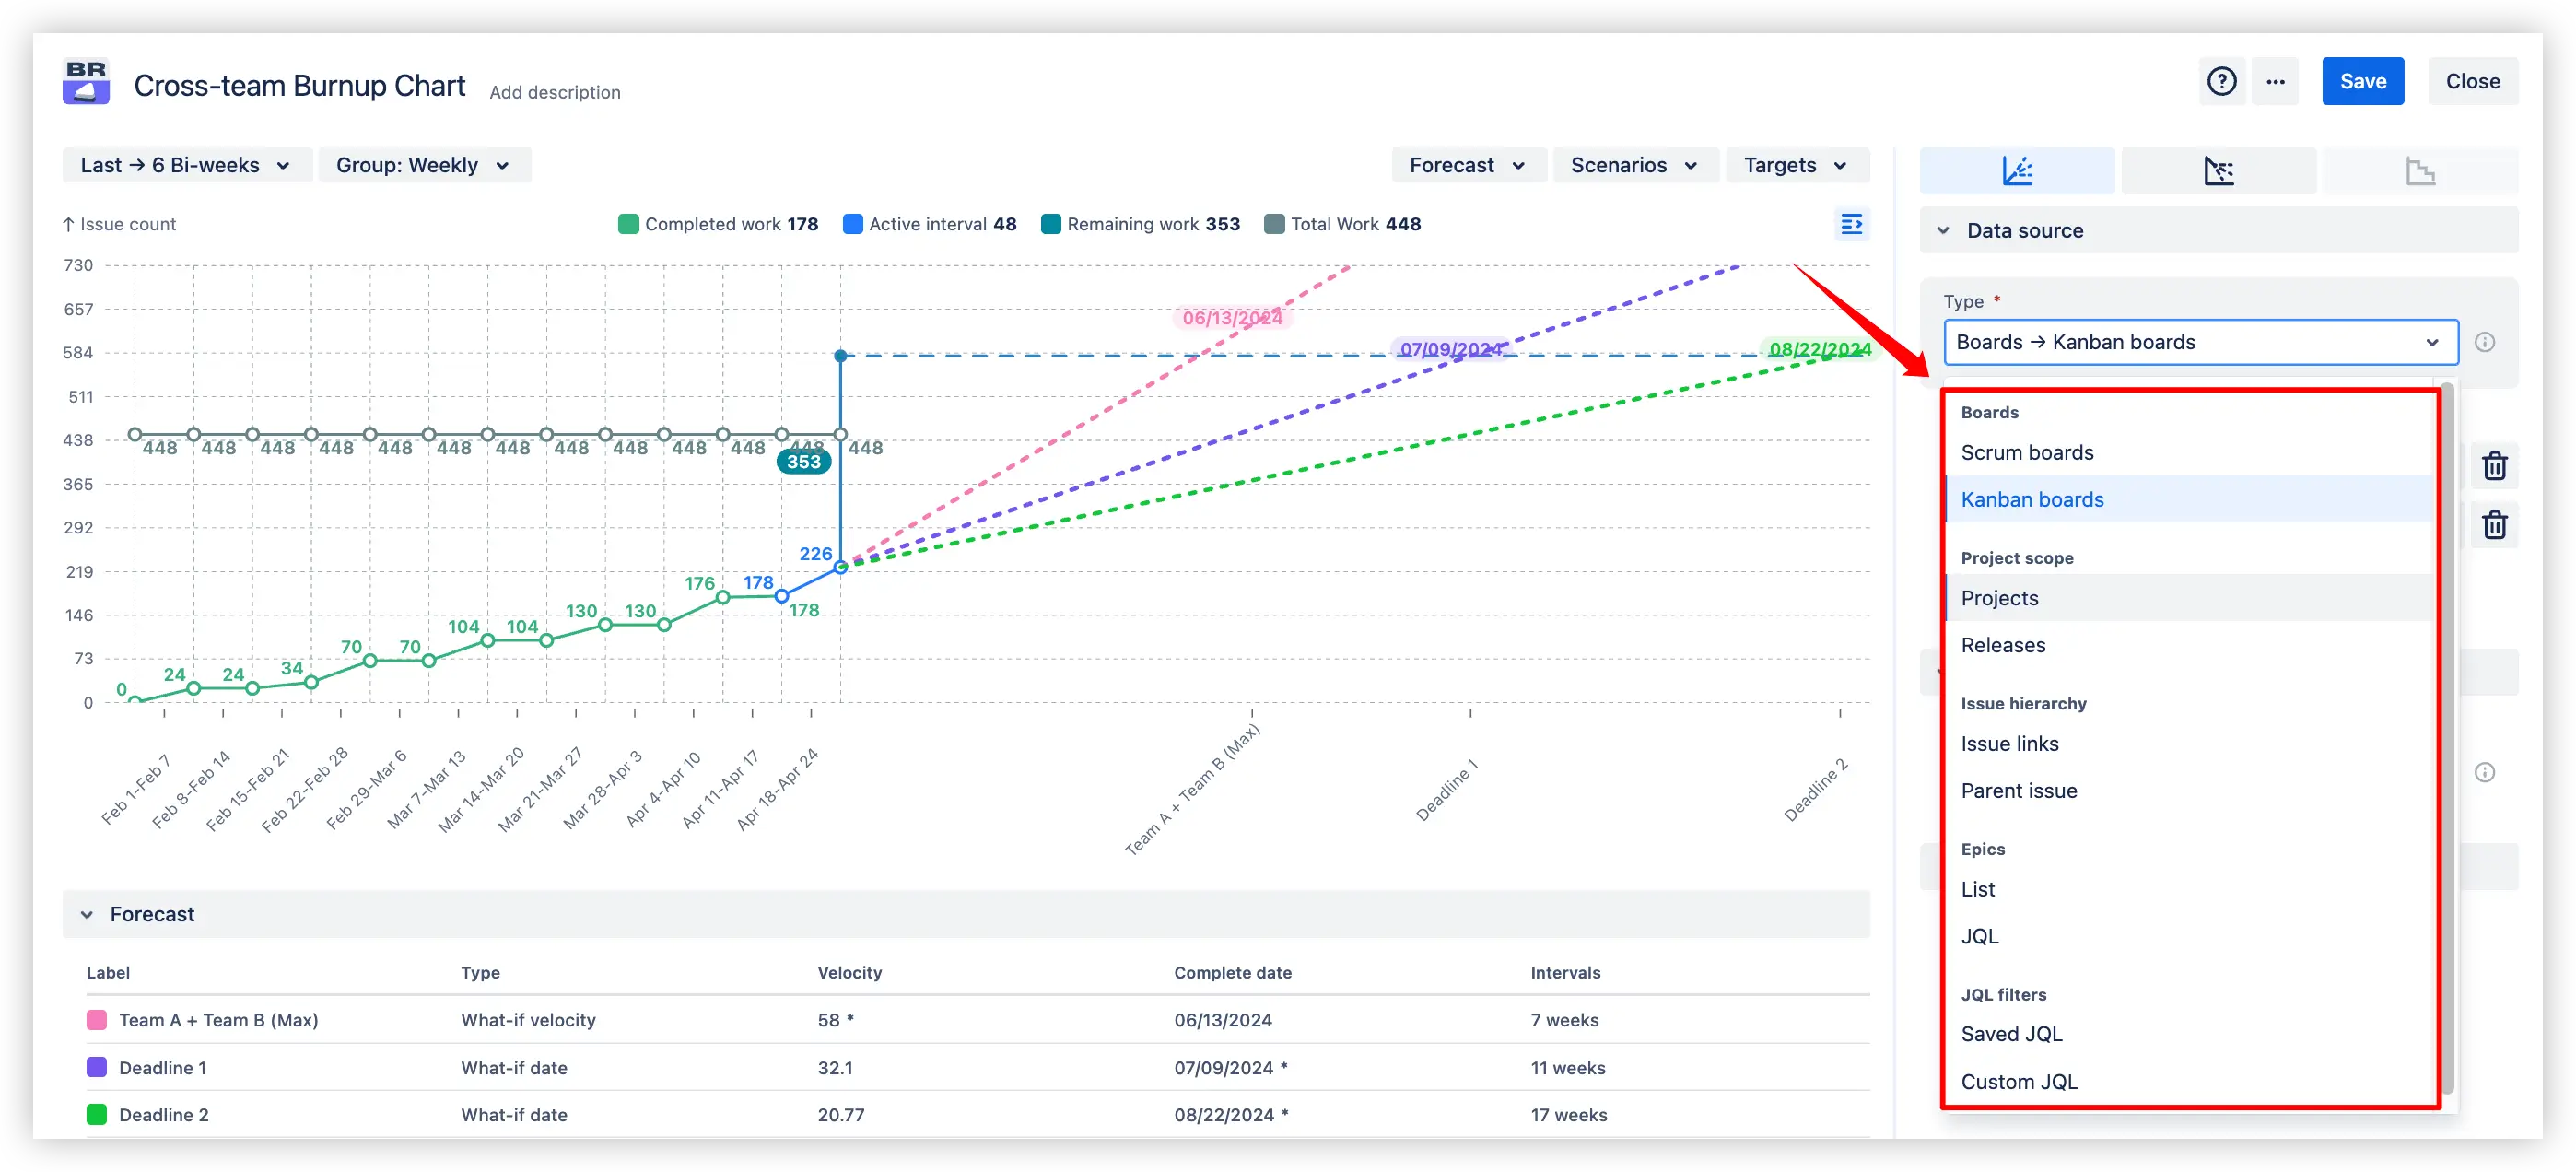
Define any work scope you need to track. The Cross-team burnup chart in Jira dashboard supports many built-in data sources for convenience, such as:
Scrum boards
Kanban boards
Projects
Releases
Issue links (issue hierarchy)
Parent issue (issue hierarchy)
Epic list
Epic JQL
Saved JQL filter
Additionally, the app allows you to set up your own Custom JQL to identify a specific work scope.
Advanced data sources in the Cross-team burnup report in Jira
2. Key feature: Two-level breakdown
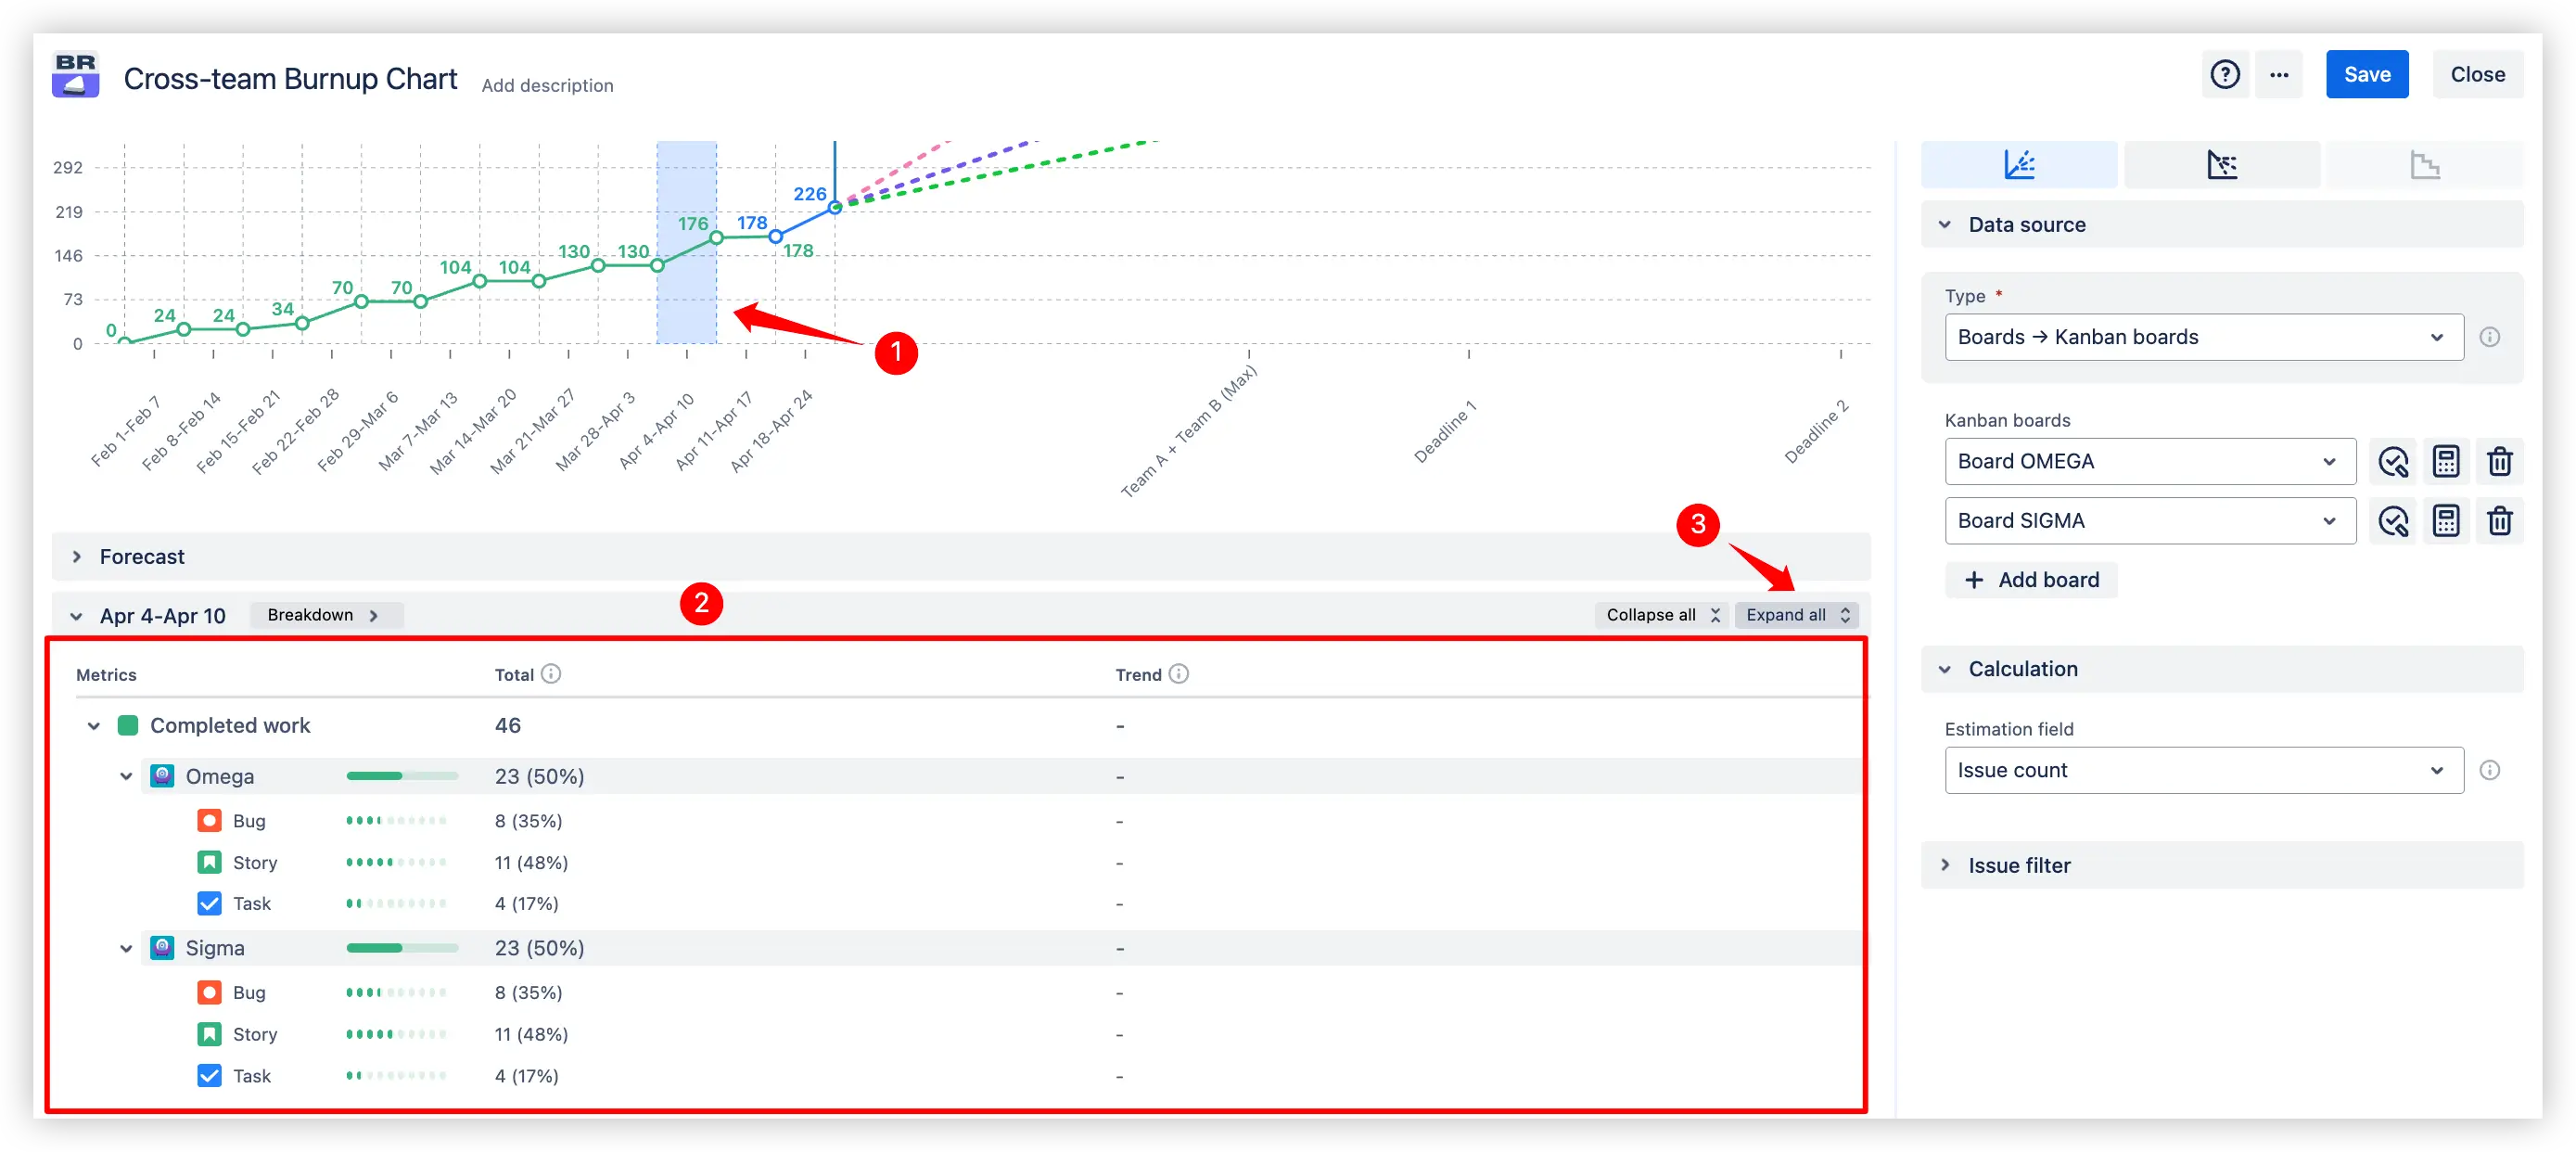
The Two-level breakdown section allows you to explore “Completed work” and “Scope changes” for any interval on the chart.
You can break down the data by any Jira field you have, including built-in fields such as status, assignee, project, or even custom fields. It gives you complete flexibility in how you analyze your progress.
⚙️ How it works:
Select any interval on the multi-team burnup chart.
A collapsed breakdown section will appear below the chart (1️⃣).
Click on it (2️⃣) to expand the interval.
Then hit the "Expand all" button (3️⃣) to reveal a full breakdown, grouped by the selected field.
Interval selection with breakdown on the Jira dashboard
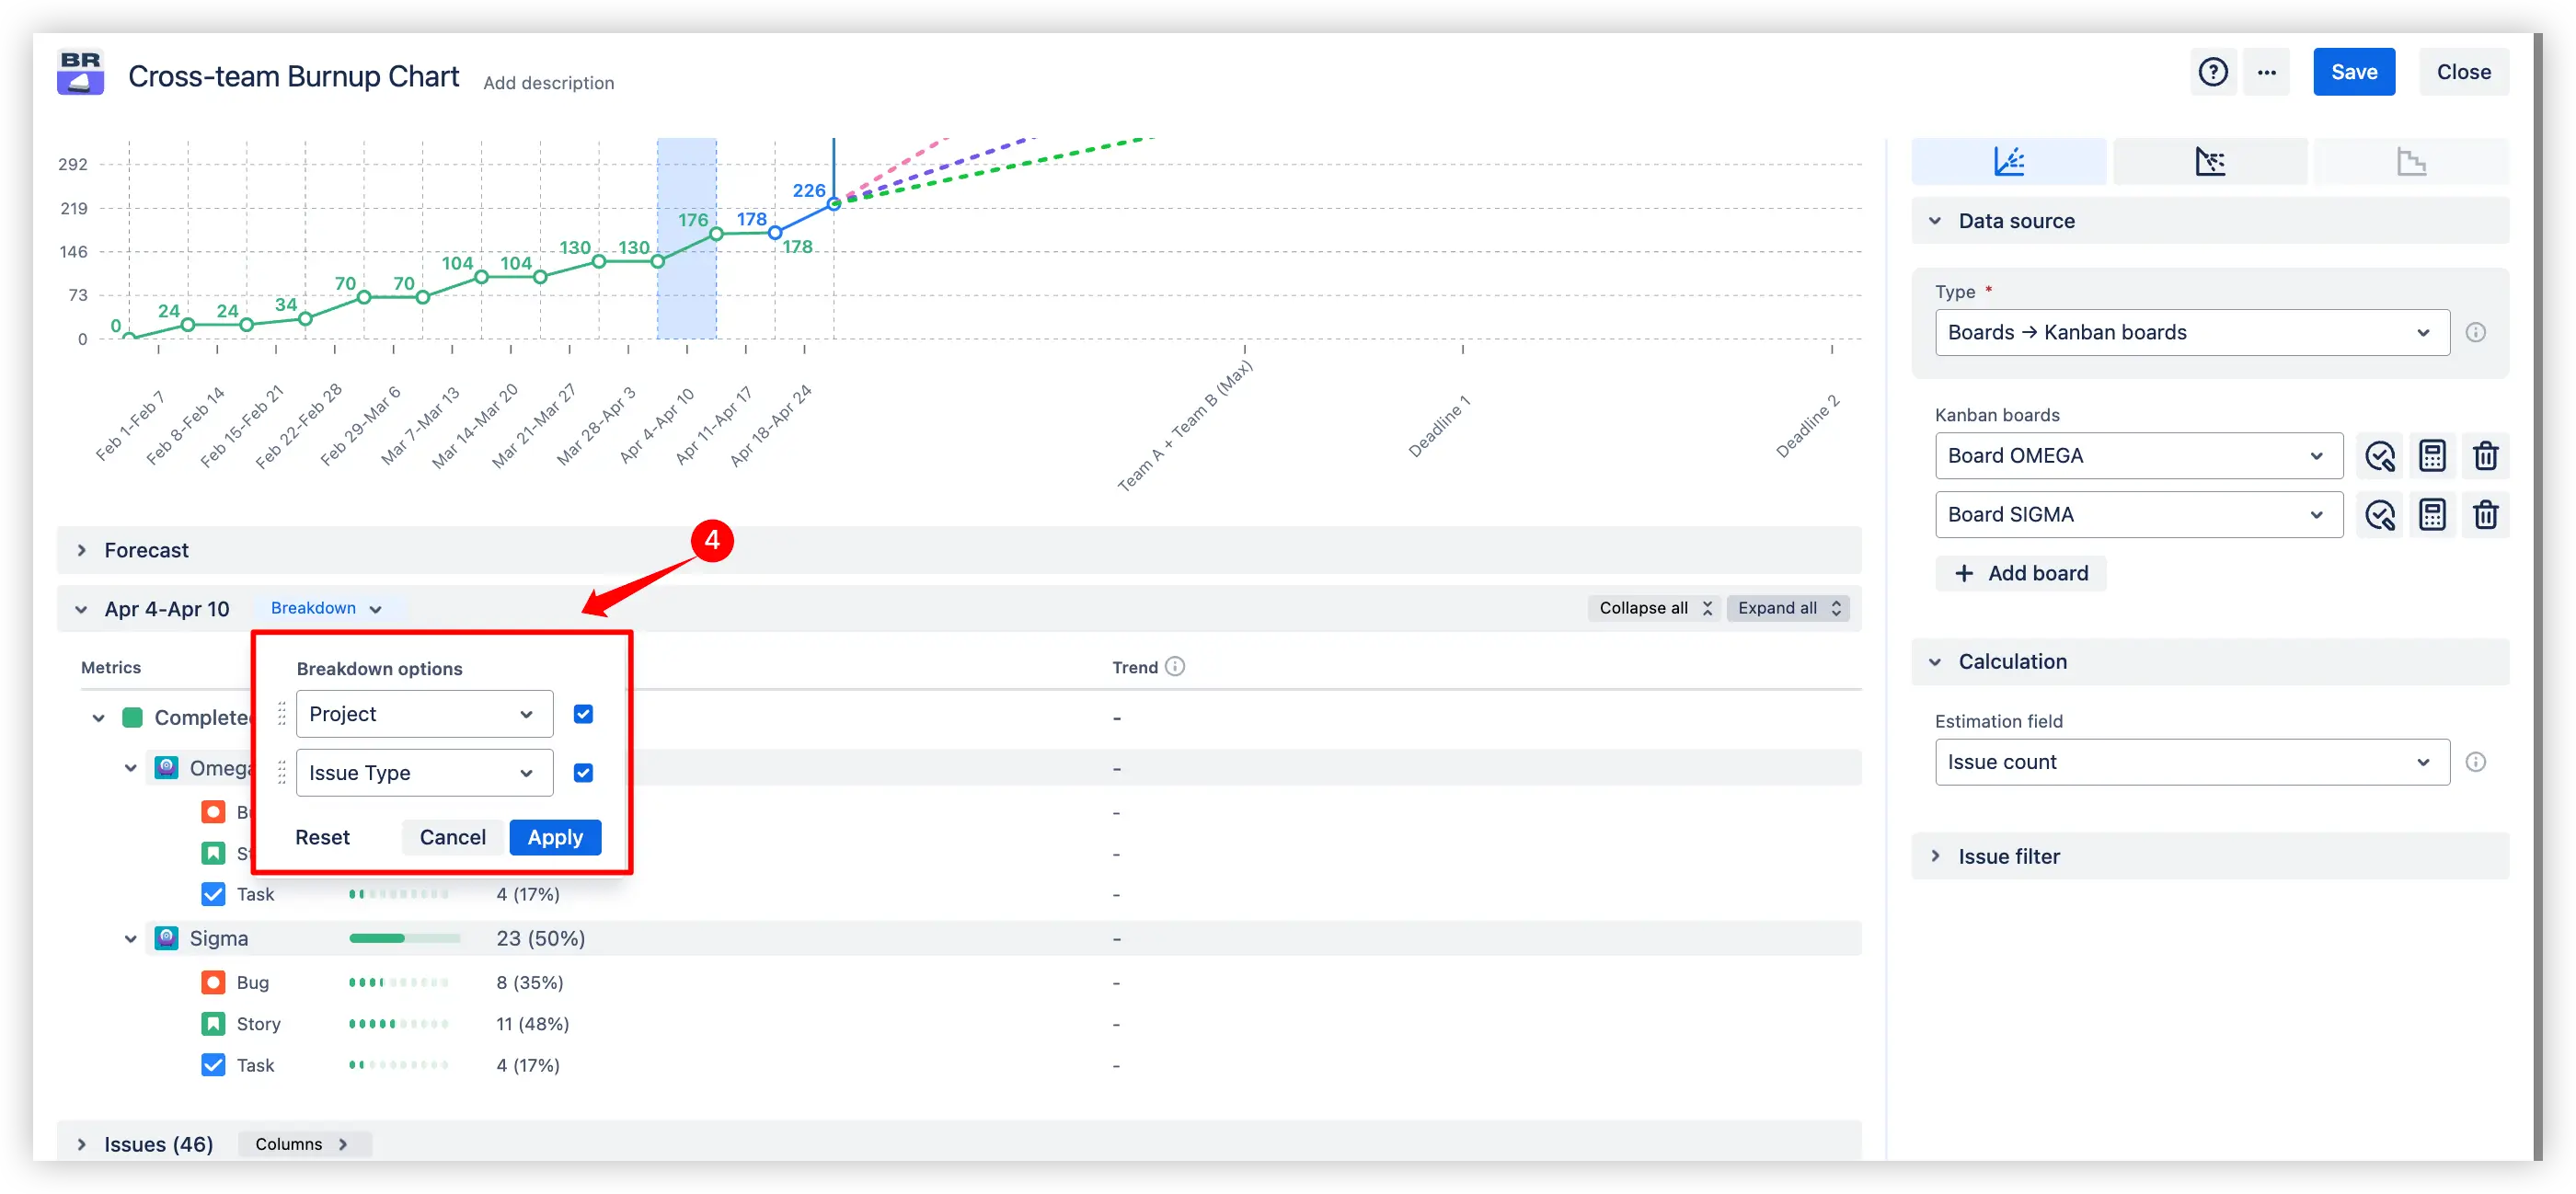
Clicking the “Breakdown” button (4️⃣) opens a form where you can modify the breakdown fields. After applying the new configuration, the breakdown section will instantly update to reflect your changes, helping you focus on what matters most.
The breakdown fields modification on the Burnup chart across teams
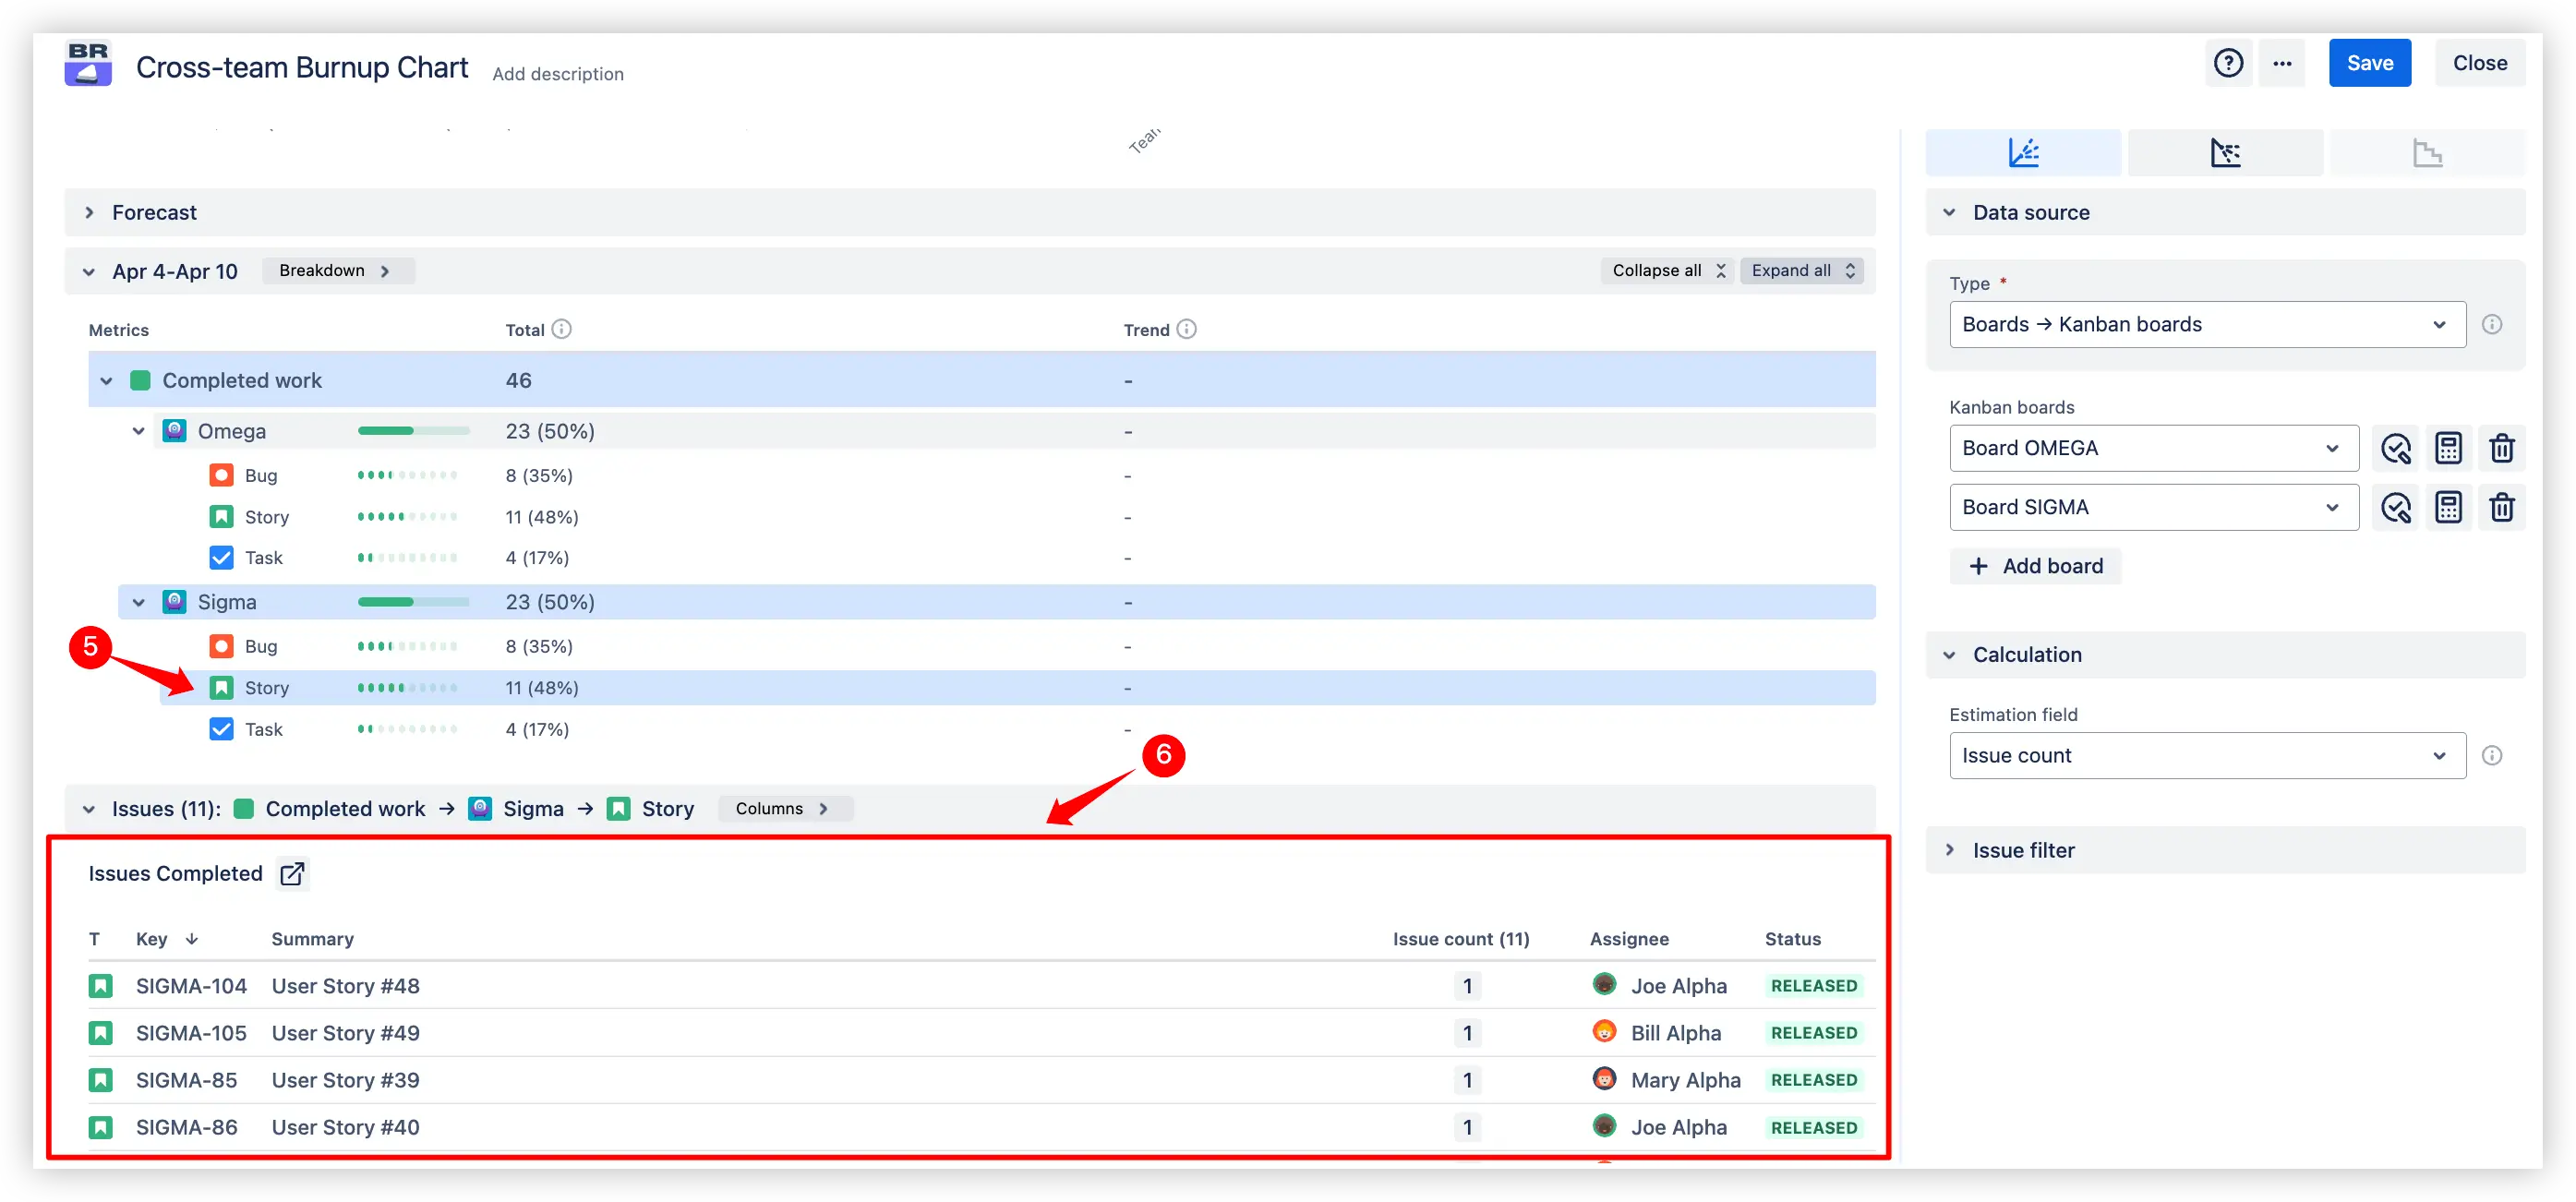
You can even click on any specific breakdown group (5️⃣) to filter the issue list (6️⃣) below.
The issue list filtering in the Multi-team burnup chart
This allows you to quickly view only the work items related to the selected breakdown - whether it's tasks completed by a specific assignee, issues in a particular status, or items within a specific project or component. It’s an easy way to go from high-level insight to a detailed list of relevant issues - in just one click.
3. Key feature: Remaining work simulation
The Cross-team burnup report in Jira dashboard lets you see what could happen if your scope changes, whether you’re adding more work or cutting it down to finish on time.
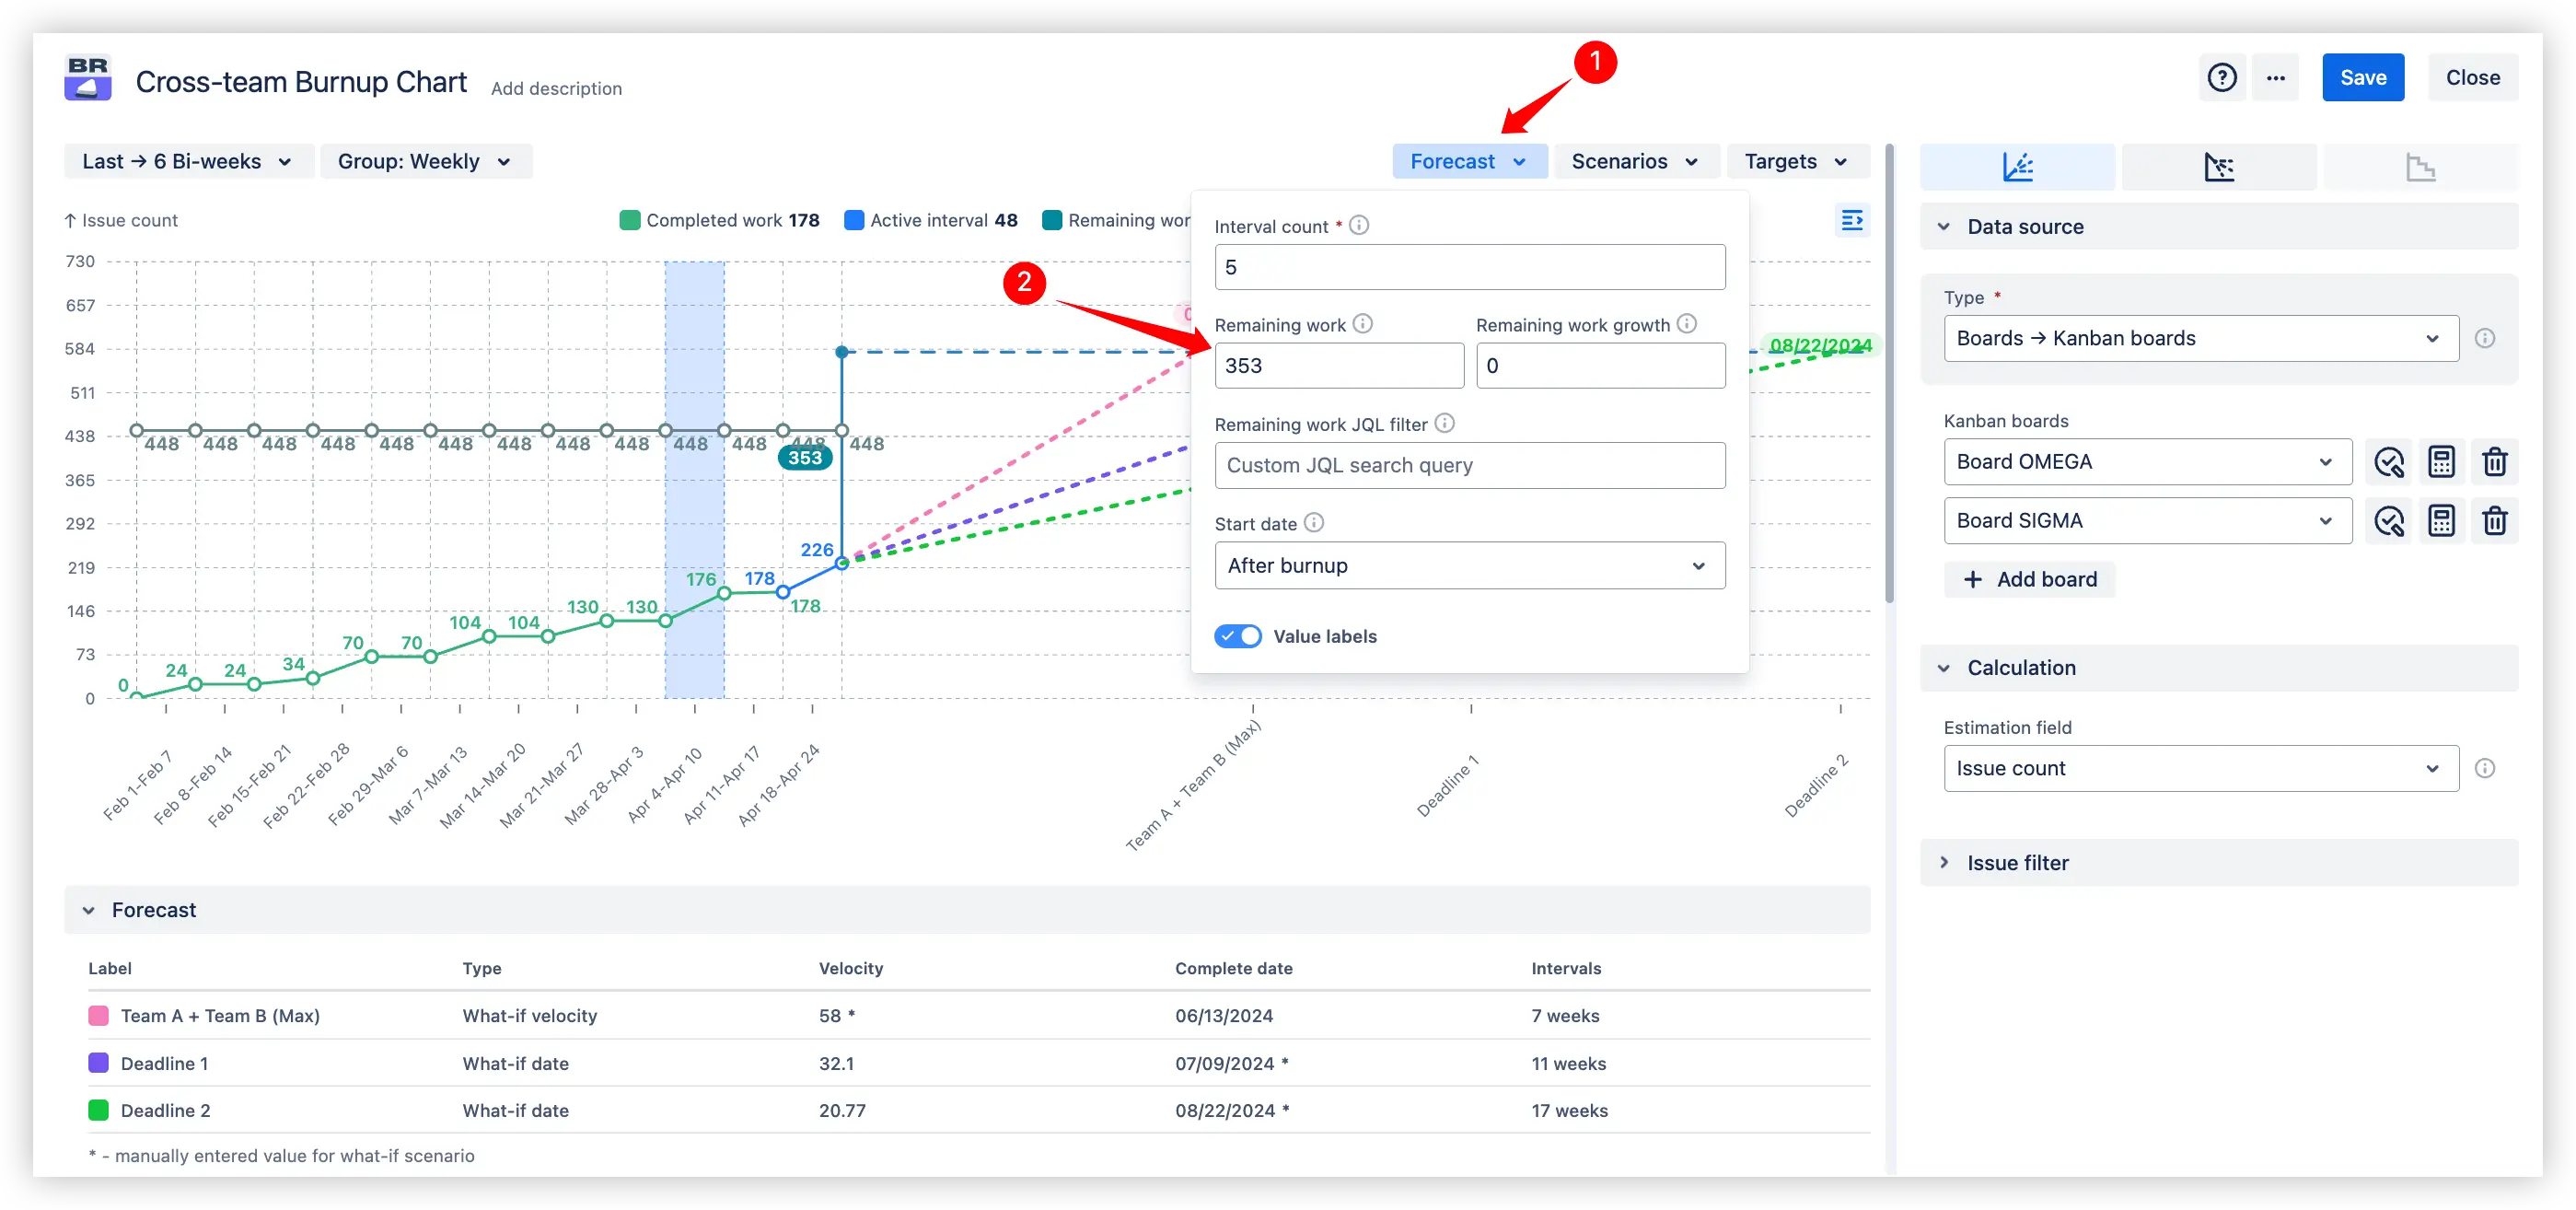
To try it, open the “Forecast” section (1️⃣) and enter a new value in the “Remaining work” field (2️⃣). The chart updates instantly based on the number you enter.
You’ll be able to see how long it might take to complete a larger scope, or how quickly you could finish if you reduce the work. It’s a straightforward way to test different plans and maintain control over your timeline.
The Remaining work simulation in the Team comparison burnup report
4. Key feature: Custom forecast scenarios
Custom forecast scenarios in the Cross-team burnup chart example let you simulate your team’s progress based on a custom velocity or a target deadline.
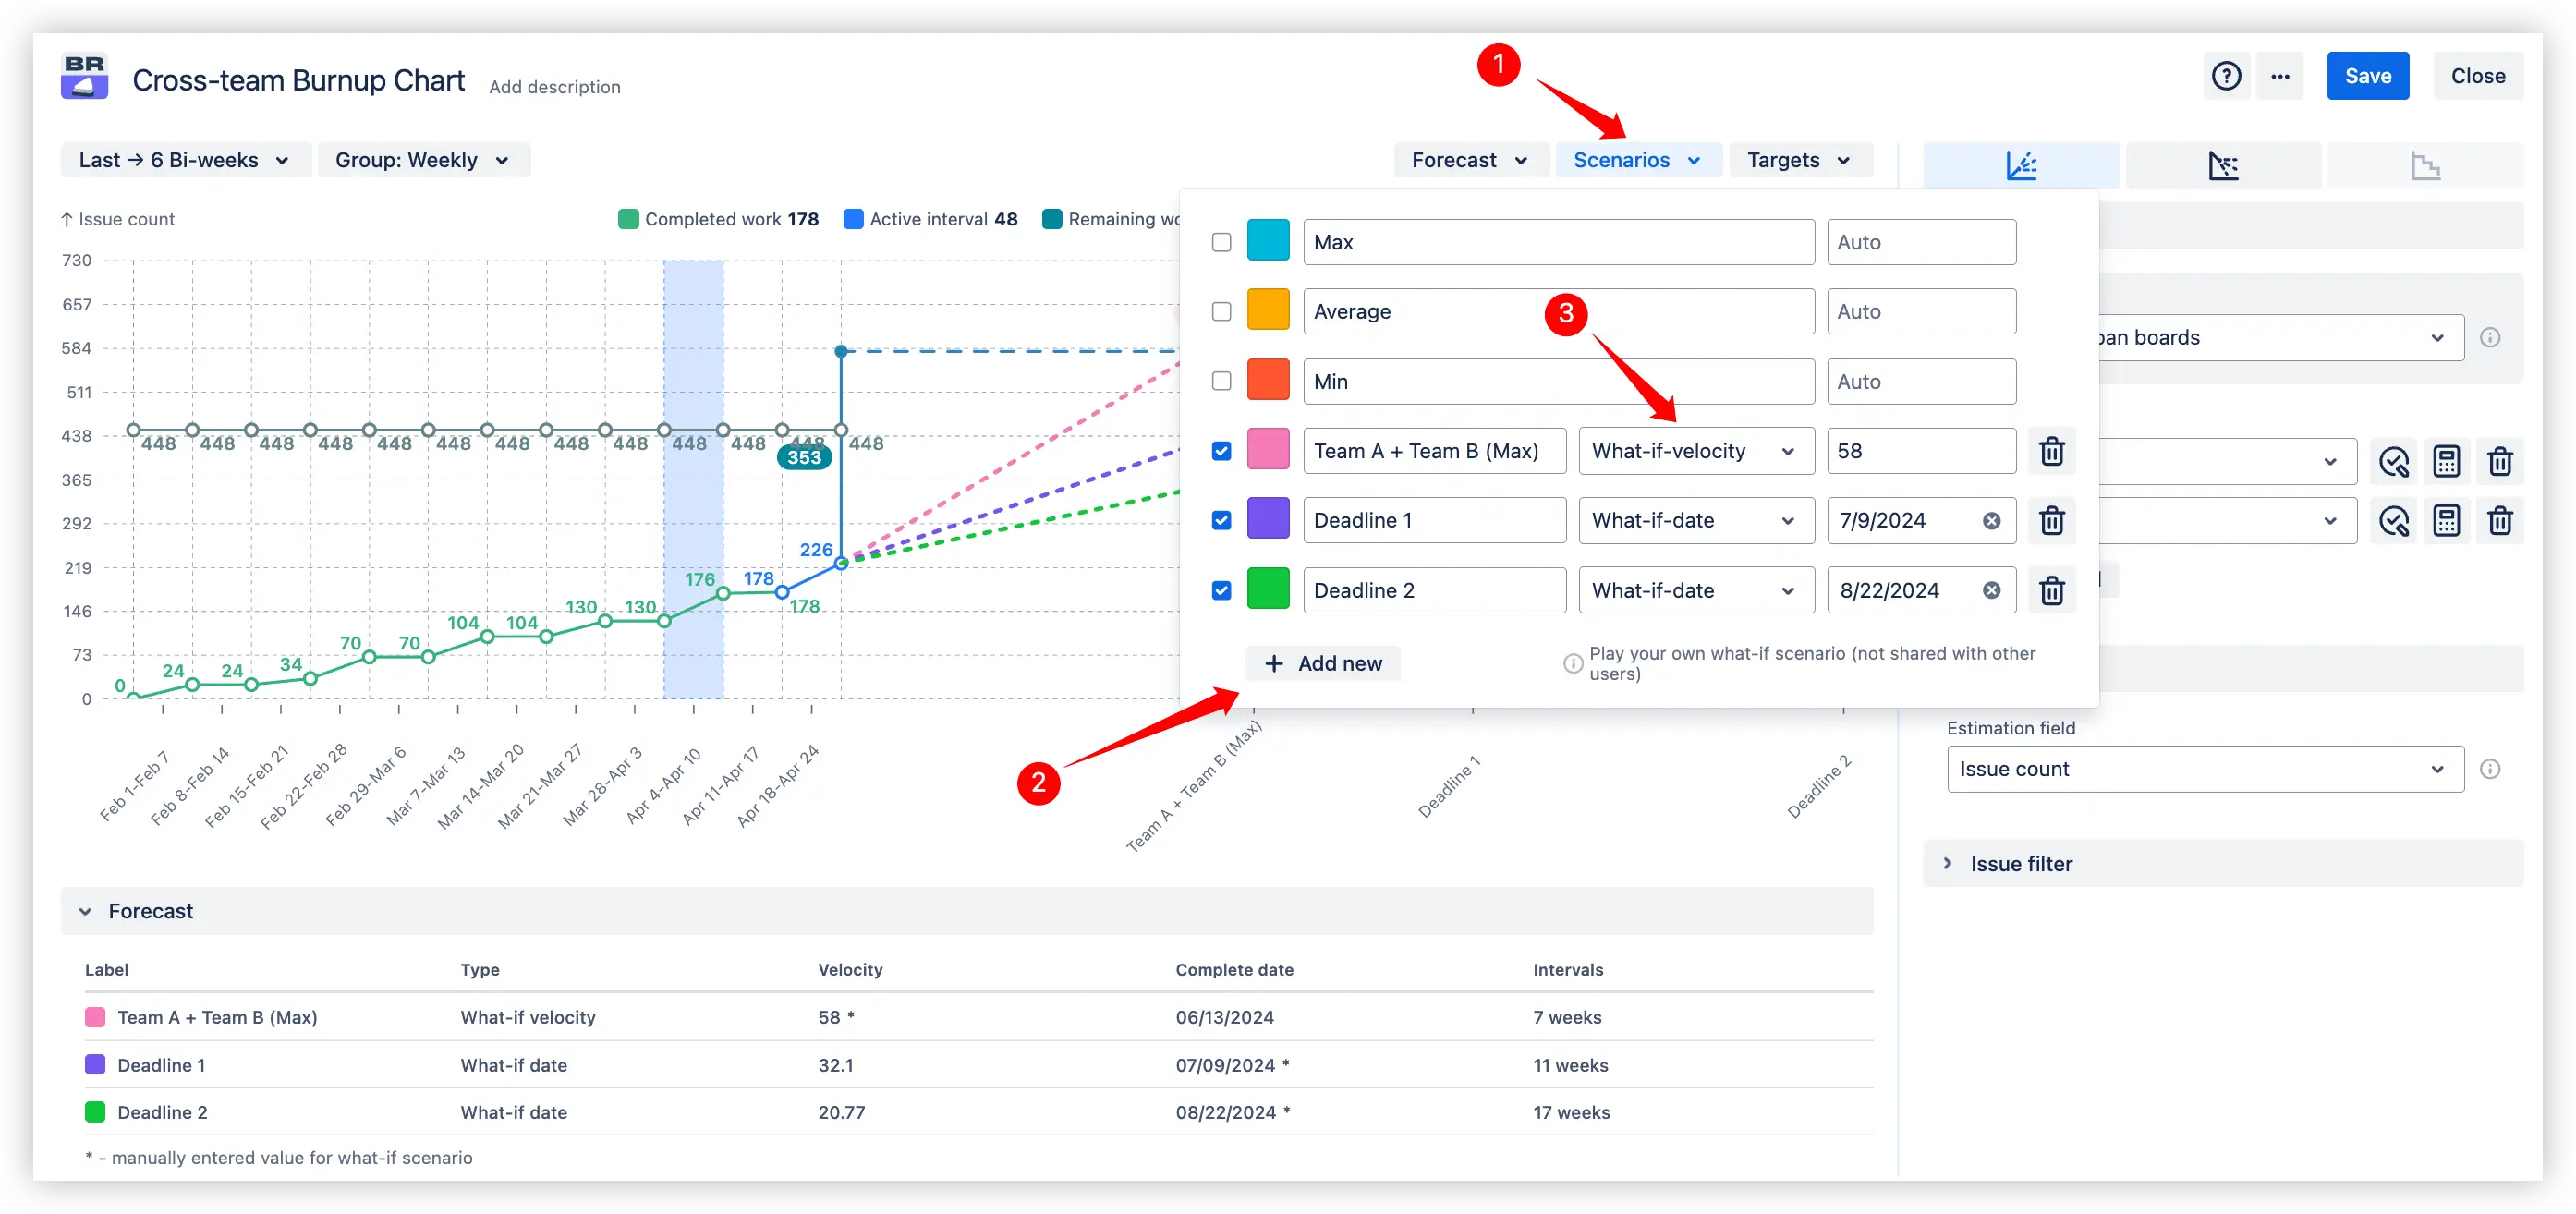
To get started, click the “Scenarios” button (1️⃣). A panel will open, displaying all forecast scenarios currently shown on the chart. The first three are built-in and automatically calculated using your maximum, minimum, and average velocity.
To create your own, click the “Add new” button (2️⃣). Then, choose whether you want to base your forecast on a what-if velocity or a what-if date using the dropdown (3️⃣). Fill in the rest of the fields, and your new scenario will appear on the chart immediately.
Custom forecast scenarios on the Cross-team burnup graph example
What about a native Jira Cross-team burnup chart
Jira does not provide a built-in Cross-team burnup chart in the Dashboard. There’s no native way to combine multiple boards or projects into a single, clear visual chart - or to forecast and explore different delivery scenarios.
That’s where the Cross-team burnup chart in Jira from this interactive example comes in.
✅ With the Burnup chart for multiple teams, you can:
Combine multiple boards or projects into one shared chart
Use built-in, auto-calculated forecasts to see if you're on track
Create your own what-if scenarios to test different plans
Drill down into any time interval with flexible breakdowns
Explore the full issue list and analyze it using any Jira field
It’s everything Jira’s default charts don’t offer, explicitly built for cross-team planning and tracking.
Advantages of using Cross-team burnup chart
One view for multiple teams: track progress across several boards, projects, or teams - all in a single, unified chart.
Aligned forecasting: get accurate, auto-generated forecasts based on real team performance, and instantly see if you're on track to meet your deadlines.
What-if scenario planning: simulate different delivery options by adjusting velocity or target dates to make informed, forward-looking decisions.
Powerful breakdown & filtering: drill into specific time intervals and break work down by any Jira field - like status, assignee, or custom fields - to uncover bottlenecks or trends.
Flexible work scope selection: define the exact scope you need using boards, projects, epics, issue links, saved filters, or even custom JQL.
Detailed issue insights: see the actual list of issues behind every data point, with filtering and sorting by any available field.
Release confidence monitoring: use the chart to spot risks early and adjust scope or pace to stay on track for delivery.
Built for Cross-team collaboration: help product managers, team leads, and stakeholders get a shared view of progress, without jumping between dashboards.
The Agile Reports and Gadgets provide the Cross-team burnup chart functionality along with a wide range of additional reports and charts.
Frequently Asked Questions
What is the Cross-team burnup chart?
The Cross-team burnup chart is a powerful tool designed for advanced users who need full visibility into progress across multiple teams. It helps you track work across boards and projects, forecast delivery, and analyze progress with flexible breakdowns.
What does a cross-team burnup chart in the Jira dashboard show?
A cross-team burnup chart displays the progress of work across multiple teams, showing how much work has been completed and how much remains. It helps visualize the cumulative progress towards a goal, allowing teams to track their efforts, identify any bottlenecks, and forecast project completion.
Does the Cross-team burnup chart support Kanban/Scrum boards?
Yes, it fully supports both Kanban and Scrum boards as built-in data sources, allowing you to track progress no matter how your teams are structured.
Can I filter the work scope by a specific issue type?
Yes. You can use the “Issue Filter” section in the chart settings to apply advanced filters, including filtering by issue type, status, components, or any other Jira field.
How often does the Cross-team burnup report update the issues info?
The Cross-team burnup report updates in real time, ensuring the data you see always reflects the latest issue status and progress.
Can I use time tracking estimations on the Cross-team burnup chart?
Yes. The chart includes a “Time tracking and Remaining Time estimation” mode that calculates progress using Jira's time tracking fields.
How to add a Burnup chart across teams to a Jira dashboard?
Jira doesn't include a cross-team burnup chart by default, but you can add one using the Agile Burnup Burndown Charts app from the Marketplace. To add a cross-team burnup chart gadget to your Jira Dashboard:
Ensure the Agile Burnup Burndown Charts app is installed.
Go to your Jira Dashboard and search for the "Agile Burnup Burndown Charts" gadget.
Select your data source and instantly generate a cross-team burnup chart, with a variety of real-time configuration options for multiple teams.


.svg)


.png)
