
Thank you! Your submission has been received!
Oops! Something went wrong while submitting the form.


A Cross-team burndown chart makes remaining work visible, highlights completion trends, and helps teams forecast project completion confidently, whether you're tracking one or several cross-functional teams across multiple projects.
Unlike conventional BI dashboards that depend on scheduled data imports, the Agile Burnup Burndown Charts gadget provides real-time visualizations that instantly reflect the latest updates from Jira.
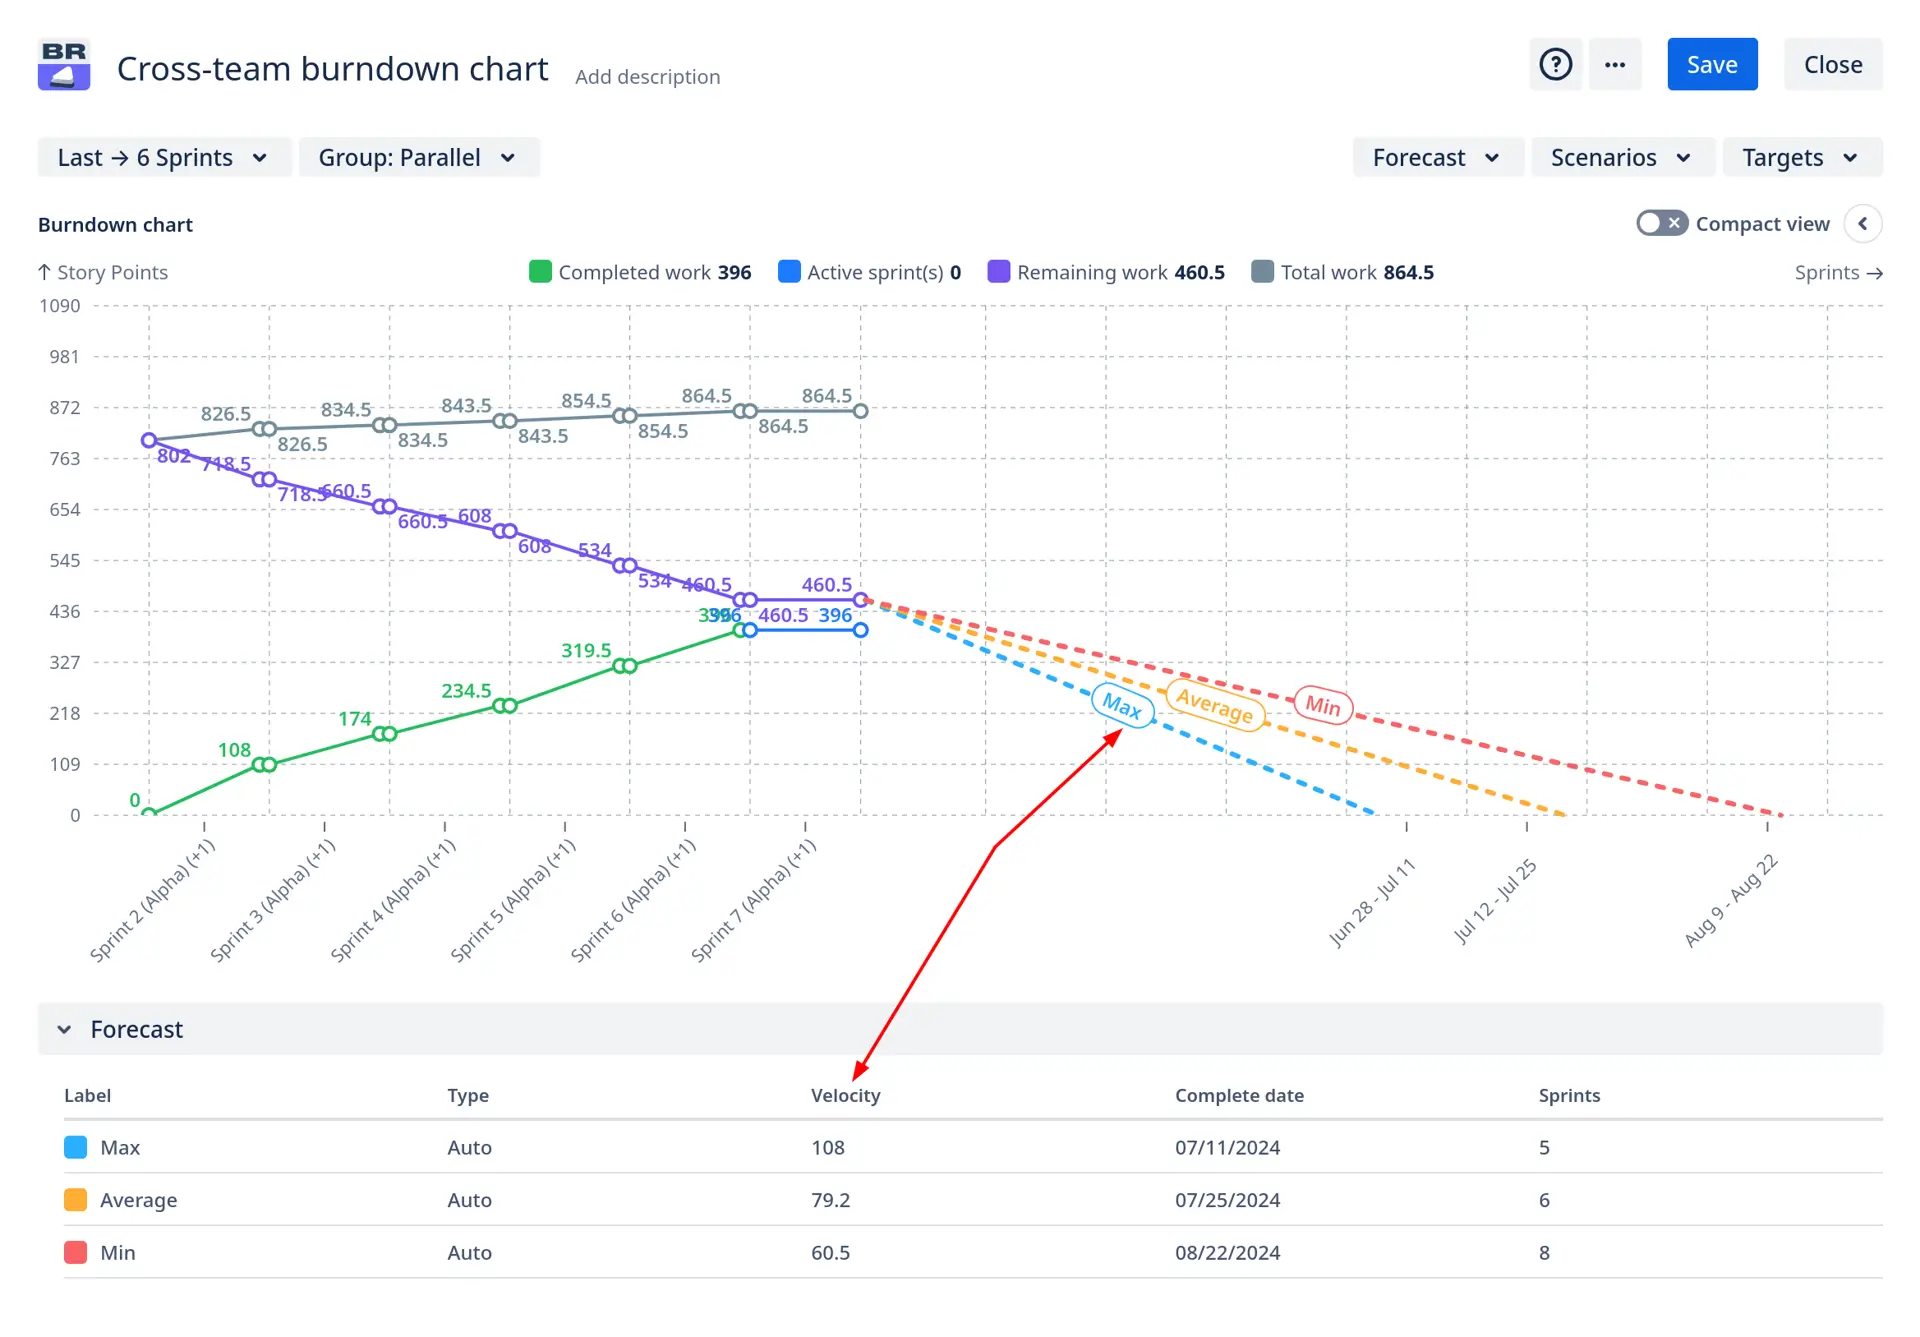
The Cross-team burndown chart automatically generates forecasts based on your teams' historical minimum, average, and maximum burn rate (throughput in case you use issue count), while clearly showing how scope changes impact the remaining work trajectory:
✅ Product manager: I need a realistic view of completion timelines across multiple teams. Jira сross-team burndown graph gives me accurate forecasts based on actual combined burn rates and lets me run what-if scenarios to evaluate different delivery options. It helps me identify when scope increases are pushing out deadlines, align expectations with stakeholders, and make informed decisions about scope reduction when the remaining work isn't trending toward our target.
✅ Delivery Manager: I need to properly plan the following sprints without overkill of adding too much extra work. I used Jira reports before, but it doesn't allow me to view data across multiple boards nor apply custom scenarios. Jira сross-team burndown report lets me see how fast work was completed before and see the forecast based on previous sprints or custom scenarios. And the remaining work growth feature allows me to plan the scope for the following sprints properly.
✅ Tech Lead: I have three teams working on separate projects, but having common code bases. I use a сross-team burndown graph in Jira to schedule maintenance of our code base between my teams and keep minimal tech debt without affecting our Sprint goals.


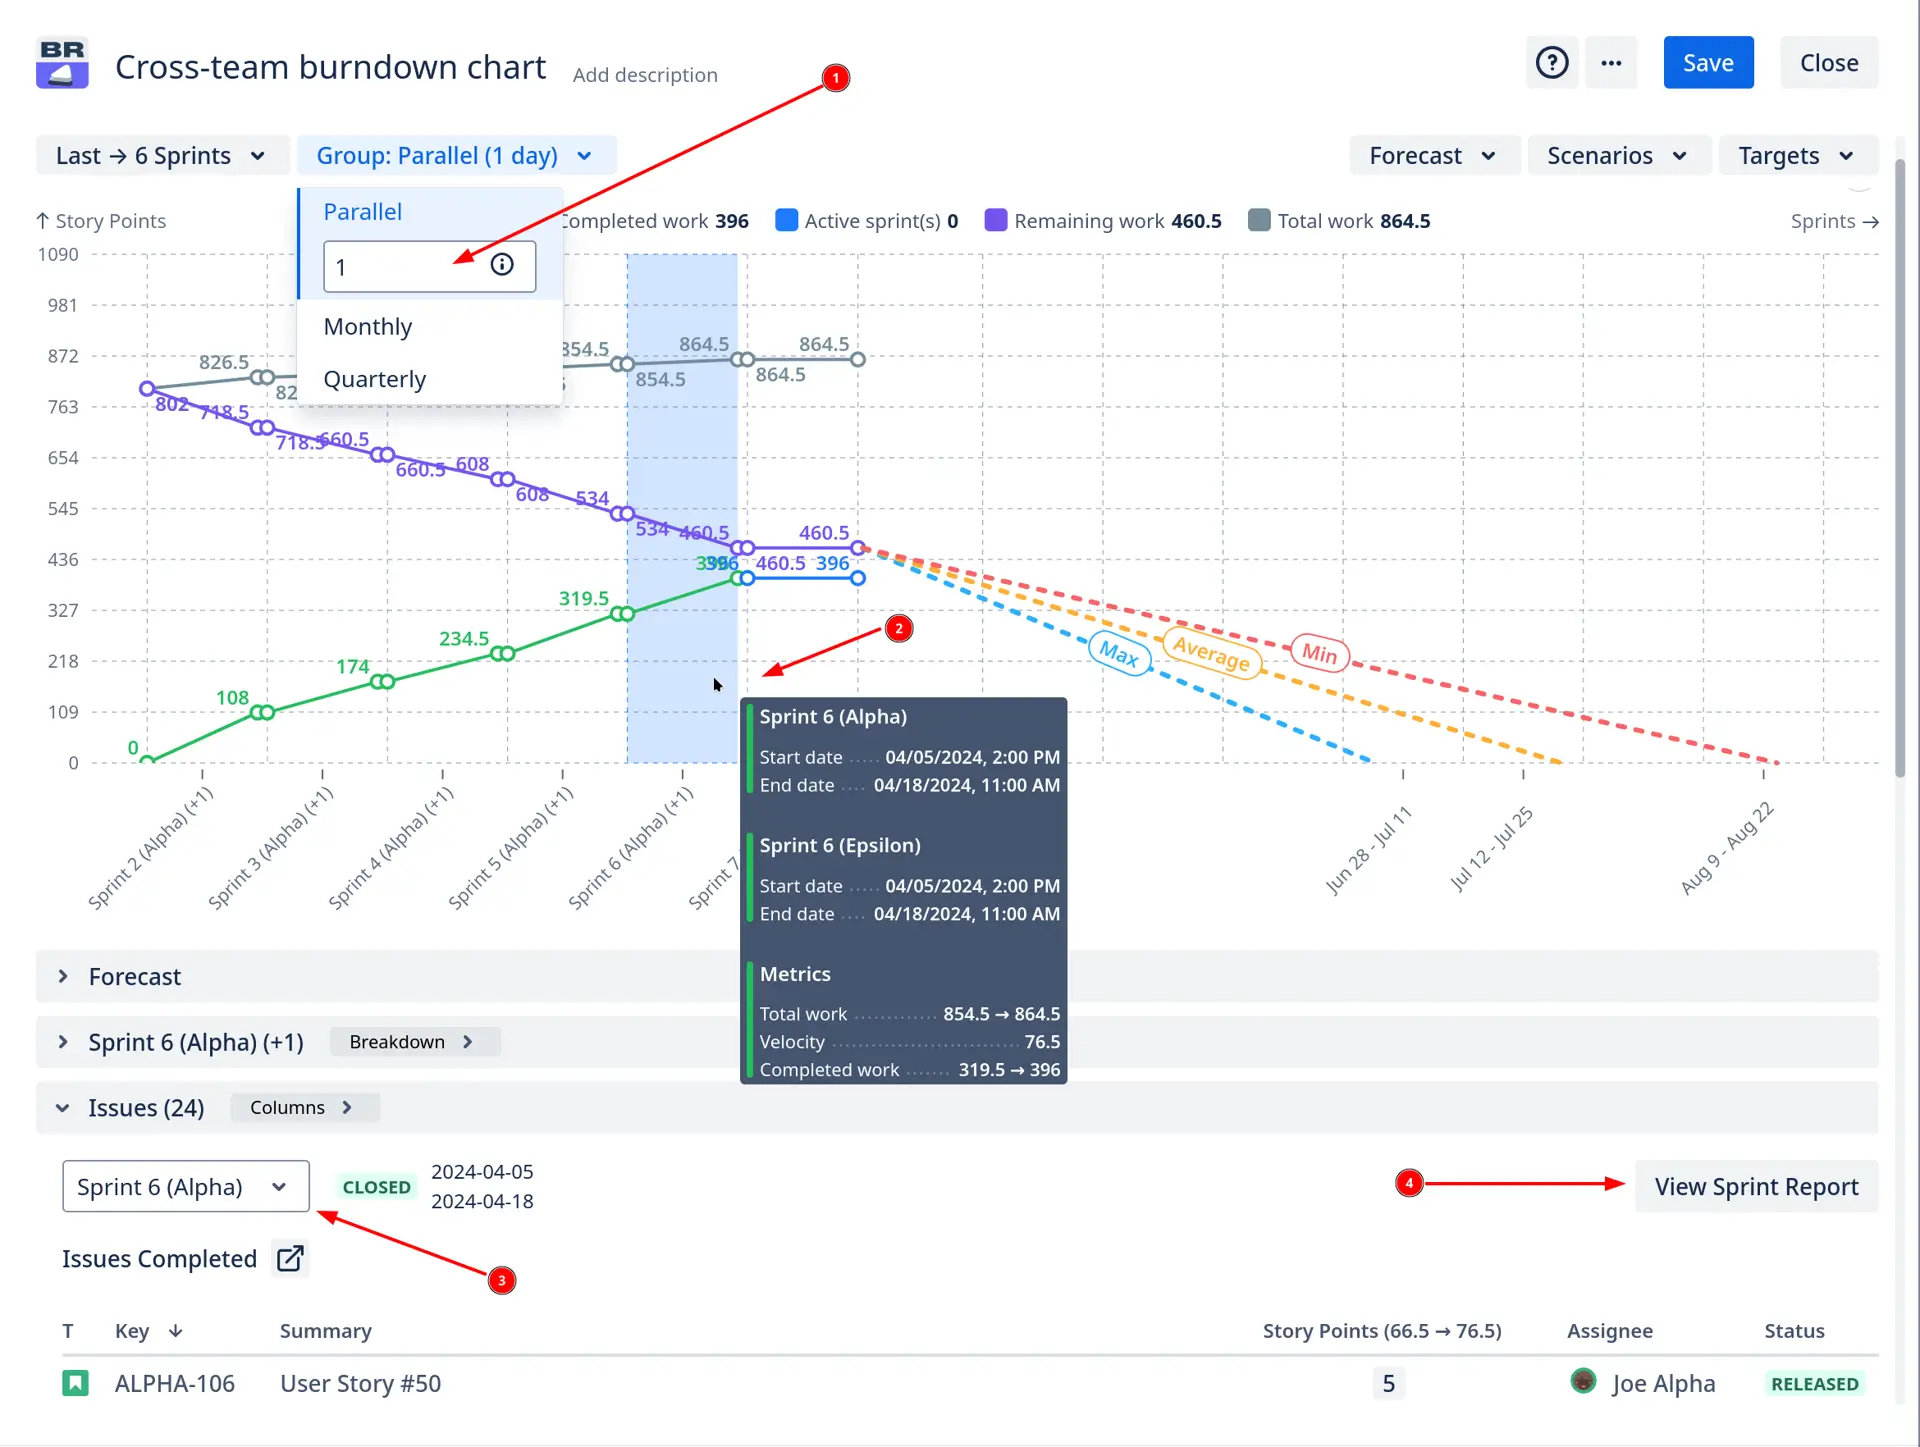
Multiple teams can have separate sprints with different start/end dates. We have a sprint grouping feature that allows us to combine multiple sprints across one or multiple boards into a single interval:
Here is a report showing multiple teams in one burndown:
The сross-team burndown graph features 3 standard forecast scenarios: min, average, and max. You can configure a wide range of advanced scenarios with the following features:
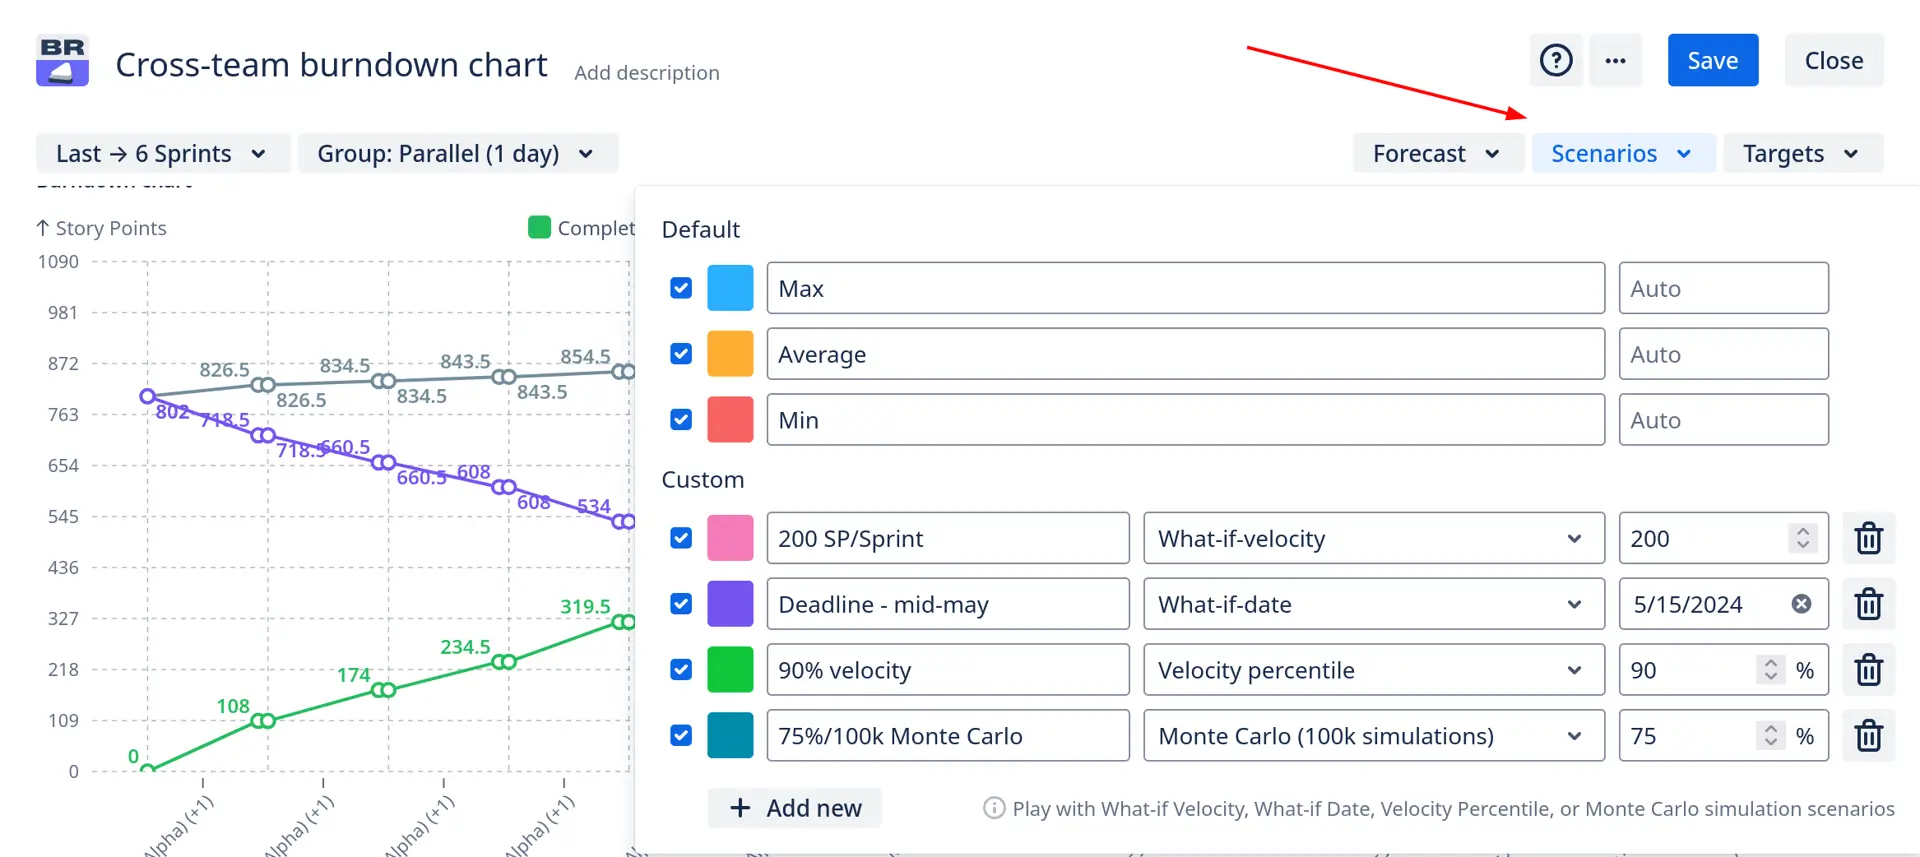
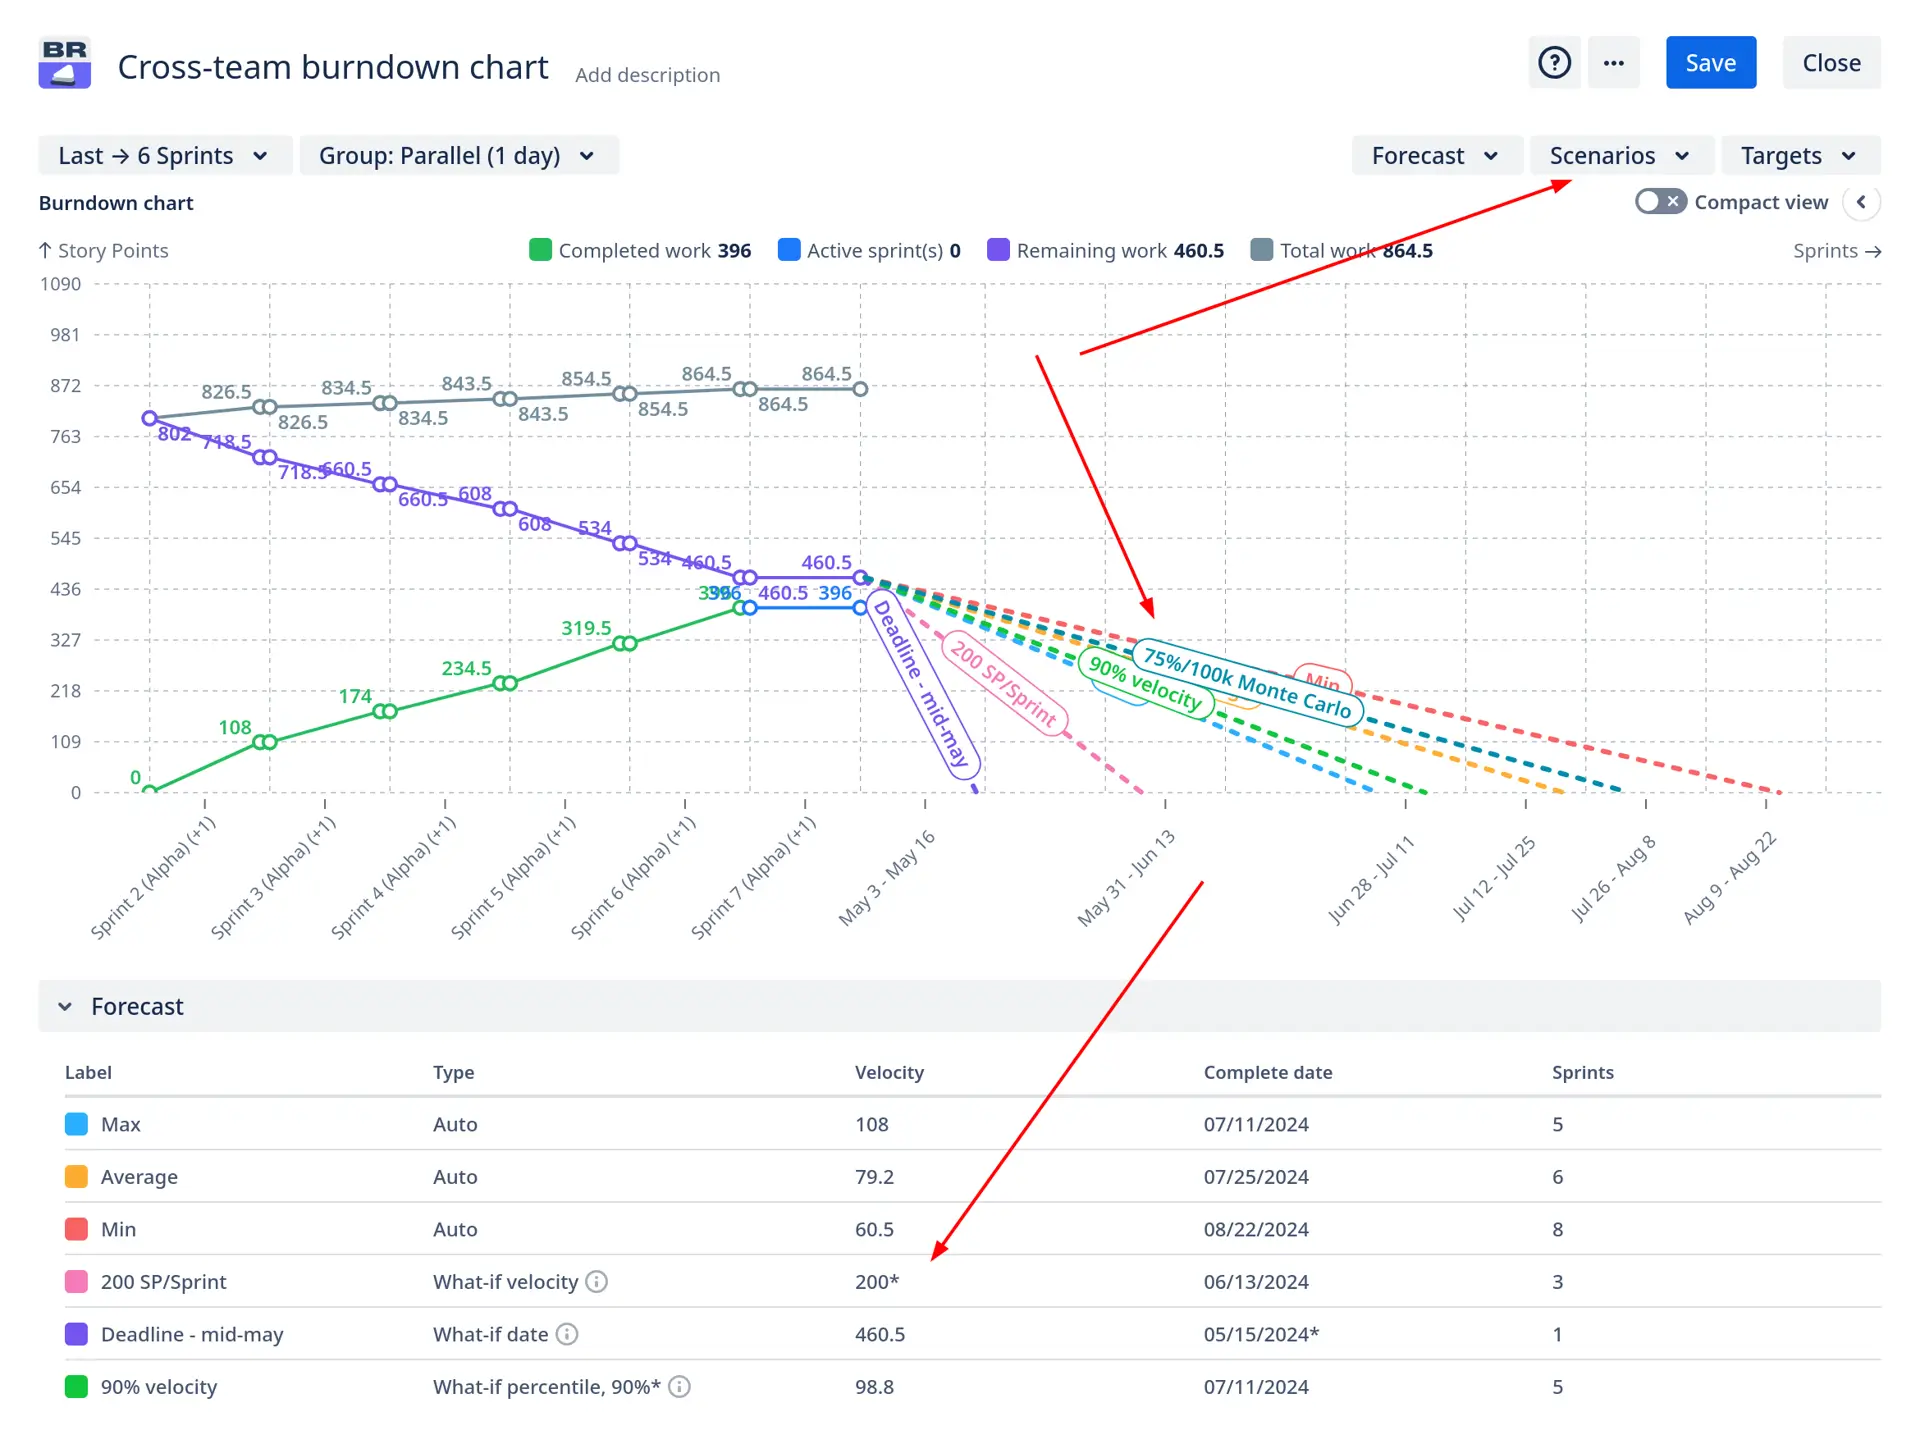
Often, forecasts are not linear: scope grows, backlog contains unrelated tasks, and teams work on multiple scopes. We featured a range of settings to address these problems:
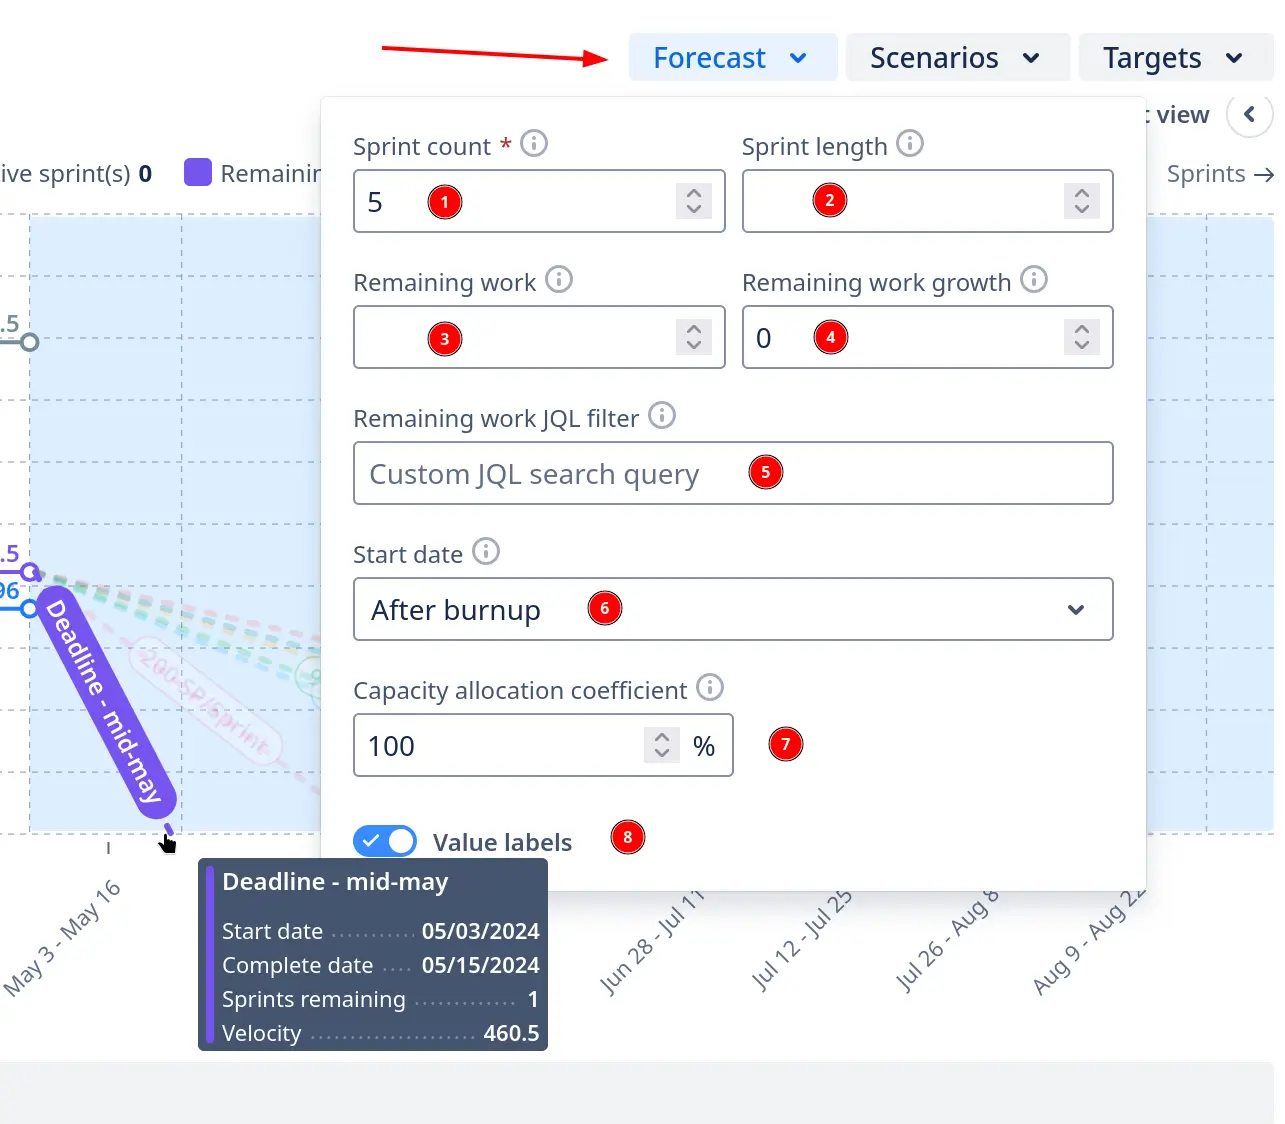
Let’s break down all these settings and their use cases:
💡 Use case: This is useful for teams to understand their velocity over multiple Sprints.
💡 Use case: Helps in adjusting forecasts based on varying Sprint durations.
💡 Use case: Allows teams to evaluate progress against a set amount of work remaining.
💡 Use case: Ideal for planning when expecting continuous backlog growth.
💡 Use case: Enables focused forecasting by filtering out irrelevant issues.
💡 Use case: Assists in planning based on historical data or specific project timelines.
💡 Use case: This tool is helpful for teams that need to allocate resources efficiently based on past performance.
💡 Use case: Enhances visual clarity for presentations or reports where detailed values are unnecessary.
Add precise target lines with specific dates to your Cross-team burndown chart in Jira to clearly see if you’re on schedule, ahead, or falling behind:
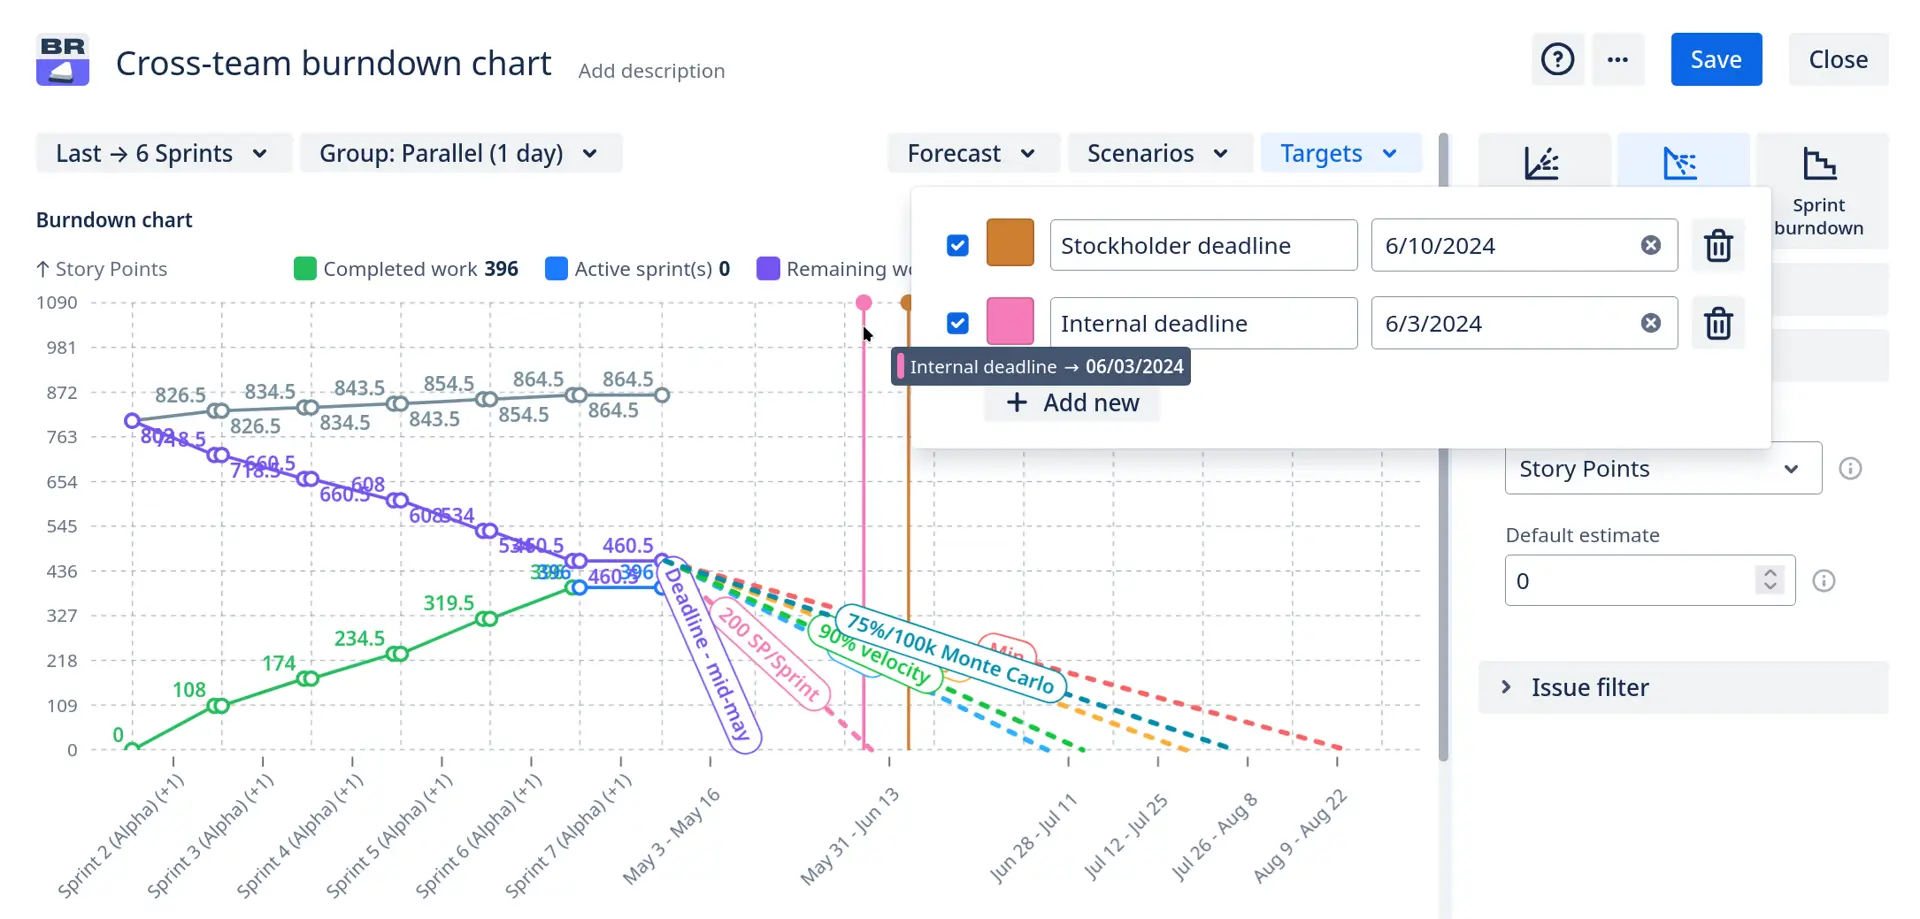
In the сross-team burndown report example above, we show two custom target lines. You can add as many target lines as you need.
✅ How the “Target lines” feature benefits your team:
Sometimes a сross-team burndown chart in Jira may be used with large scopes, planning may spread across a very large date period, rendering the chart shows a large horizontal scope in a small window. To address this issue, we have the Compact view feature:
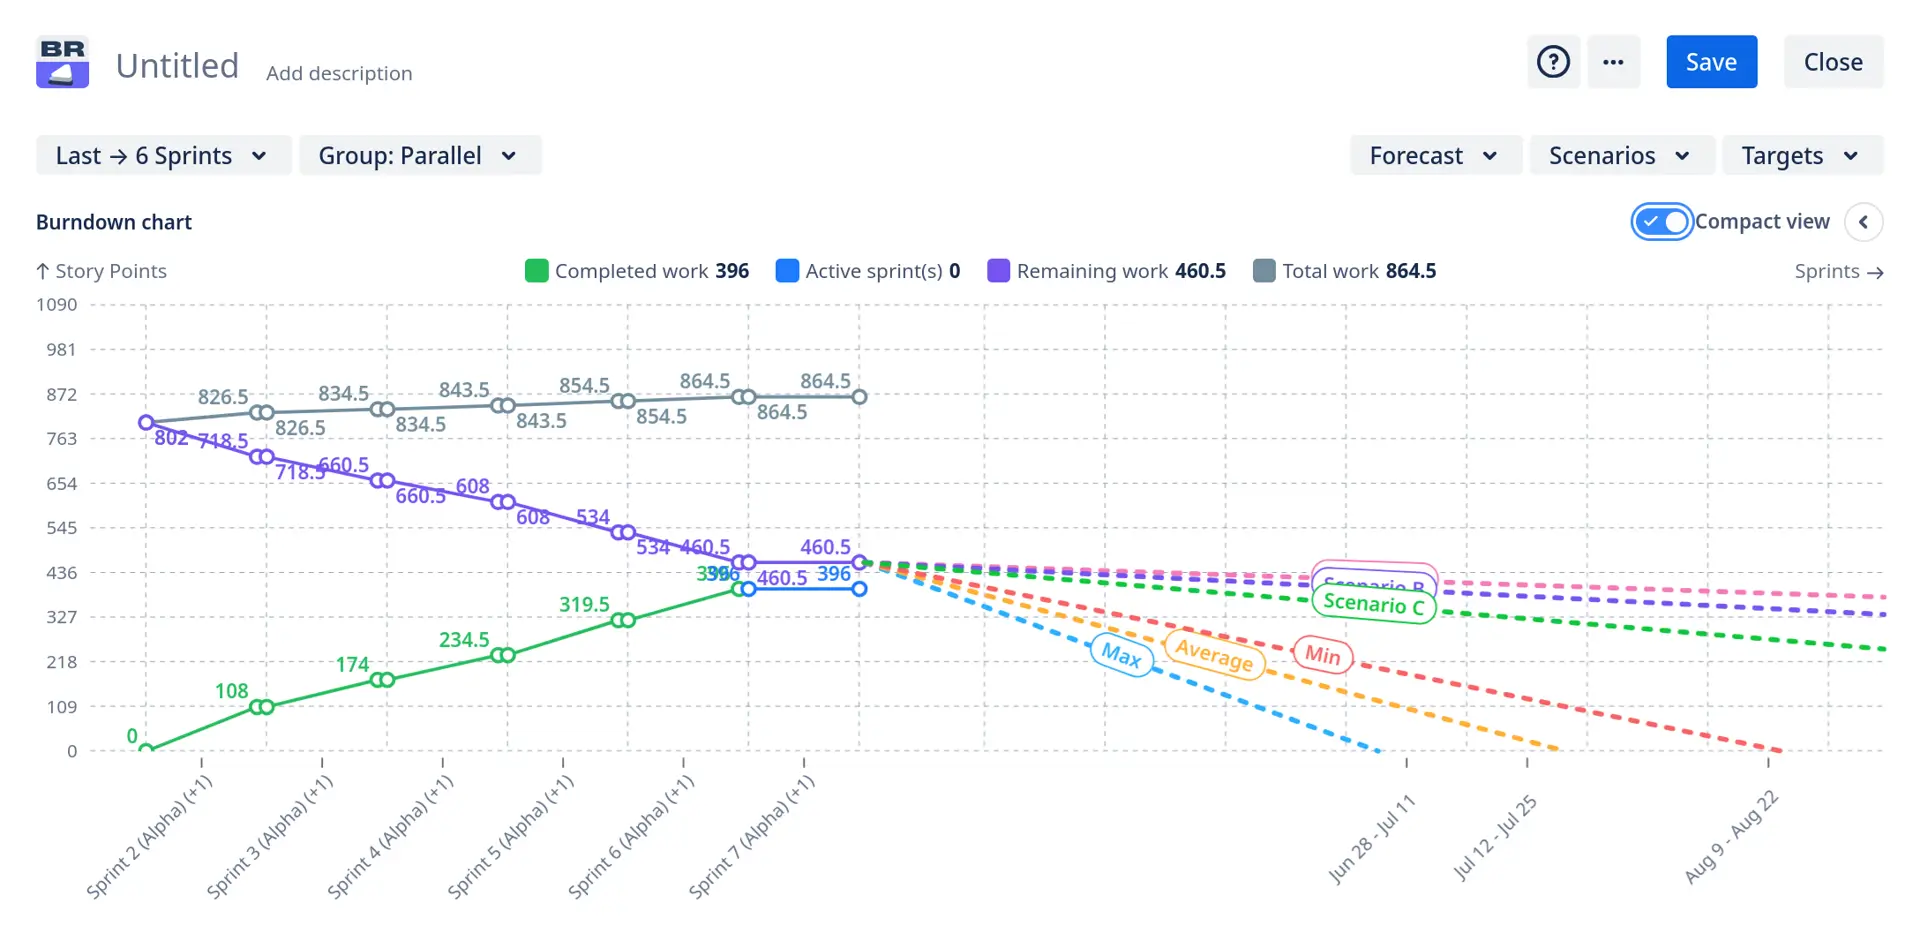
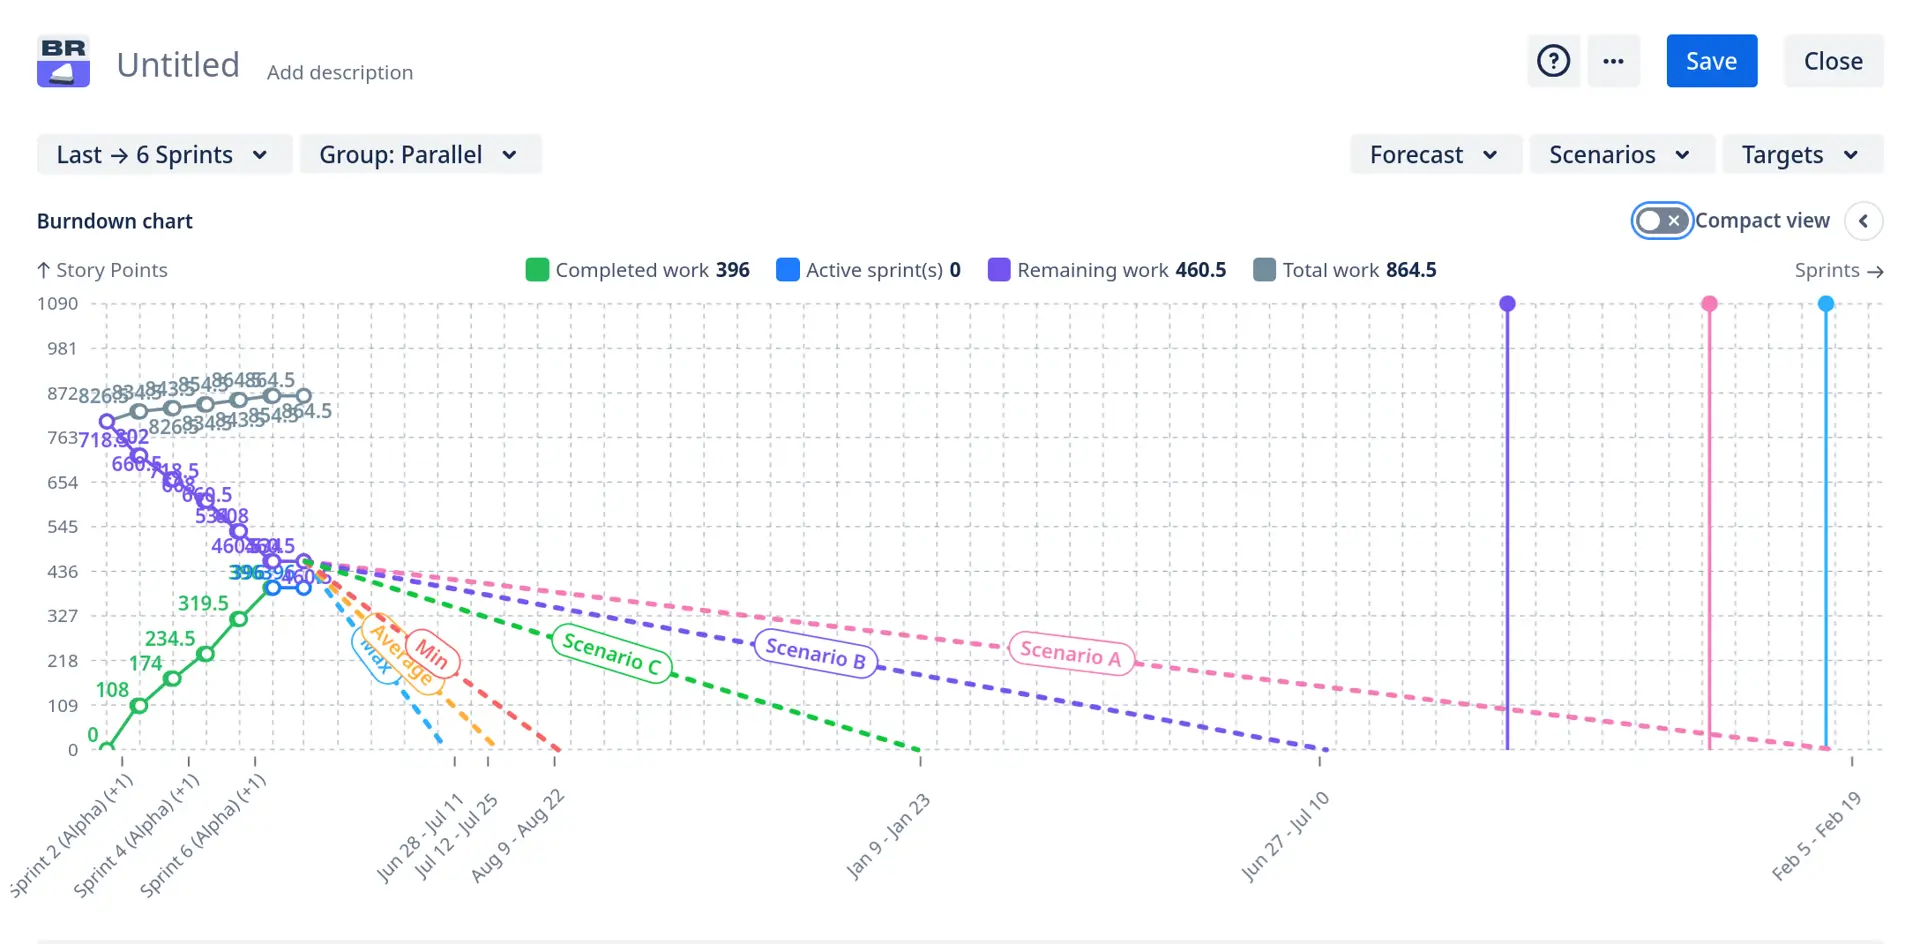
As you see, the compact view focuses on the main area of the chart by limiting the scope we see on the screen. This makes the chart more readable without losing the ability to see the whole scope.
Gain richer insights using breakdown views and advanced filters. Select any chart segment - past (completed) or upcoming (future) - and dive into specific performance metrics.
In this example, we’ll focus on the features available for completed sprints.
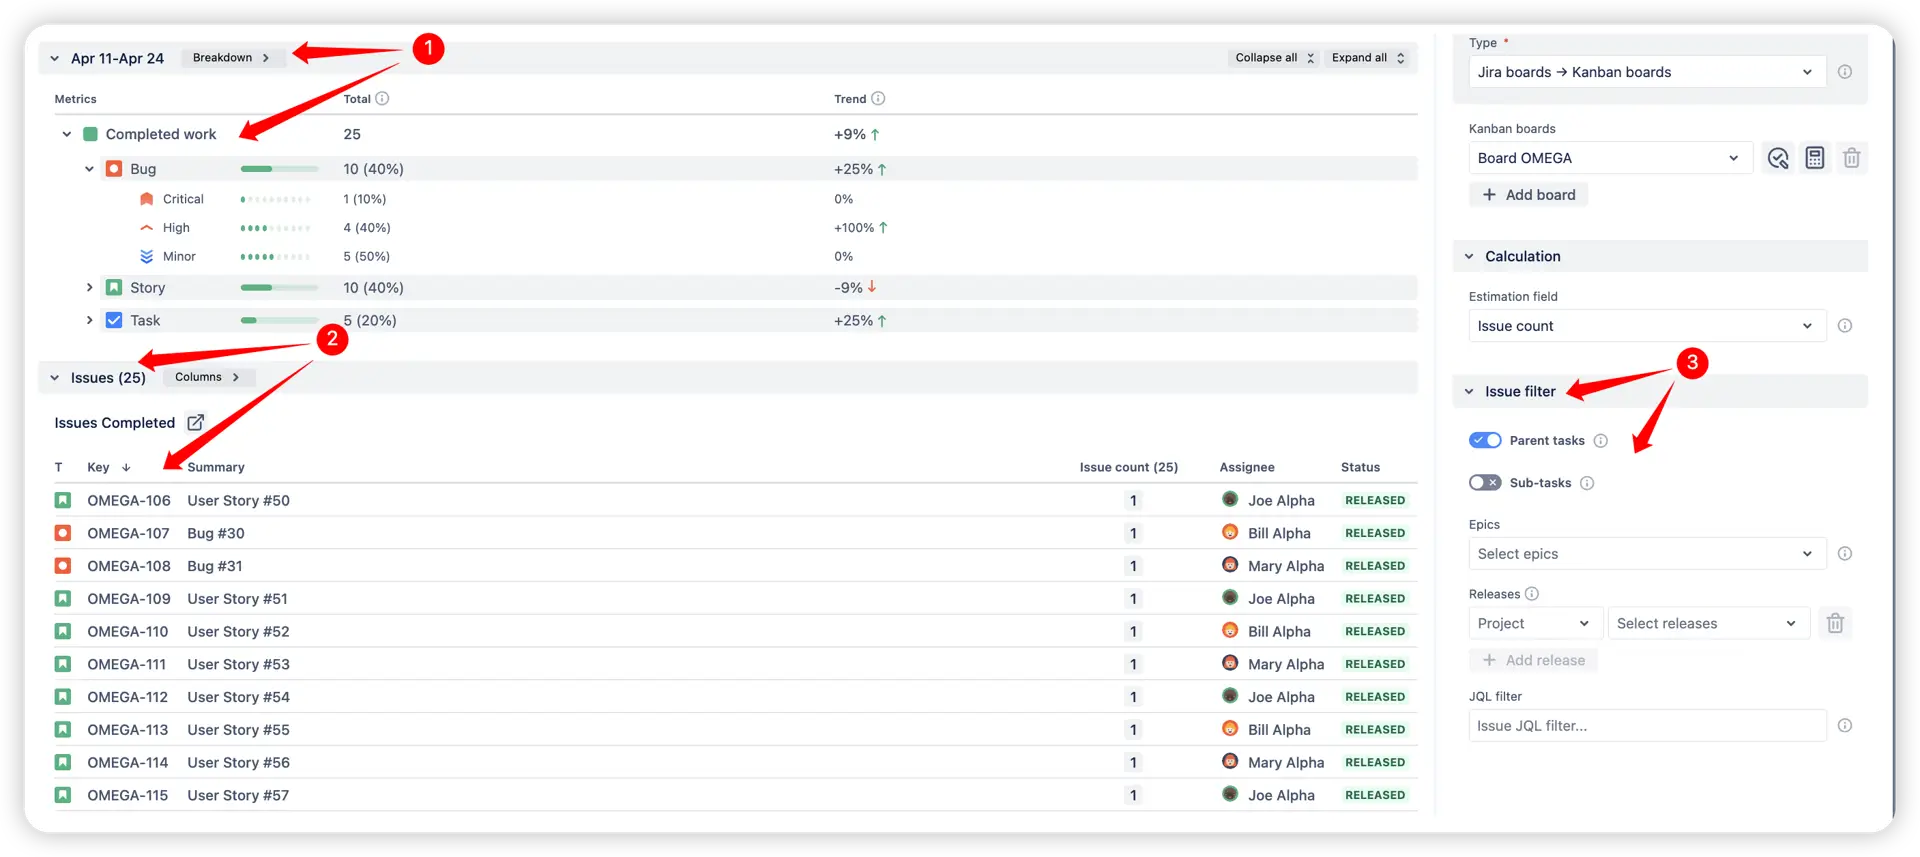
The cross-team burndown chart example above highlights the following elements:
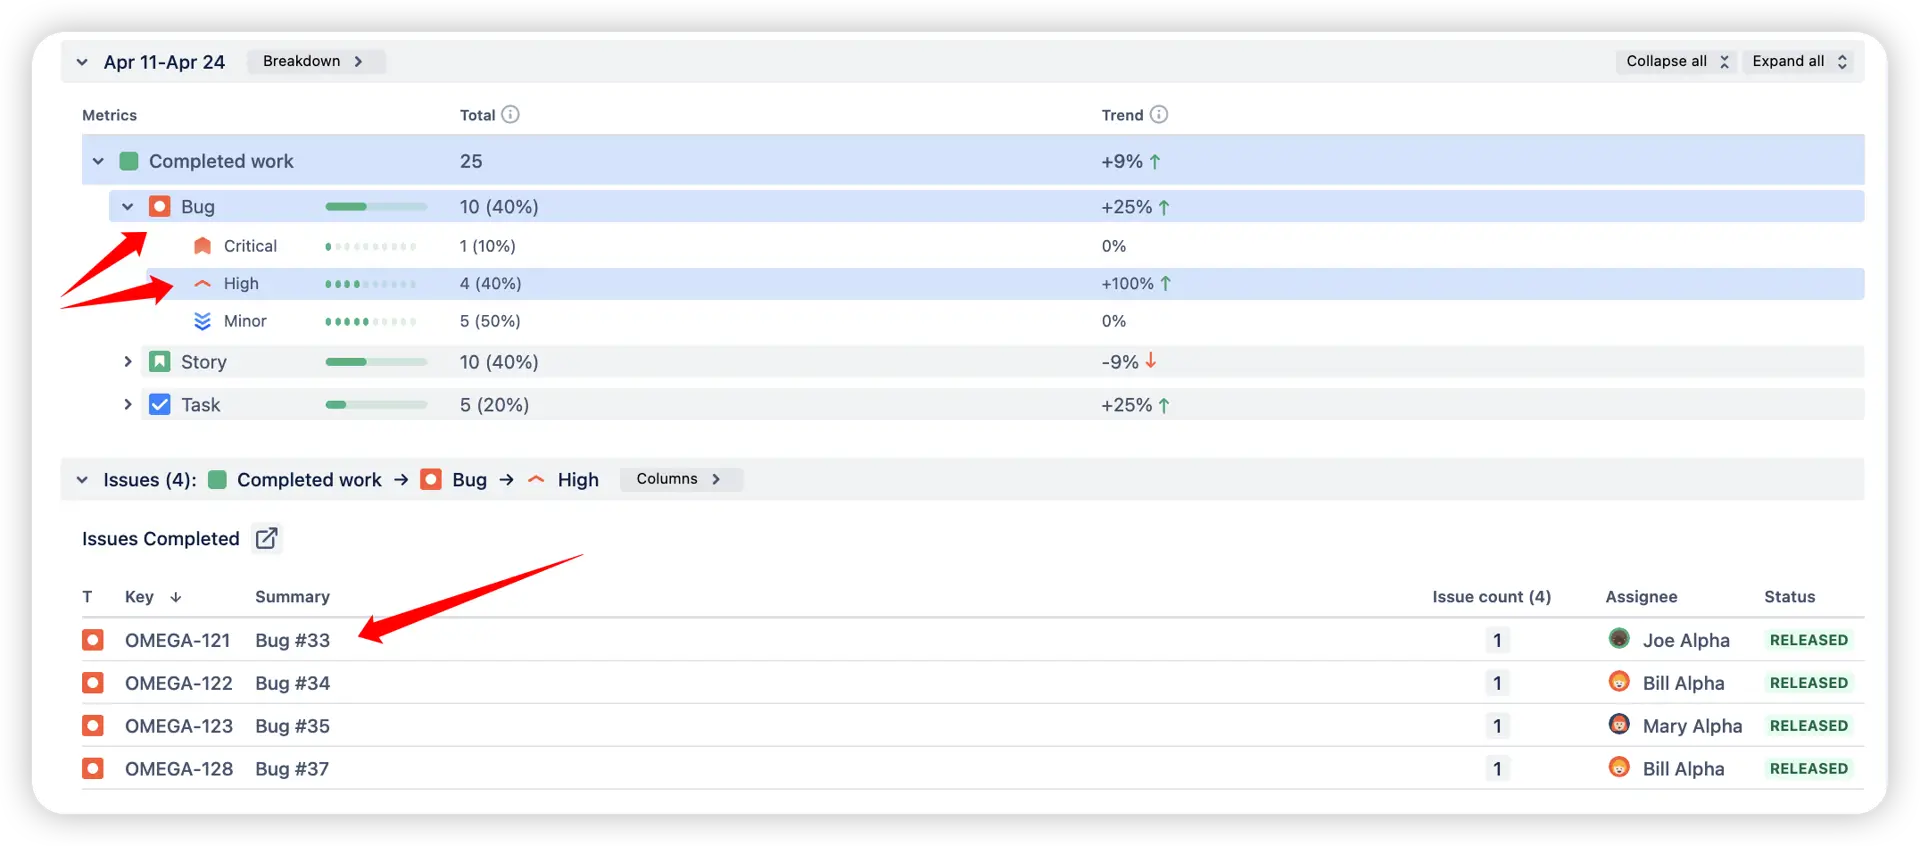
These capabilities help Scrum teams maintain control over delivery by transforming raw scope data into clear, actionable insights.
Native Jira reports offer a so-called “Burndown Chart”, but it only allows tracking progress in the scope of a single sprint and misses a lot of features we offer:
With our Jira gadget for cross-team burndown, you can:
Use these examples to create your own use cases right on the Jira Dashboard.
Both Jira apps (plugins) featured here come with a 30-day free trial and are completely free for teams of up to 10 users:
The Agile Reports and Gadgets app includes Cross-team burndown chart capabilities along with many other powerful reports and charts.
The Scrum team needs a burndown chart to see work completion, addition, deletion, and scope change patterns, and improve the velocity (throughput) of the delivery teams. Our team comparison burndown report allows us to see patterns quickly, build a forecast using customizable scenarios.
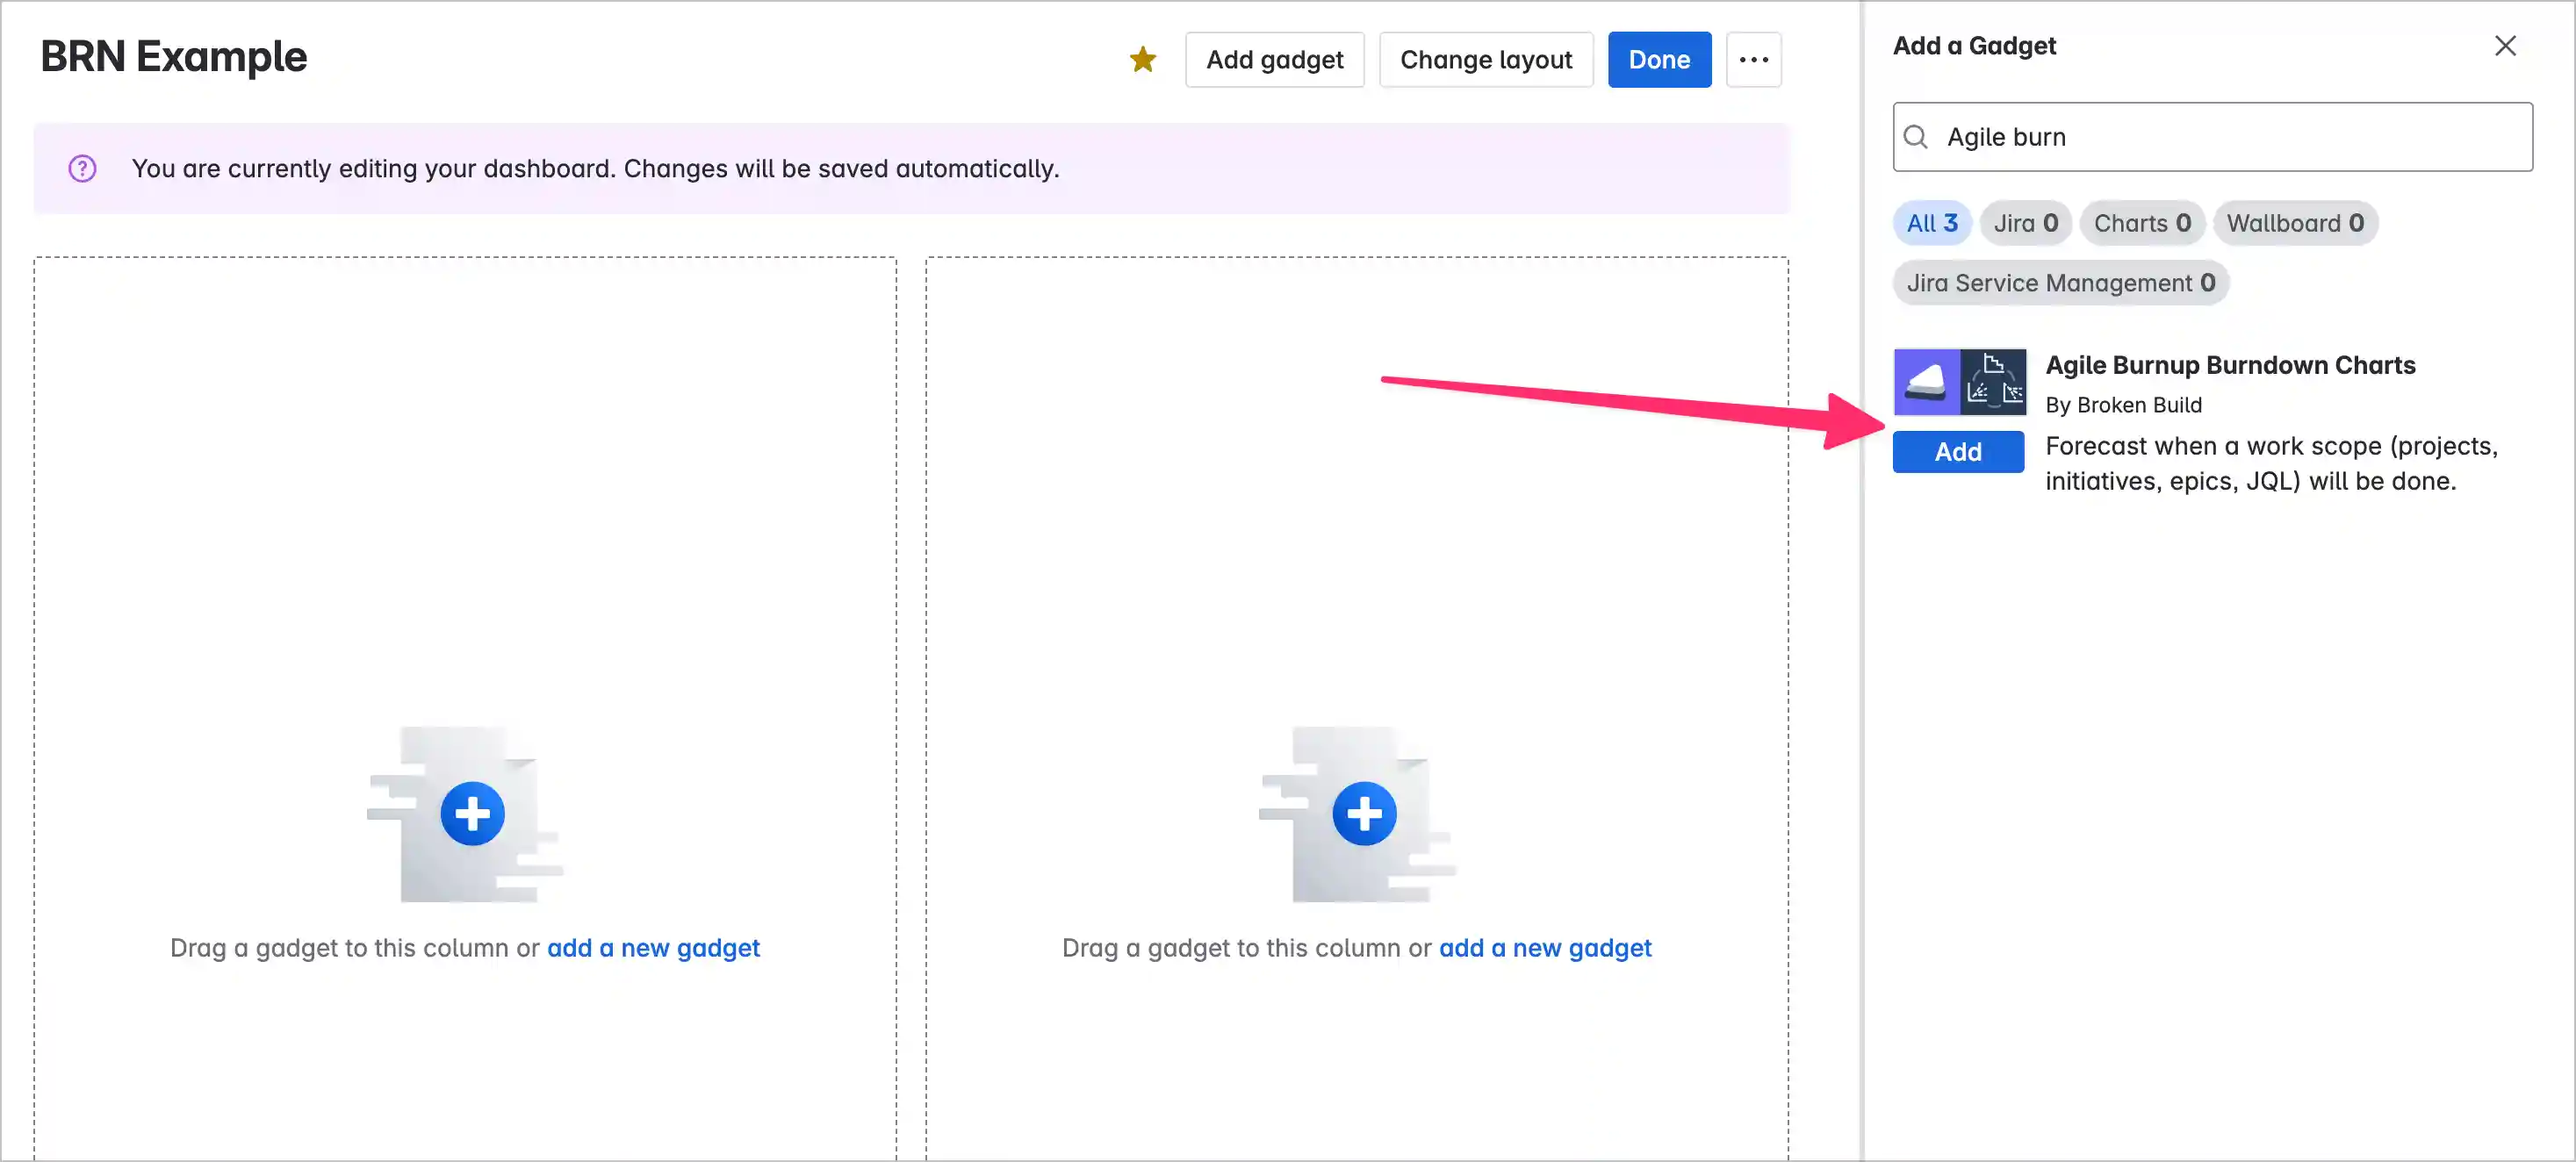
When the app is installed, open your Jira Dashboard and search for the gadget named Agile Burnup Burndown Charts:
Burndown charts are valuable tools in Agile methodology and Scrum frameworks, providing teams with a clear, visual representation of their progress and helping them stay on track.
No, you cannot mix different board types since this does not make sense: one operates in sprints, the other in intervals. However, you can use various data sources to compare the scopes of both Scrum and Kanban boards: Epic, Release, or even custom JQL can help with this problem.
Yes, you can use the Issue filter collapse in the settings sidebar to select the Issue type filter:


.svg)


.png)
