
Thank you! Your submission has been received!
Oops! Something went wrong while submitting the form.


The Jira scope change report gives teams and stakeholders a clear view of how sprint commitments evolve, showing exactly what was added, removed, or re-estimated during each sprint. It helps uncover the root causes of missed goals, improves accountability, and makes scope creep visible across teams and timeframes.
Unlike Jira’s native Velocity report, which only shows commitment versus completed work, the Agile Velocity Chart Gadget app provides full scope change metrics with detailed breakdowns directly on your Jira Dashboard.
✅ Scrum Master / Agile Coach: I use the Jira scope change report to spot scope creep early and show the team how unplanned additions or re-estimates impact sprint outcomes. It helps drive conversations about commitment reliability during retrospectives.
✅ Product Owner: The Scope change report in Jira helps me explain why sprint goals were missed or adjusted. By showing added or removed items, I can set clearer expectations with stakeholders and negotiate trade-offs.
✅ Release Train Engineer (RTE): I rely on the Scope change graph to monitor scope stability across teams in the ART. When I see repeated changes, I can address systemic issues during PI planning or ART syncs.
✅ Product Manager: I track whether roadmap items are being delivered as planned or if project scope changes and volatility are jeopardizing release commitments. This visibility helps me prioritize and adjust the roadmap based on reality.
✅ Lean Portfolio Manager (LPM): I use the Jira scope change report to assess delivery predictability. If the scope frequently changes, I know how to adjust investment discussions and manage risks at the portfolio level.


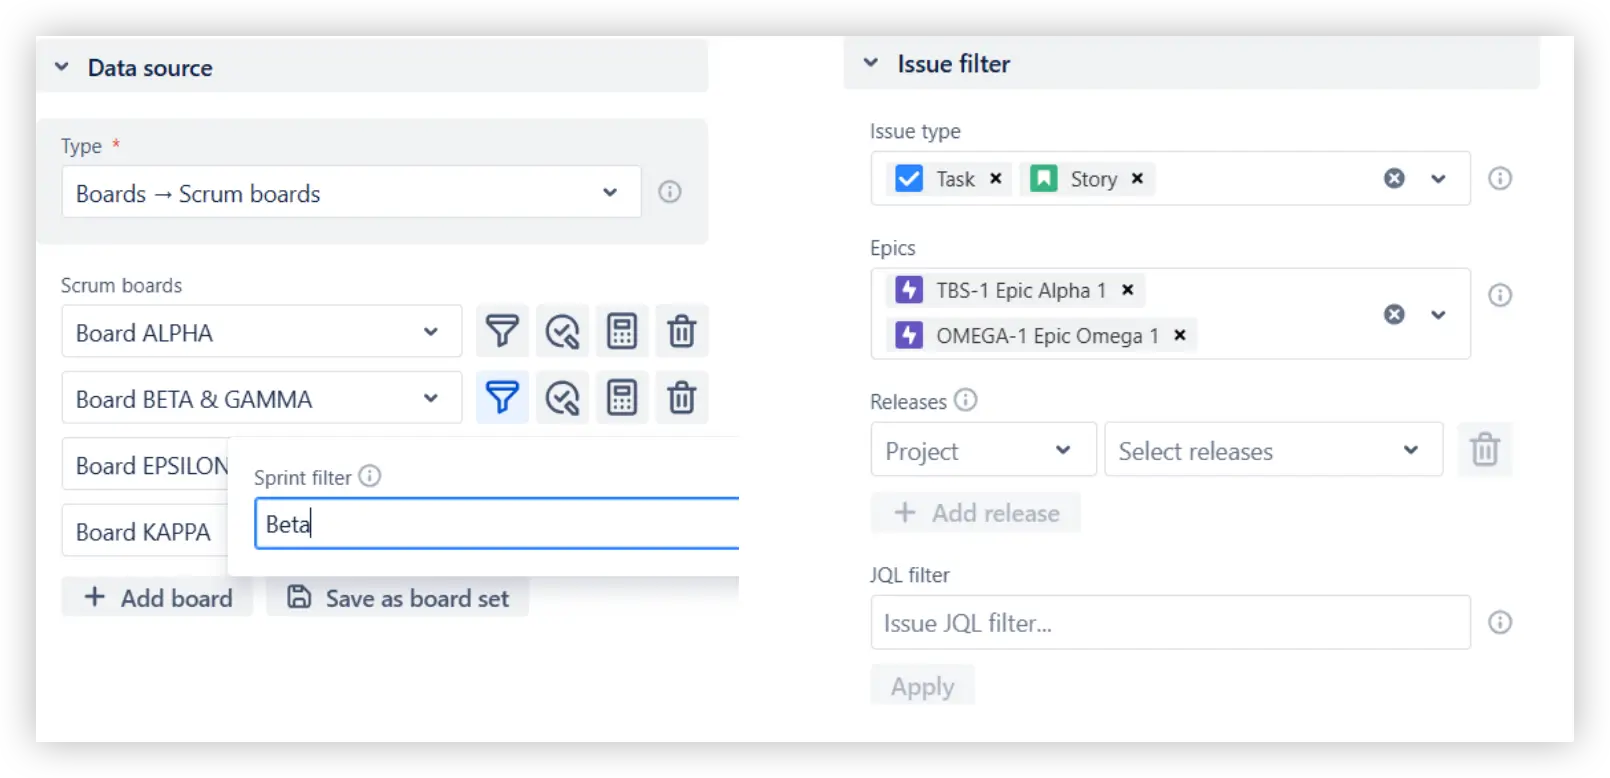
Adjust what’s included in the Scope change chart in Jira to focus on the data that matters most. You can select one or multiple boards as the data source, filter sprints to clean up the timeline, or narrow the scope with issue filters. For example, analyze only user stories, limit the view to a specific epic or release, or apply custom JQL for complete flexibility.
✅ This feature is helpful for:
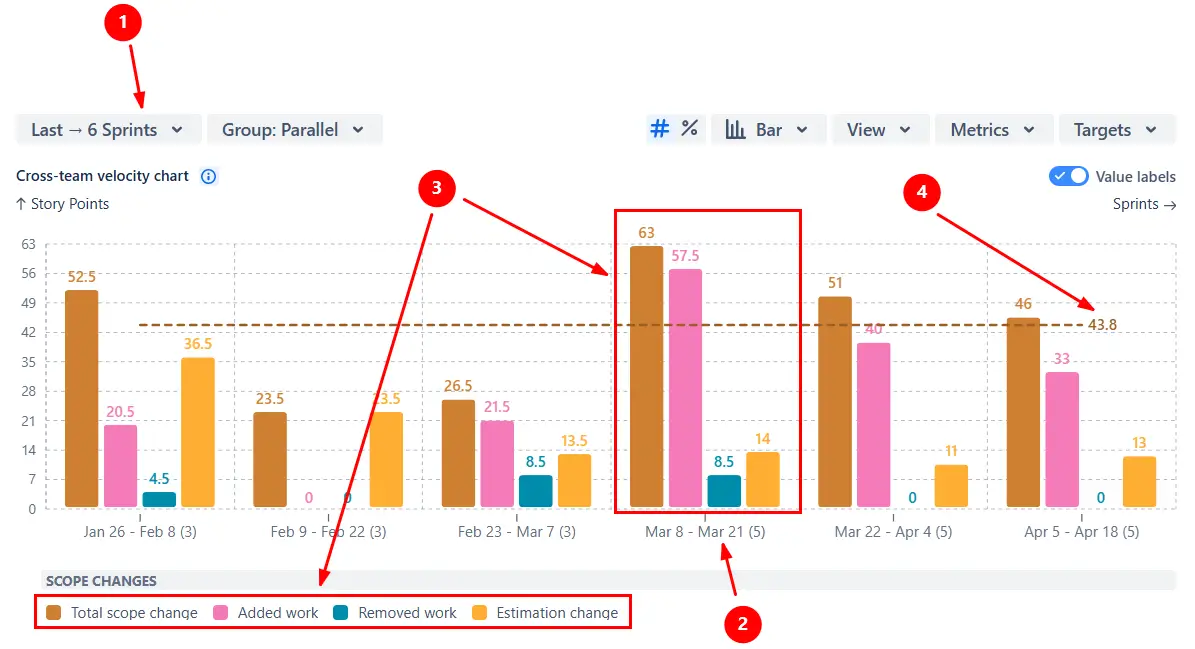
See why exactly the scope changed during each sprint - whether it’s through added items, removed work, or re-estimation. The Jira scope change report not only shows totals but also lets you drill down into the issue list, so you know precisely which issues contributed to the change and who worked on them.
✅ This feature is helpful for:
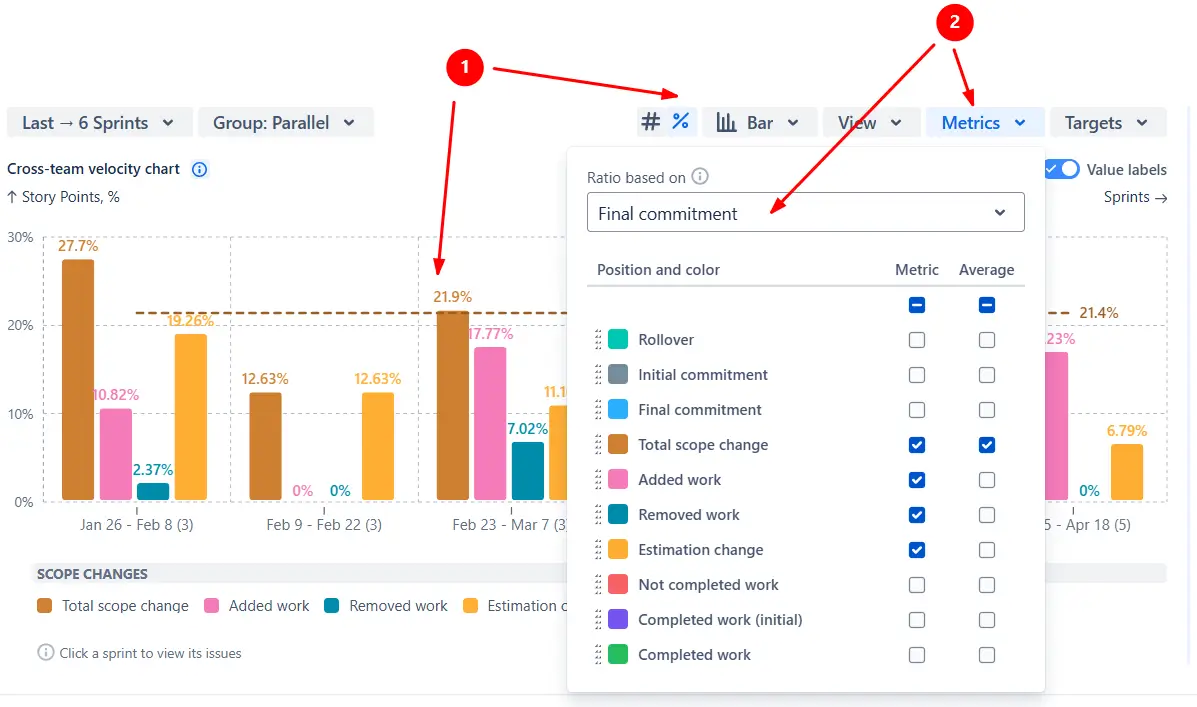
Switch the Sprint scope change report from absolute numbers to percentages (1️⃣) for easier comparison across sprints and teams. In this view, scope change is shown relative to the sprint commitment. You can choose whether the percentage is calculated against the initial commitment (scope at the start of the sprint) or the final commitment (scope at the end) (2️⃣).
✅ This feature is helpful for:
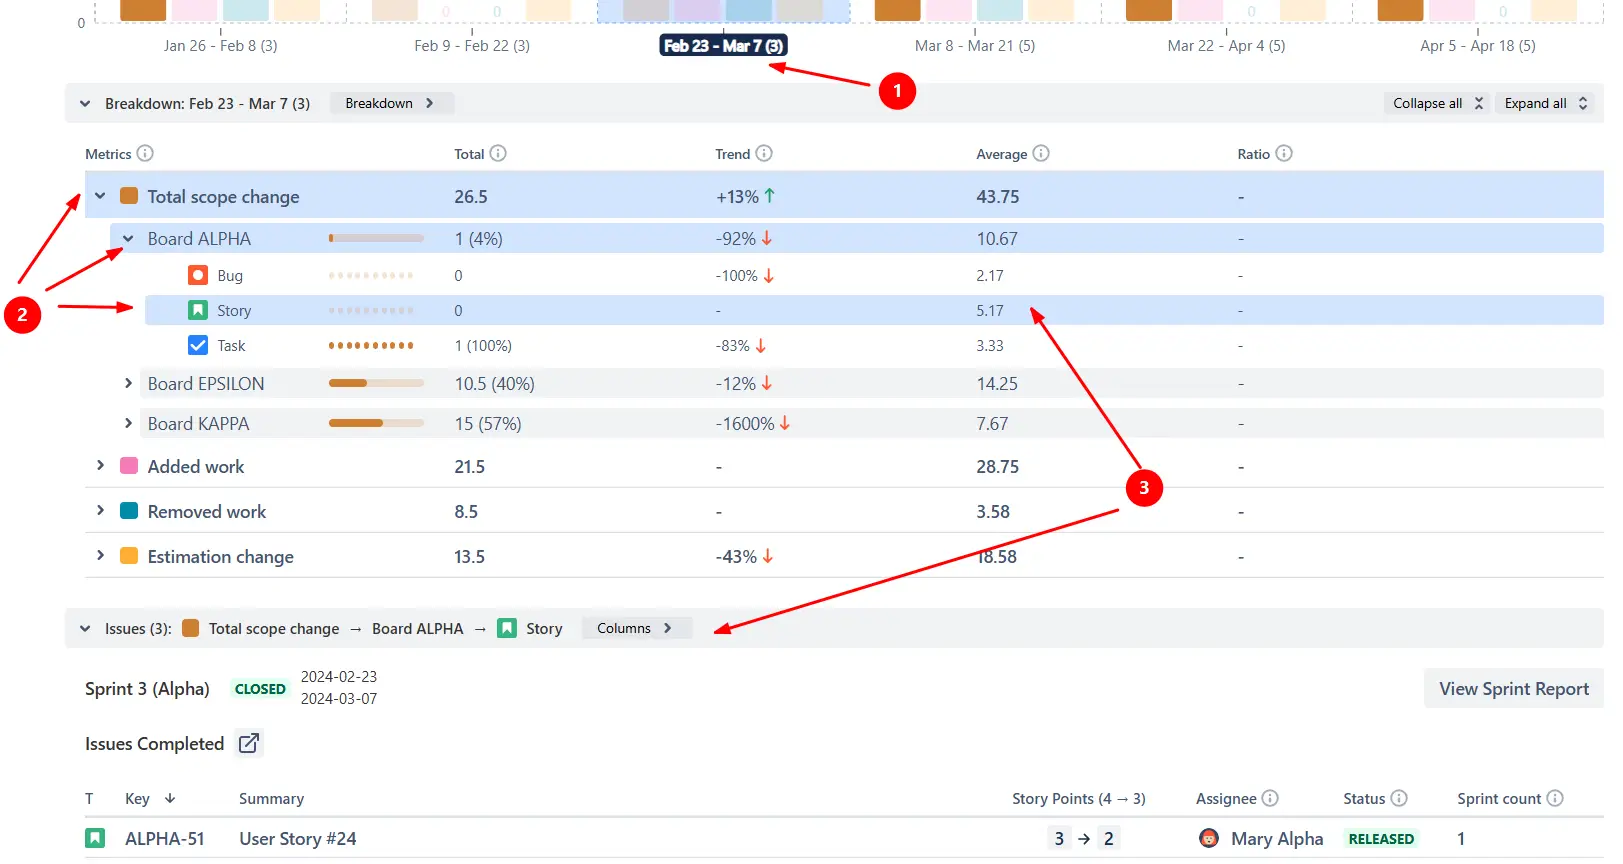
Go beyond totals and see what’s behind each scope change metric. By clicking a sprint or interval (1️⃣), you can open the Breakdown table and segment data by any Jira field - board, project, issue type, epic, and many others. You can apply two levels of nesting (e.g., metric → board → issue type (2️⃣)) to uncover trends and anomalies.
From the Breakdown table, click Find issues to drill down into the exact work items that contributed to the change, complete with their story points, assignee, and status (3️⃣).
✅ This feature is helpful for:
Put scope changes into context by adding average and target lines to the Jira scope change report. Averages give you a historical benchmark, while targets define acceptable thresholds for scope creep.
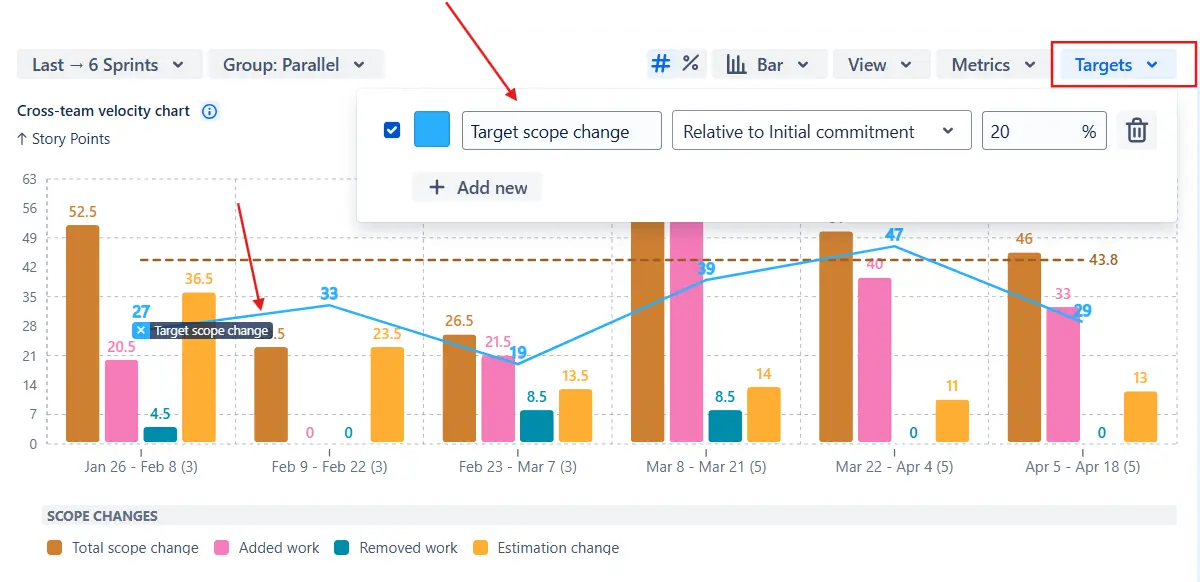
✅ This feature is helpful for:
Adapt the Jira Scope change report view to match your analysis needs and dashboard layout.
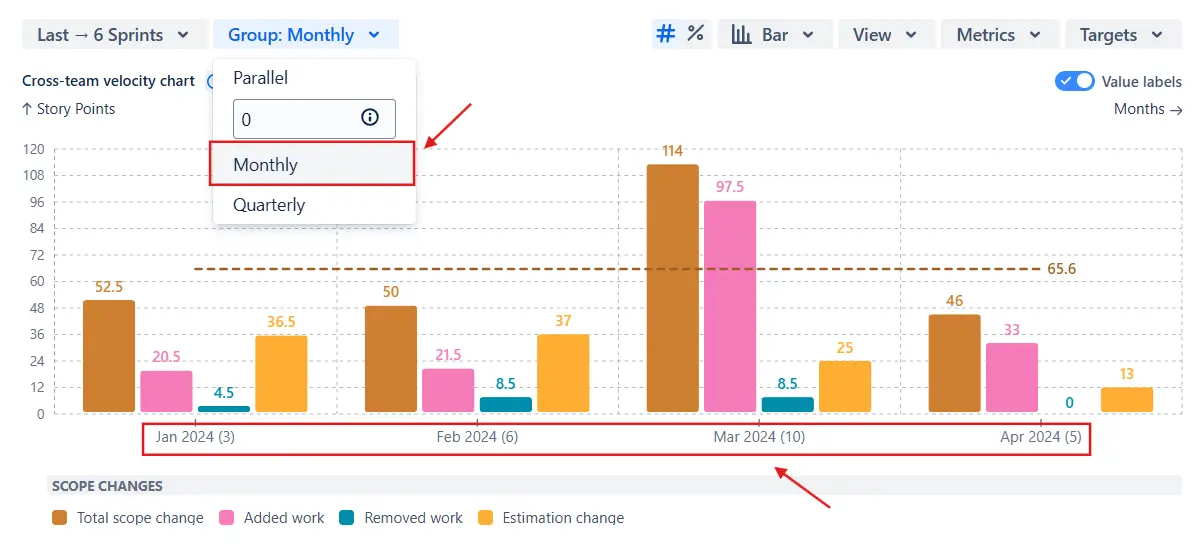
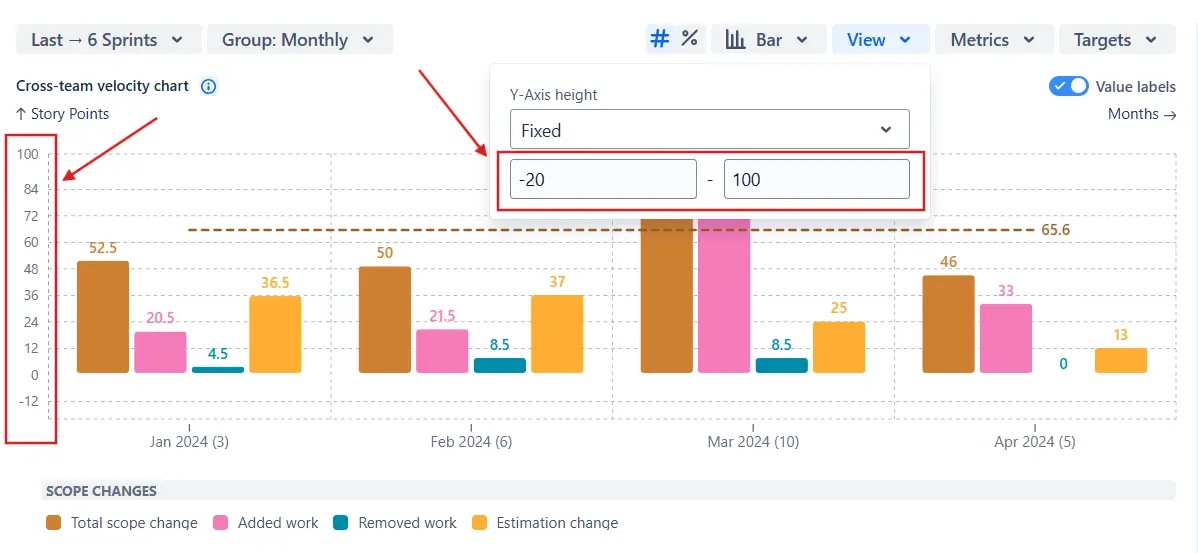
✅ These features are helpful for:
Jira does not include a Scope change report. The built-in Velocity report only compares committed vs. completed work for a single team. It does not capture added, removed, or re-estimated items, making it impossible to see what contributed to changes in scope or why commitments are frequently missed.
Use our examples to build your use cases on the Jira Dashboard.
Both Jira apps (plugins) used in these examples have a 30-day free trial and are completely free for teams under 10 people:
The Agile Reports and Gadgets app also includes the Scope change chart functionality and a multitude of other reports/charts.
When switching the Scope change report to percentage view, you can choose either the initial or final commitment as the ratio basis to gain clarity on how much the commitment shifted during the sprint.
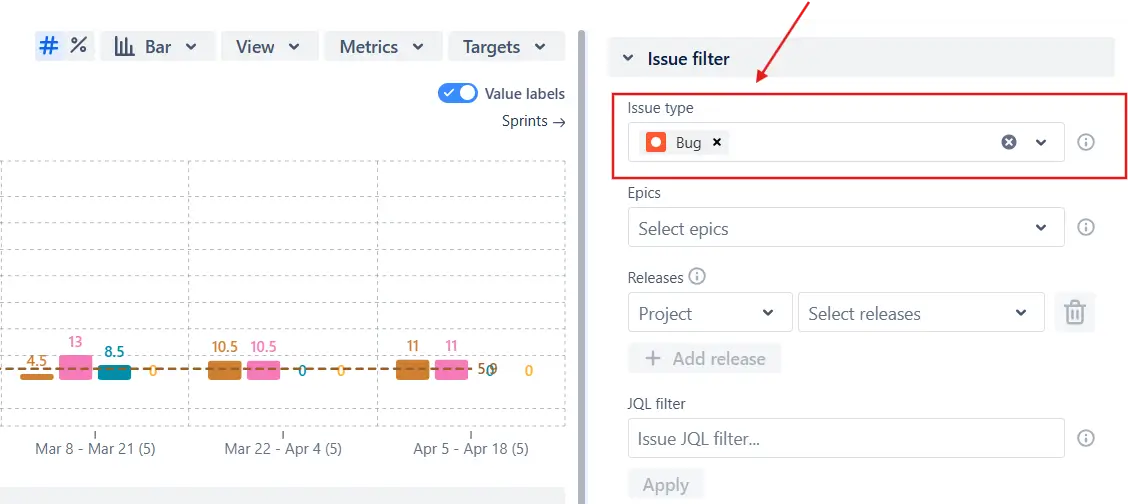
Yes. By applying issue type filters (e.g., Bugs) or JQL, you can isolate how much of the added scope comes from urgent defect work. This helps quantify the impact of production support on sprint commitments and long-term delivery goals:
Yes. The Scope change report can also display metrics such as Completed work (the total value delivered during a sprint/interval) or Completed work (initial) - the portion of the original sprint goal that was completed:
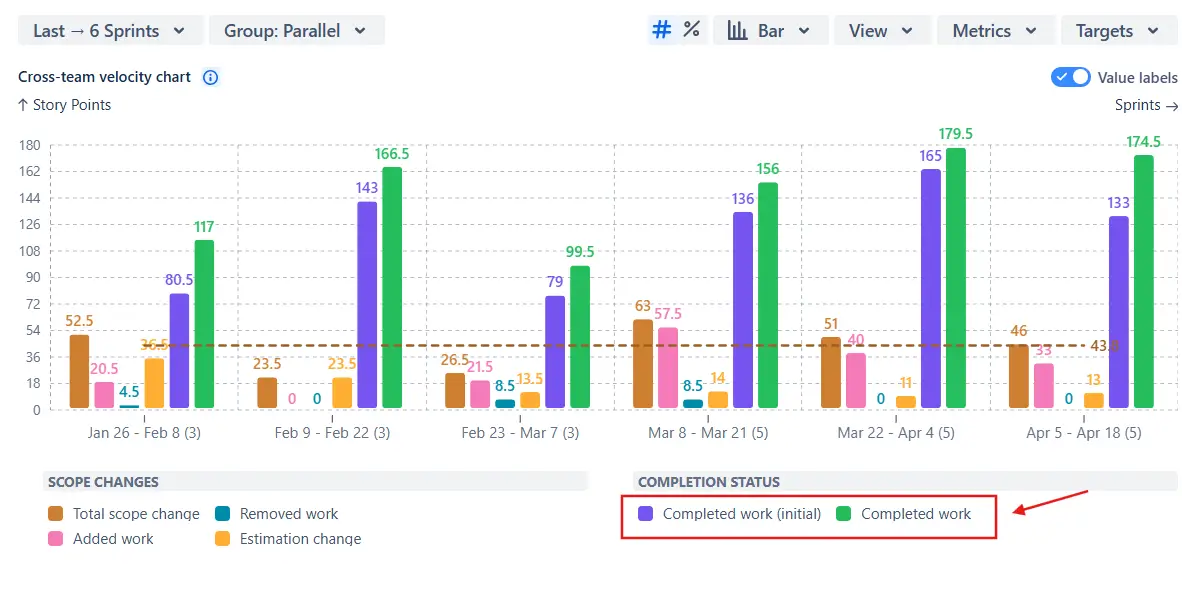
When viewed together, throughput metrics show how much work was delivered, while scope change metrics explain why commitments shifted. Combining both gives a complete picture of whether missed commitments were caused by low throughput, unstable scope, or a mix of both.
You can configure the Jira scope change report to use other estimation fields, such as issue count, effort, business value, or any custom numeric field, or even set different estimation fields for different teams. This flexibility ensures scope changes are measured in a way that matches your team’s workflow:


.svg)


.png)
.png)
