
Thank you! Your submission has been received!
Oops! Something went wrong while submitting the form.


The Benchmarking velocity chart helps Agile and SAFe teams put their delivery performance into context. Instead of looking at isolated team results, it shows how each team’s velocity compares to program-wide benchmarks (averages, medians, or percentiles), revealing trends, outliers, and consistency across multiple boards or projects. With customizable metrics, targets, and flexible timeframes, the Agile Velocity Chart Gadget app turns raw velocity data into actionable insights for planning and performance improvement.
✅ Scrum Master / Agile Coach: I rely on team velocity benchmarking to help the team see where they stand in relation to others in the program. It’s a powerful way to drive discussions about sustainable pace and realistic planning.
✅ Release Train Engineer (RTE): I use the Benchmarking chart in Scrum to compare delivery consistency across all teams in the ART. The benchmarks help me spot outliers, identify where velocity fluctuates, and bring those insights to PI planning and ART syncs.
✅ Product Manager: The Team velocity benchmarking chart helps me understand whether the delivery pace aligns with the roadmap expectations. By comparing teams against historical averages and percentiles, I can see which workstreams need more capacity or stability.
✅ Engineering Manager: I use the chart to assess delivery trends over time and to validate whether changes in process or team composition are improving predictability and throughput.
✅ Program Manager: Team velocity benchmarking provides a high-level view of program health. It helps me see which teams consistently deliver above or below expectations and whether overall ART performance is improving across PIs.


The Benchmarking velocity chart allows you to compare how different teams perform across multiple sprints or time intervals, all in a single view. Switch between metrics using the menu above the chart to shift the focus - for example, from Completed work to Final commitment or Total scope change.
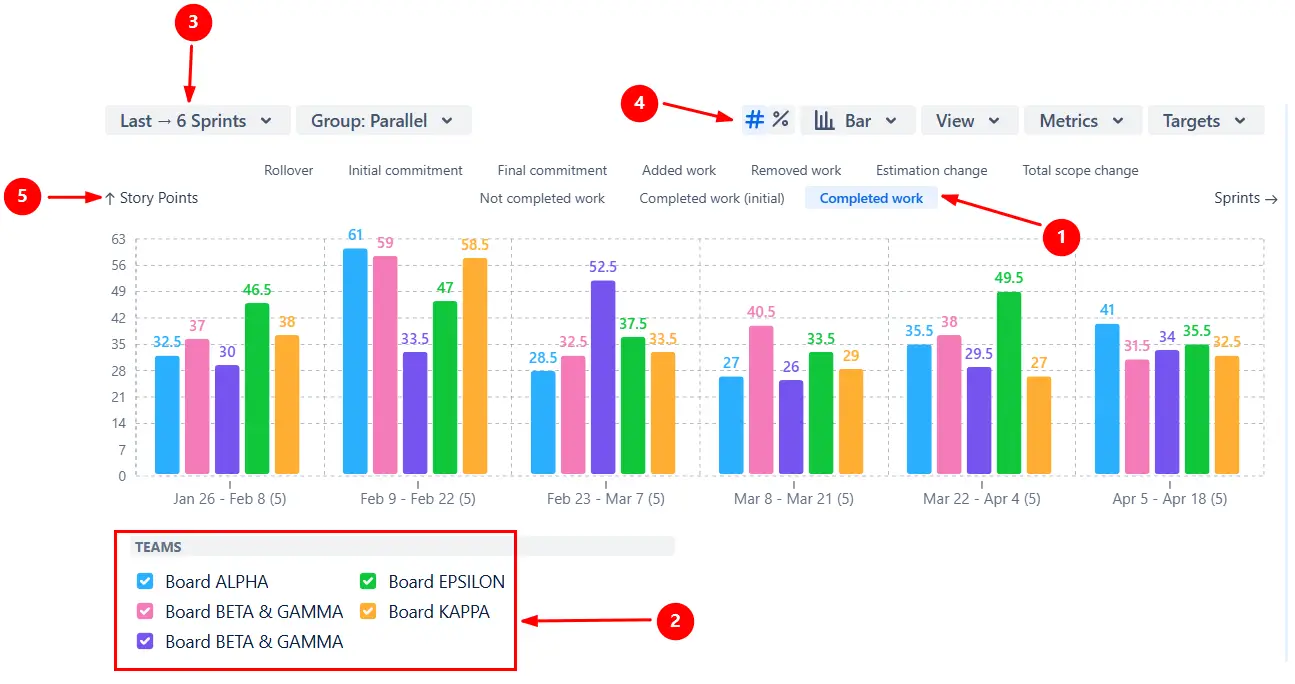
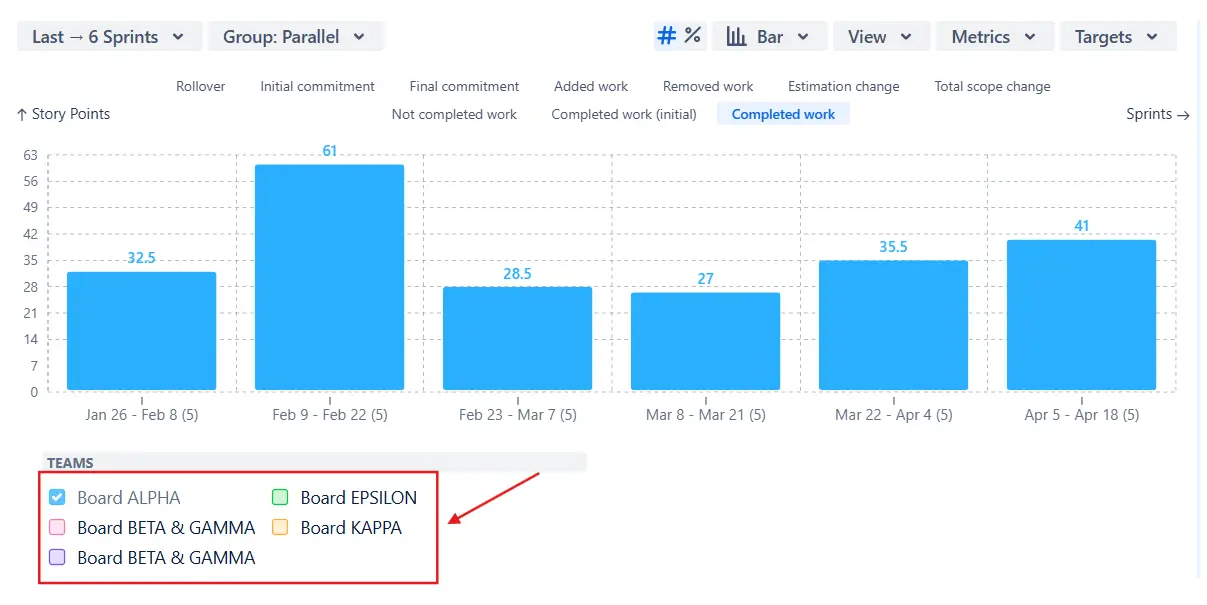
Use the checkboxes below the chart to toggle the teams on and off to simplify comparisons or highlight specific ones during performance reviews:
✅ This feature is useful for:
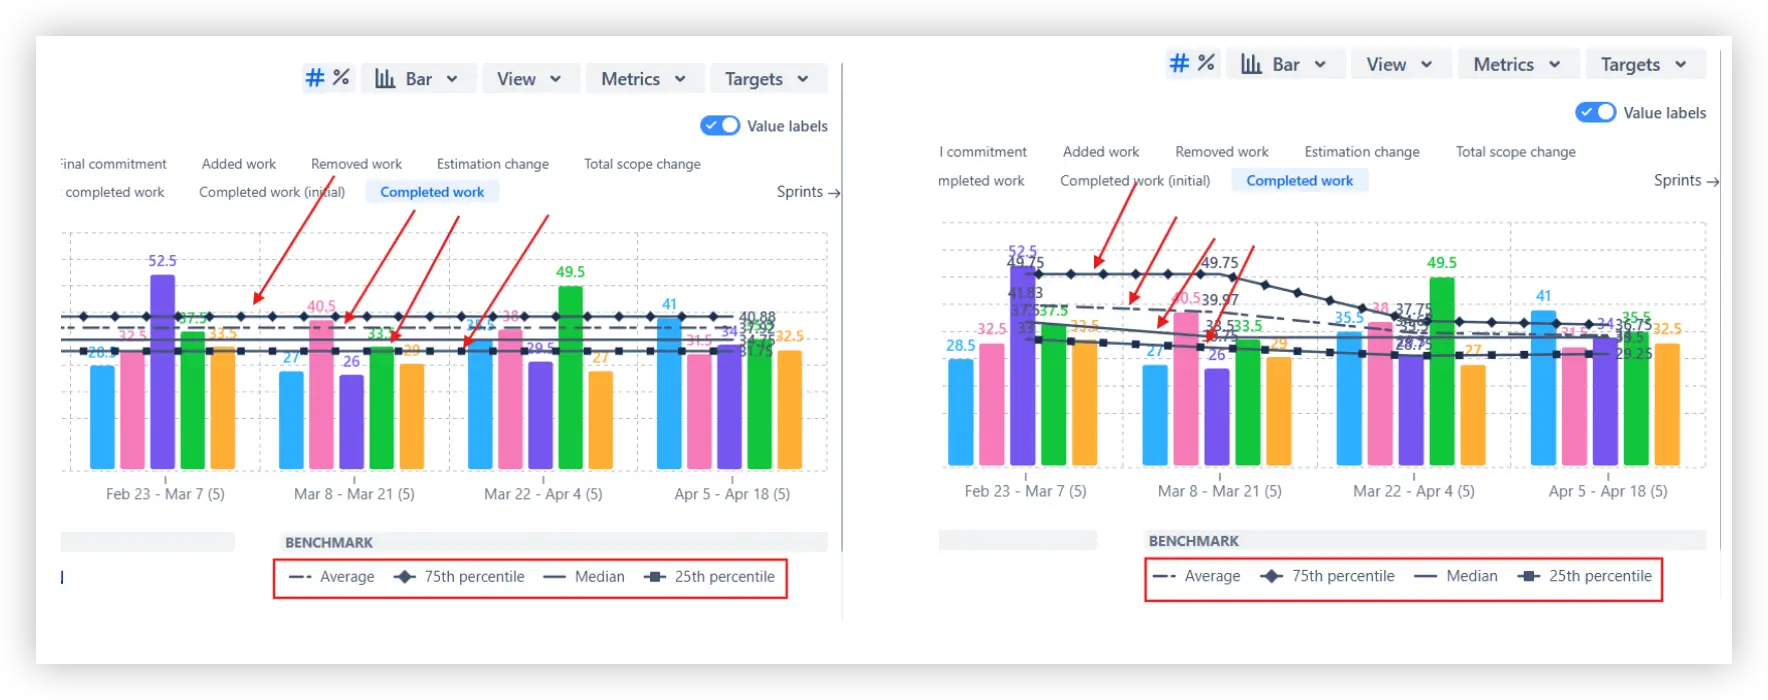
Add statistical reference lines - average, median, and 25th/75th percentiles - to see how each team’s velocity compares to overall performance benchmarks. Benchmarks are automatically calculated from all included teams for the selected metric (for example, Completed work or Initial commitment). You can choose whether the calculation is based on all sprints or only a selected number of past sprints, creating a moving average that adapts to recent performance.
✅ This feature is useful for:
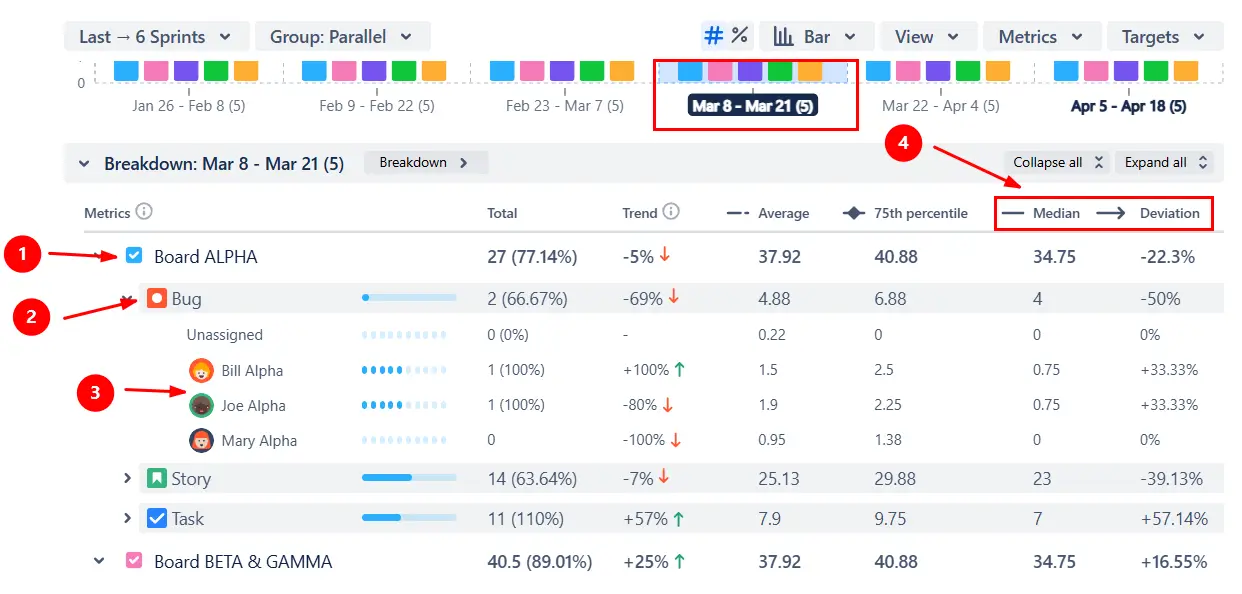
Click any sprint or interval to open the Breakdown view. It shows the results for each team (1️⃣), with up to two additional nested levels of grouping - for example, by issue type (2️⃣) or assignee (3️⃣).
When the Deviation option is enabled in the Metrics menu, the Breakdown also displays each team’s deviation from the selected benchmark (average, median, or percentile) (4️⃣).
✅ This feature is useful for:
You can switch the Benchmarking chart in Scrum from absolute values to the percentage view (1️⃣) to make comparisons between teams and sprints of different sizes more meaningful. In the percentage view, all metrics are normalized against the selected basis: either Initial commitment or Final commitment. Choose the desired ratio basis in the Metrics menu (2️⃣).
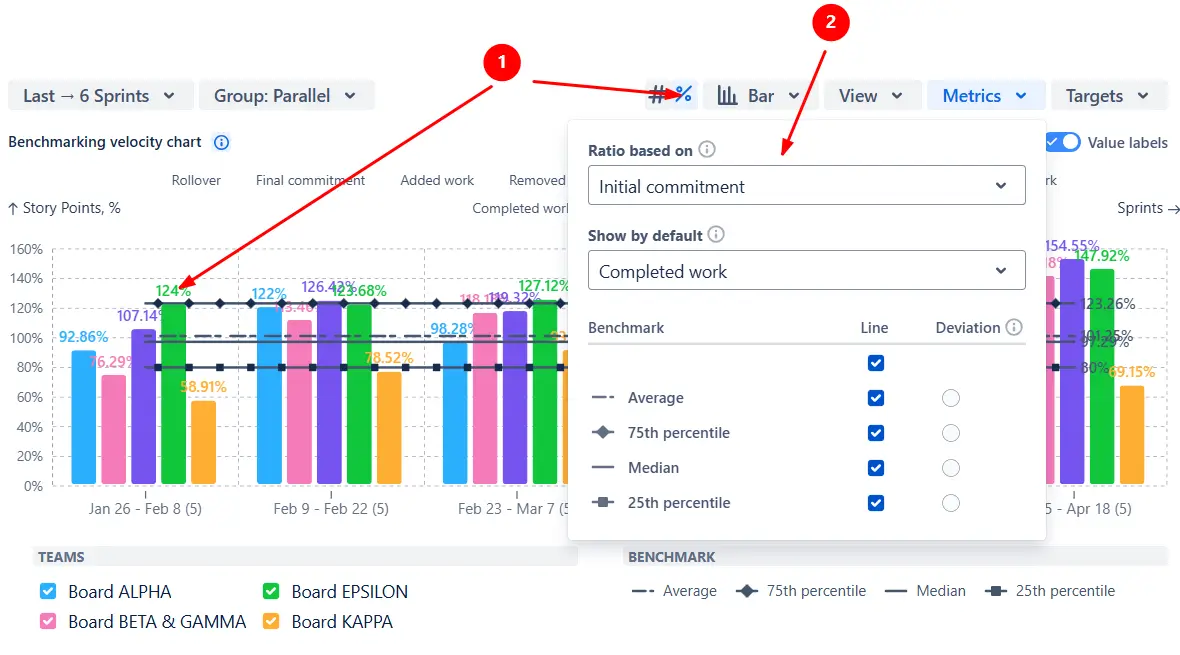
✅ This feature is useful for:
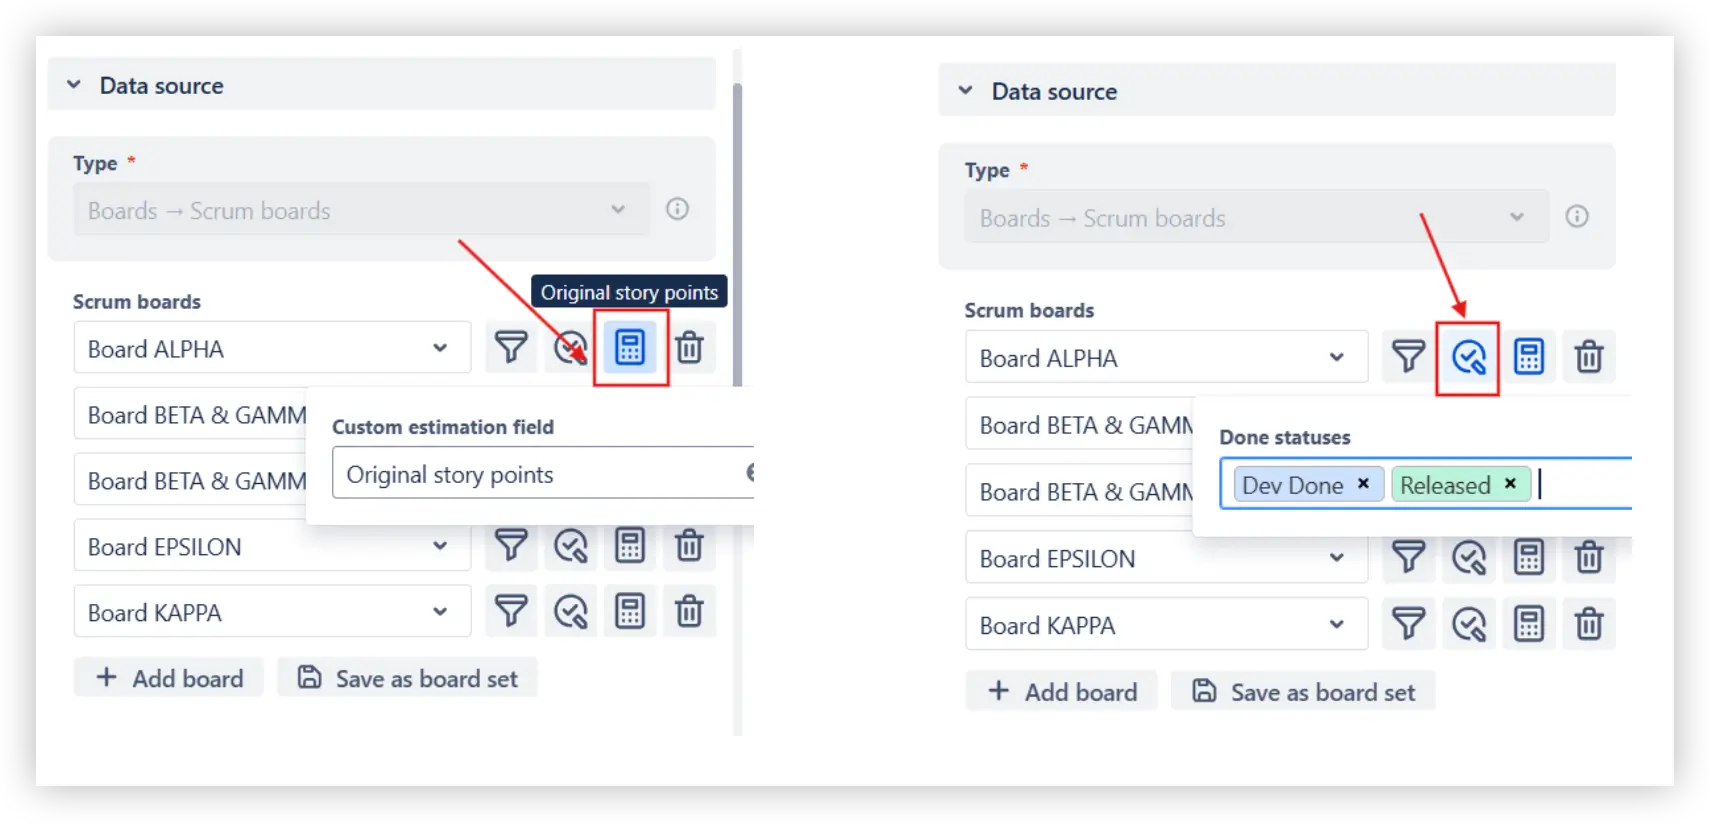
Each team on the Benchmarking velocity chart can use its own calculation rules to ensure fair and accurate comparisons. Next to the board name under Data source, you can define a custom estimation field and configure Done statuses individually for each board.
Whether one team tracks story points and another counts issues, or their workflows mark work as Done at different stages, the chart keeps benchmarks consistent.
The Benchmarking velocity chart gives you full control over which sprints are included in the analysis. Filter them by name when several teams share the same board, or define how many past and upcoming sprints to include. You can also choose whether to display closed, active, or future sprints.

✅ This feature is useful for:
Jira doesn’t have a native Benchmarking velocity chart. Its built-in Velocity report is useful for quick sprint reviews but offers only a minimal view of team performance:
The Benchmarking velocity chart provides a more complete and configurable view of how teams perform across an ART or program.
✅ Compare velocities across teams in a single chart.
✅ Display benchmarks like average, median, and 25th/75th percentiles to track performance consistency.
✅ Add target lines to visualize delivery KPIs and expected velocity ranges.
✅ Switch between absolute and percentage views for fair comparisons across teams.
✅ Adjust calculation settings per team, defining their own estimation fields and “done” statuses.
✅ Use filters to control which issues, boards, or sprints are included.
✅ Drill down into the Breakdown to analyze results by team, issue type, or assignee.
✅ Normalize performance data to ensure fair benchmarking.
Explore our examples to create your own Jira Dashboard use cases.
Both Jira plugins featured here offer a 30-day free trial and are completely free for small teams of up to 10 users:
The Agile Reports and Gadgets app additionally provides the Velocity benchmarking report, along with many other insightful reports and visualizations.
Benchmarking gives teams context for their results. Instead of looking at velocity in isolation, teams can see how their delivery compares to program-wide averages or percentiles. This visibility helps identify outliers (both high and low performers) and sparks data-driven conversations about what drives those differences.
By tracking benchmarks over time, teams can also see whether process changes, workflow improvements, or capacity adjustments actually lead to more consistent delivery.
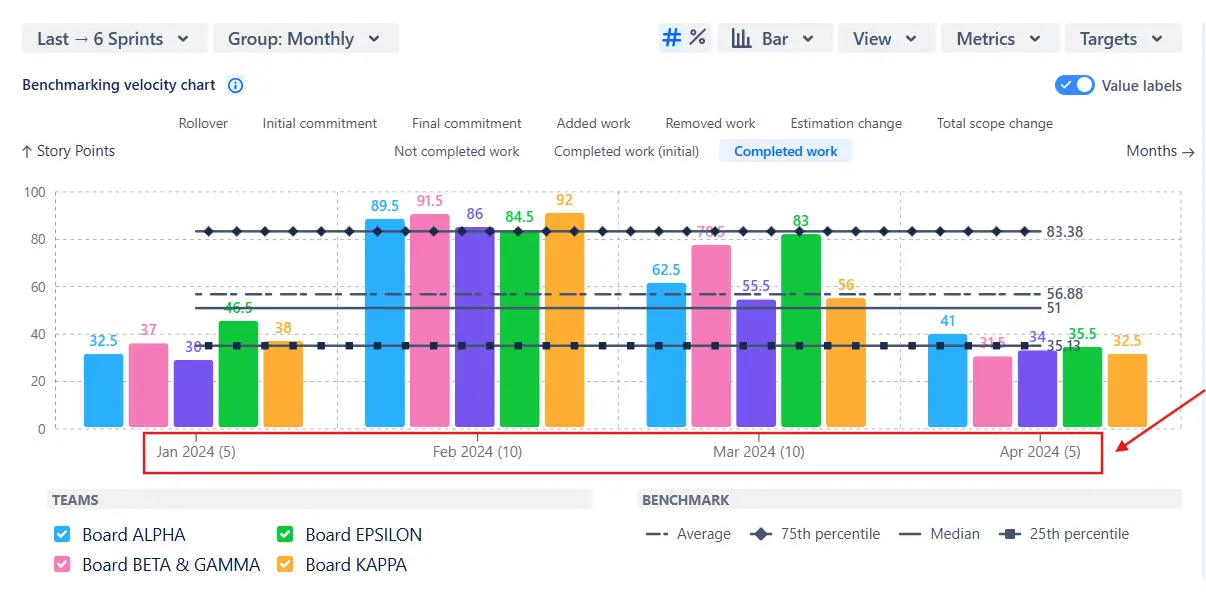
Yes. Although the Benchmarking velocity chart is only available for Scrum boards, it lets you switch the x-axis grouping from sprints to broader time intervals such as weeks, months, or quarters. This is especially useful when you’re combining multiple teams that don’t share the same sprint cadence or when you want to see long-term delivery trends across an ART or program:
Use a normal (mean or median) average when you want a stable, long-term benchmark that reflects overall delivery performance across many sprints. It’s best for tracking consistency and setting baseline expectations for team or program velocity.
Use a moving average when you want to focus on recent performance and see how velocity evolves after process changes or improvements. Because it updates dynamically, it helps identify whether new practices actually improved delivery stability.
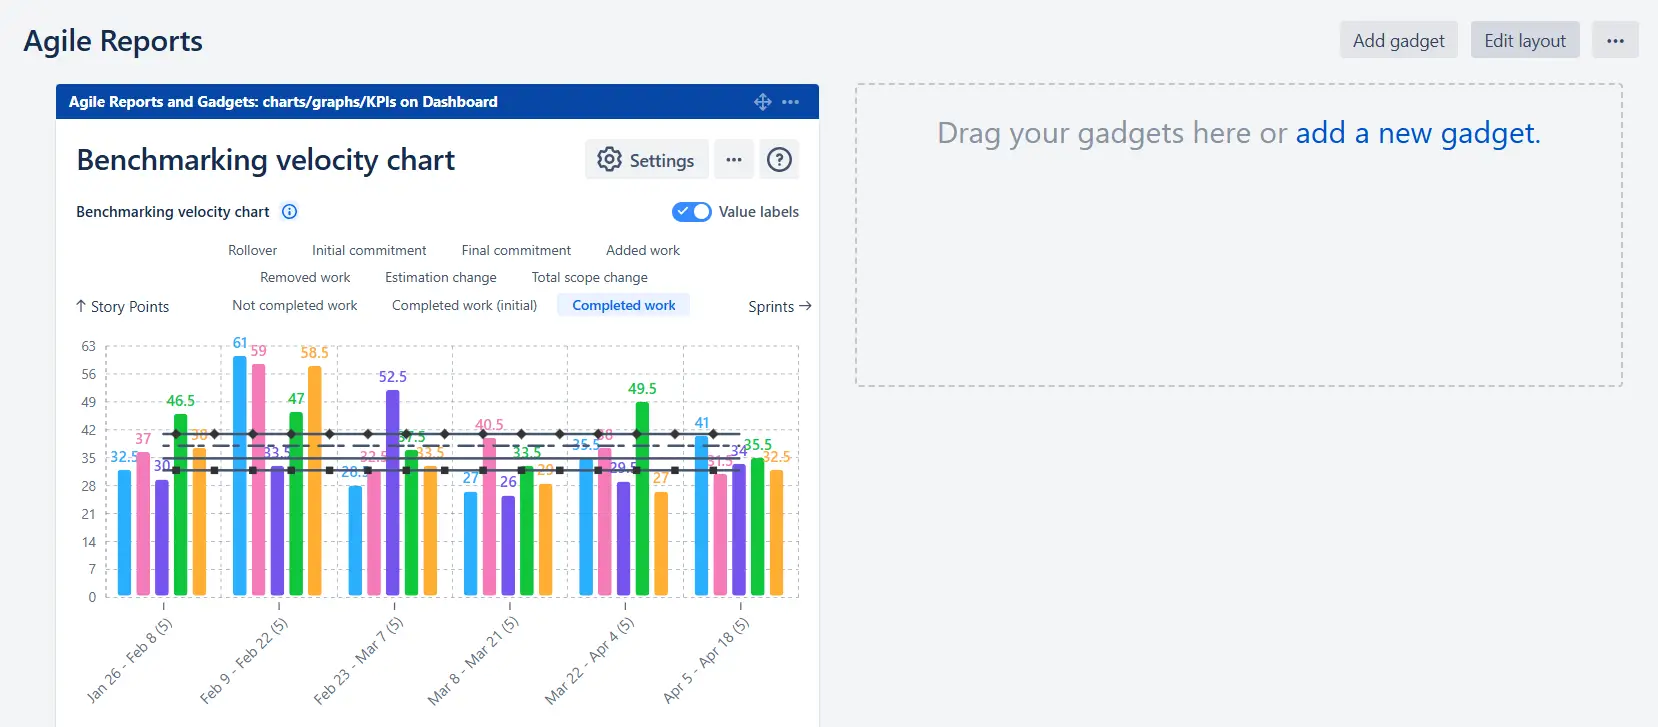
You can easily share the Benchmarking velocity chart by saving it as a gadget on a shared Jira dashboard. Once added, anyone with access to that dashboard can view the chart in real time with the same configuration you used. This is the best option for keeping program or ART reports visible to all stakeholders:
If you need to include the chart in external presentations or reports, you can also export it to PNG, CSV, or PDF:


.svg)


.png)
.png)
