
Thank you! Your submission has been received!
Oops! Something went wrong while submitting the form.


Agile teams succeed when they learn, adapt, and deliver consistently. But standard Jira reports only show progress at the sprint or team level, leaving a blind spot when it comes to individual contribution and delivery patterns.
That’s where the Jira burndown chart per user by Broken Build steps in and enables:
It helps you monitor individual delivery trends and throughput across Jira boards, empowering team leads, developers, and product managers to conduct data-informed reviews, give performance feedback, and make accurate delivery forecasts.
With Jira burndown chart by assignee, you finally get the insight Jira has been missing, right where your team works: 👉 Agile Burnup Burndown Charts
👨 Team leads: monitor individual delivery patterns across Jira boards to enable data-informed reviews and performance feedback sessions.
🐱 Developers and software engineers: visualize their own completed work over time to reflect on progress, improve consistency, and plan the future scope.
🧙 Product managers: see how contributors move work forward, sprint after sprint, to improve team predictability and delivery forecasting.


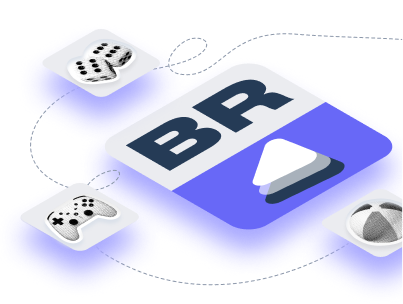
Use an Individual burndown chart to monitor how an individual contributor's cumulative delivery evolves across time. It reveals individual patterns and trends that support meaningful, data-driven performance discussions.
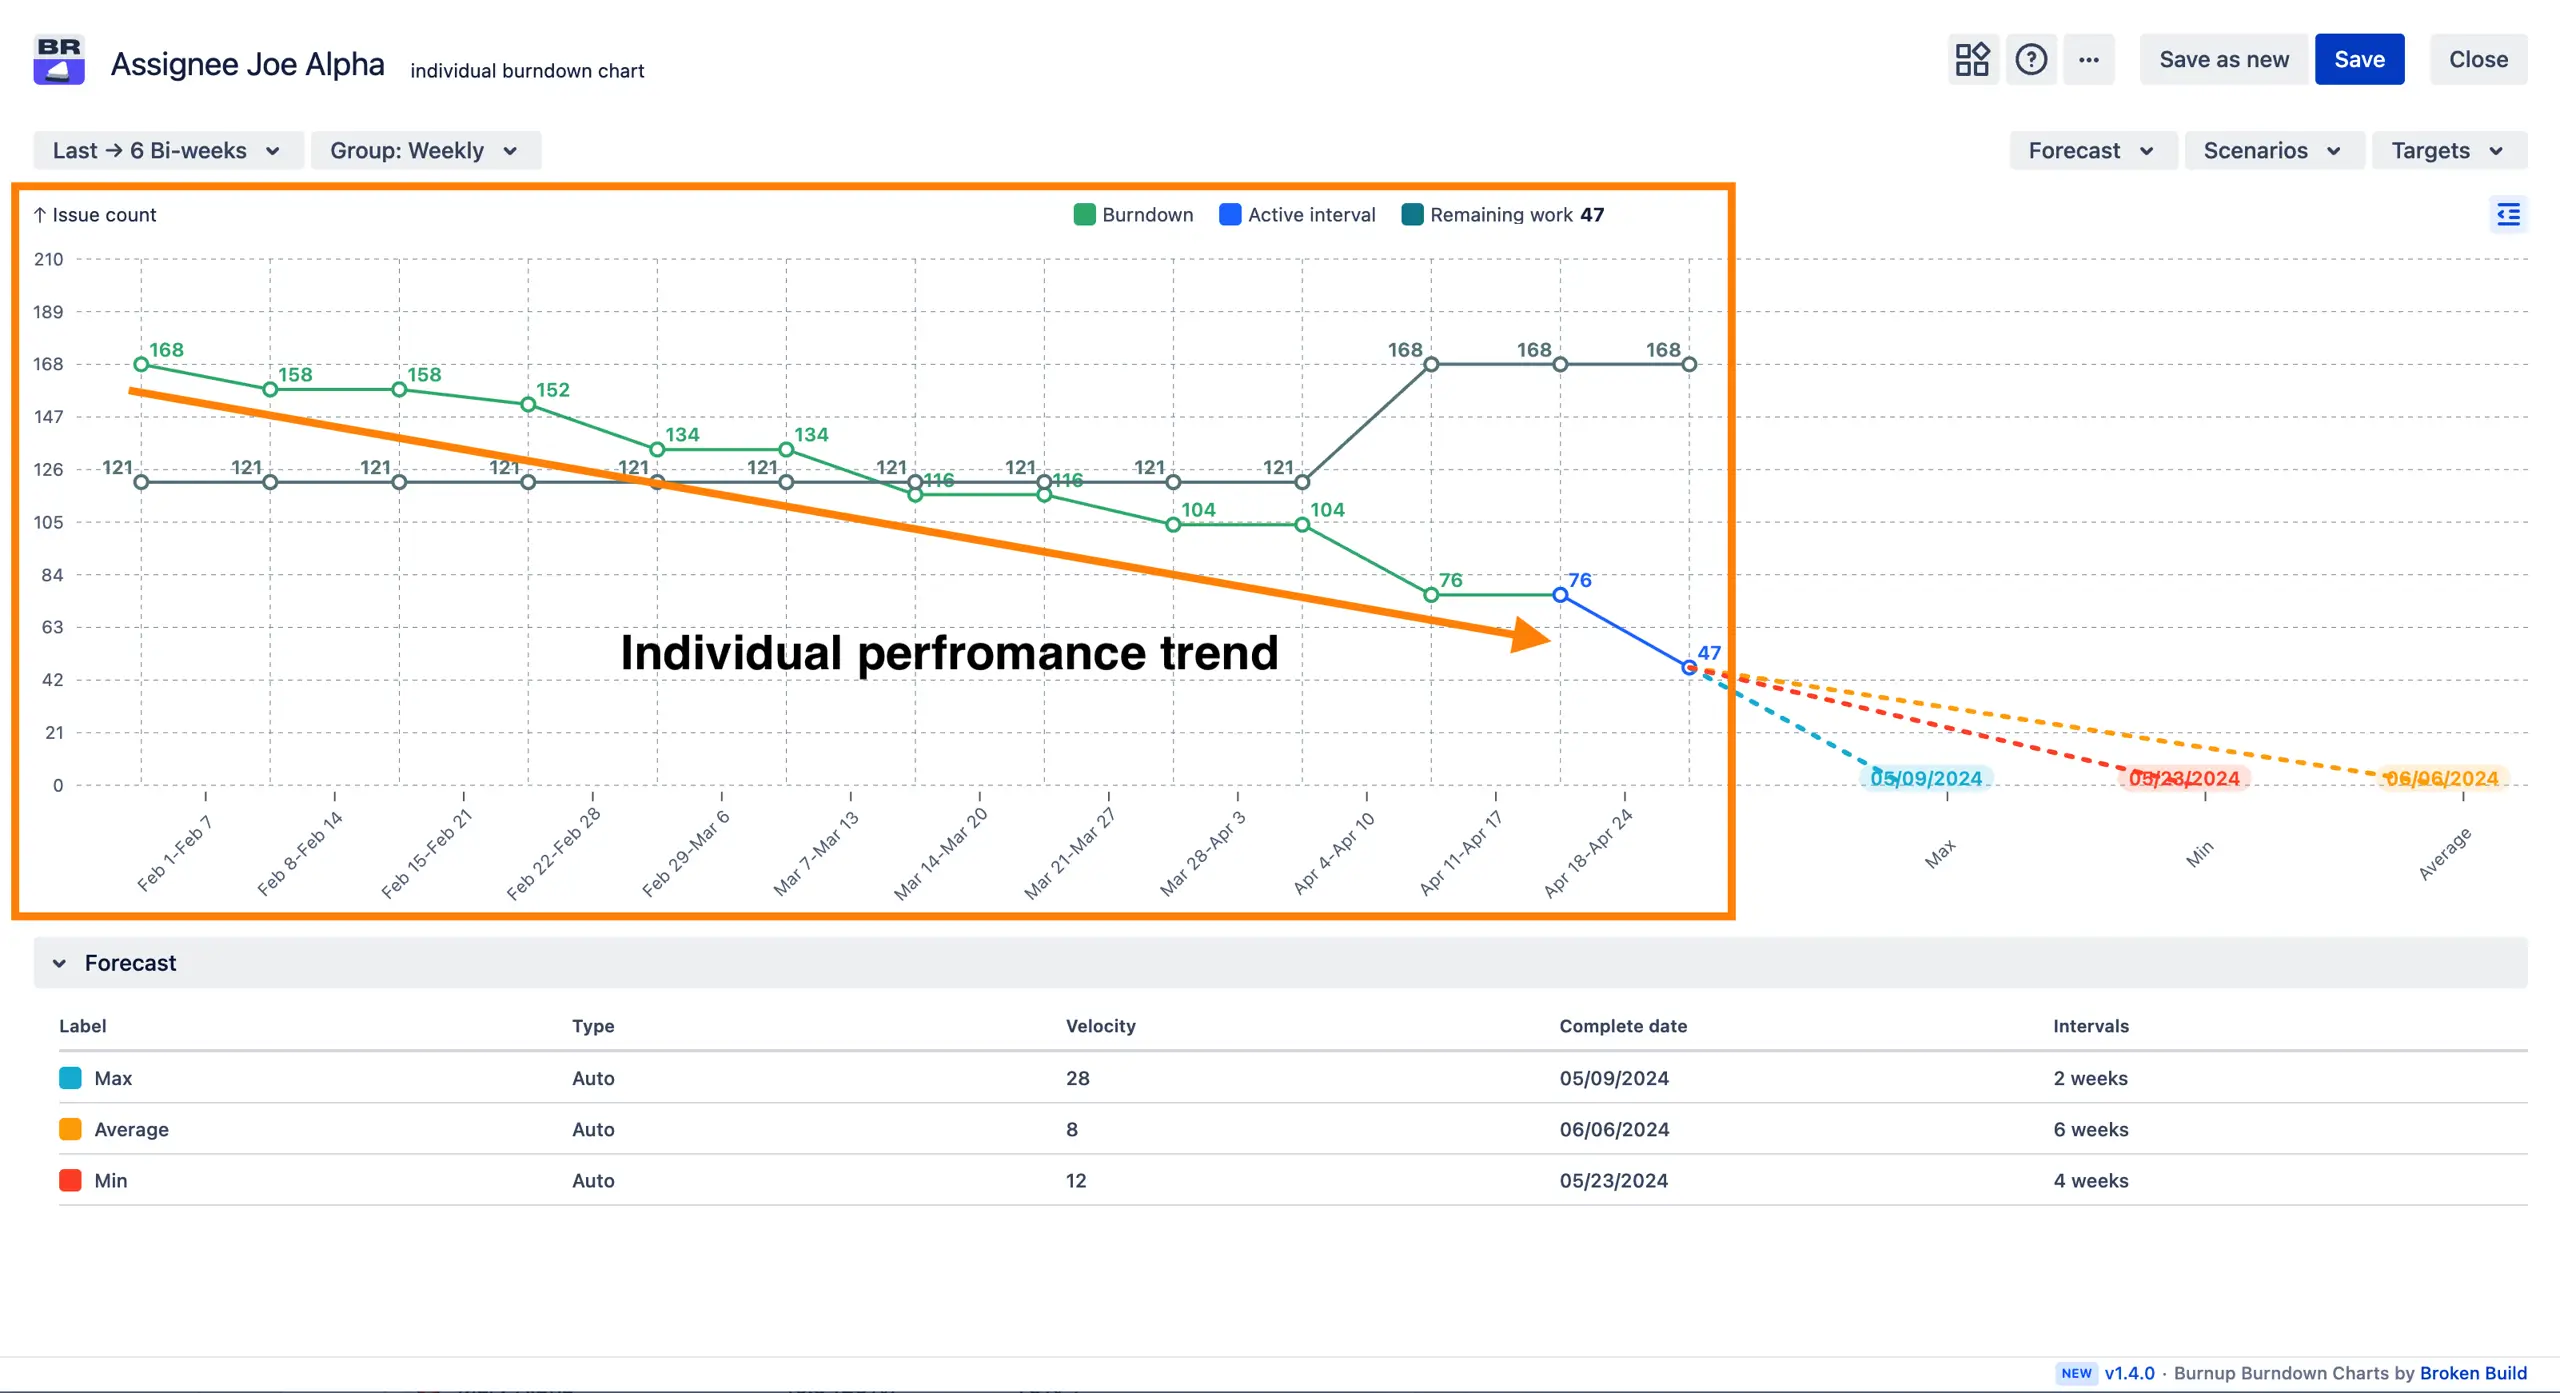
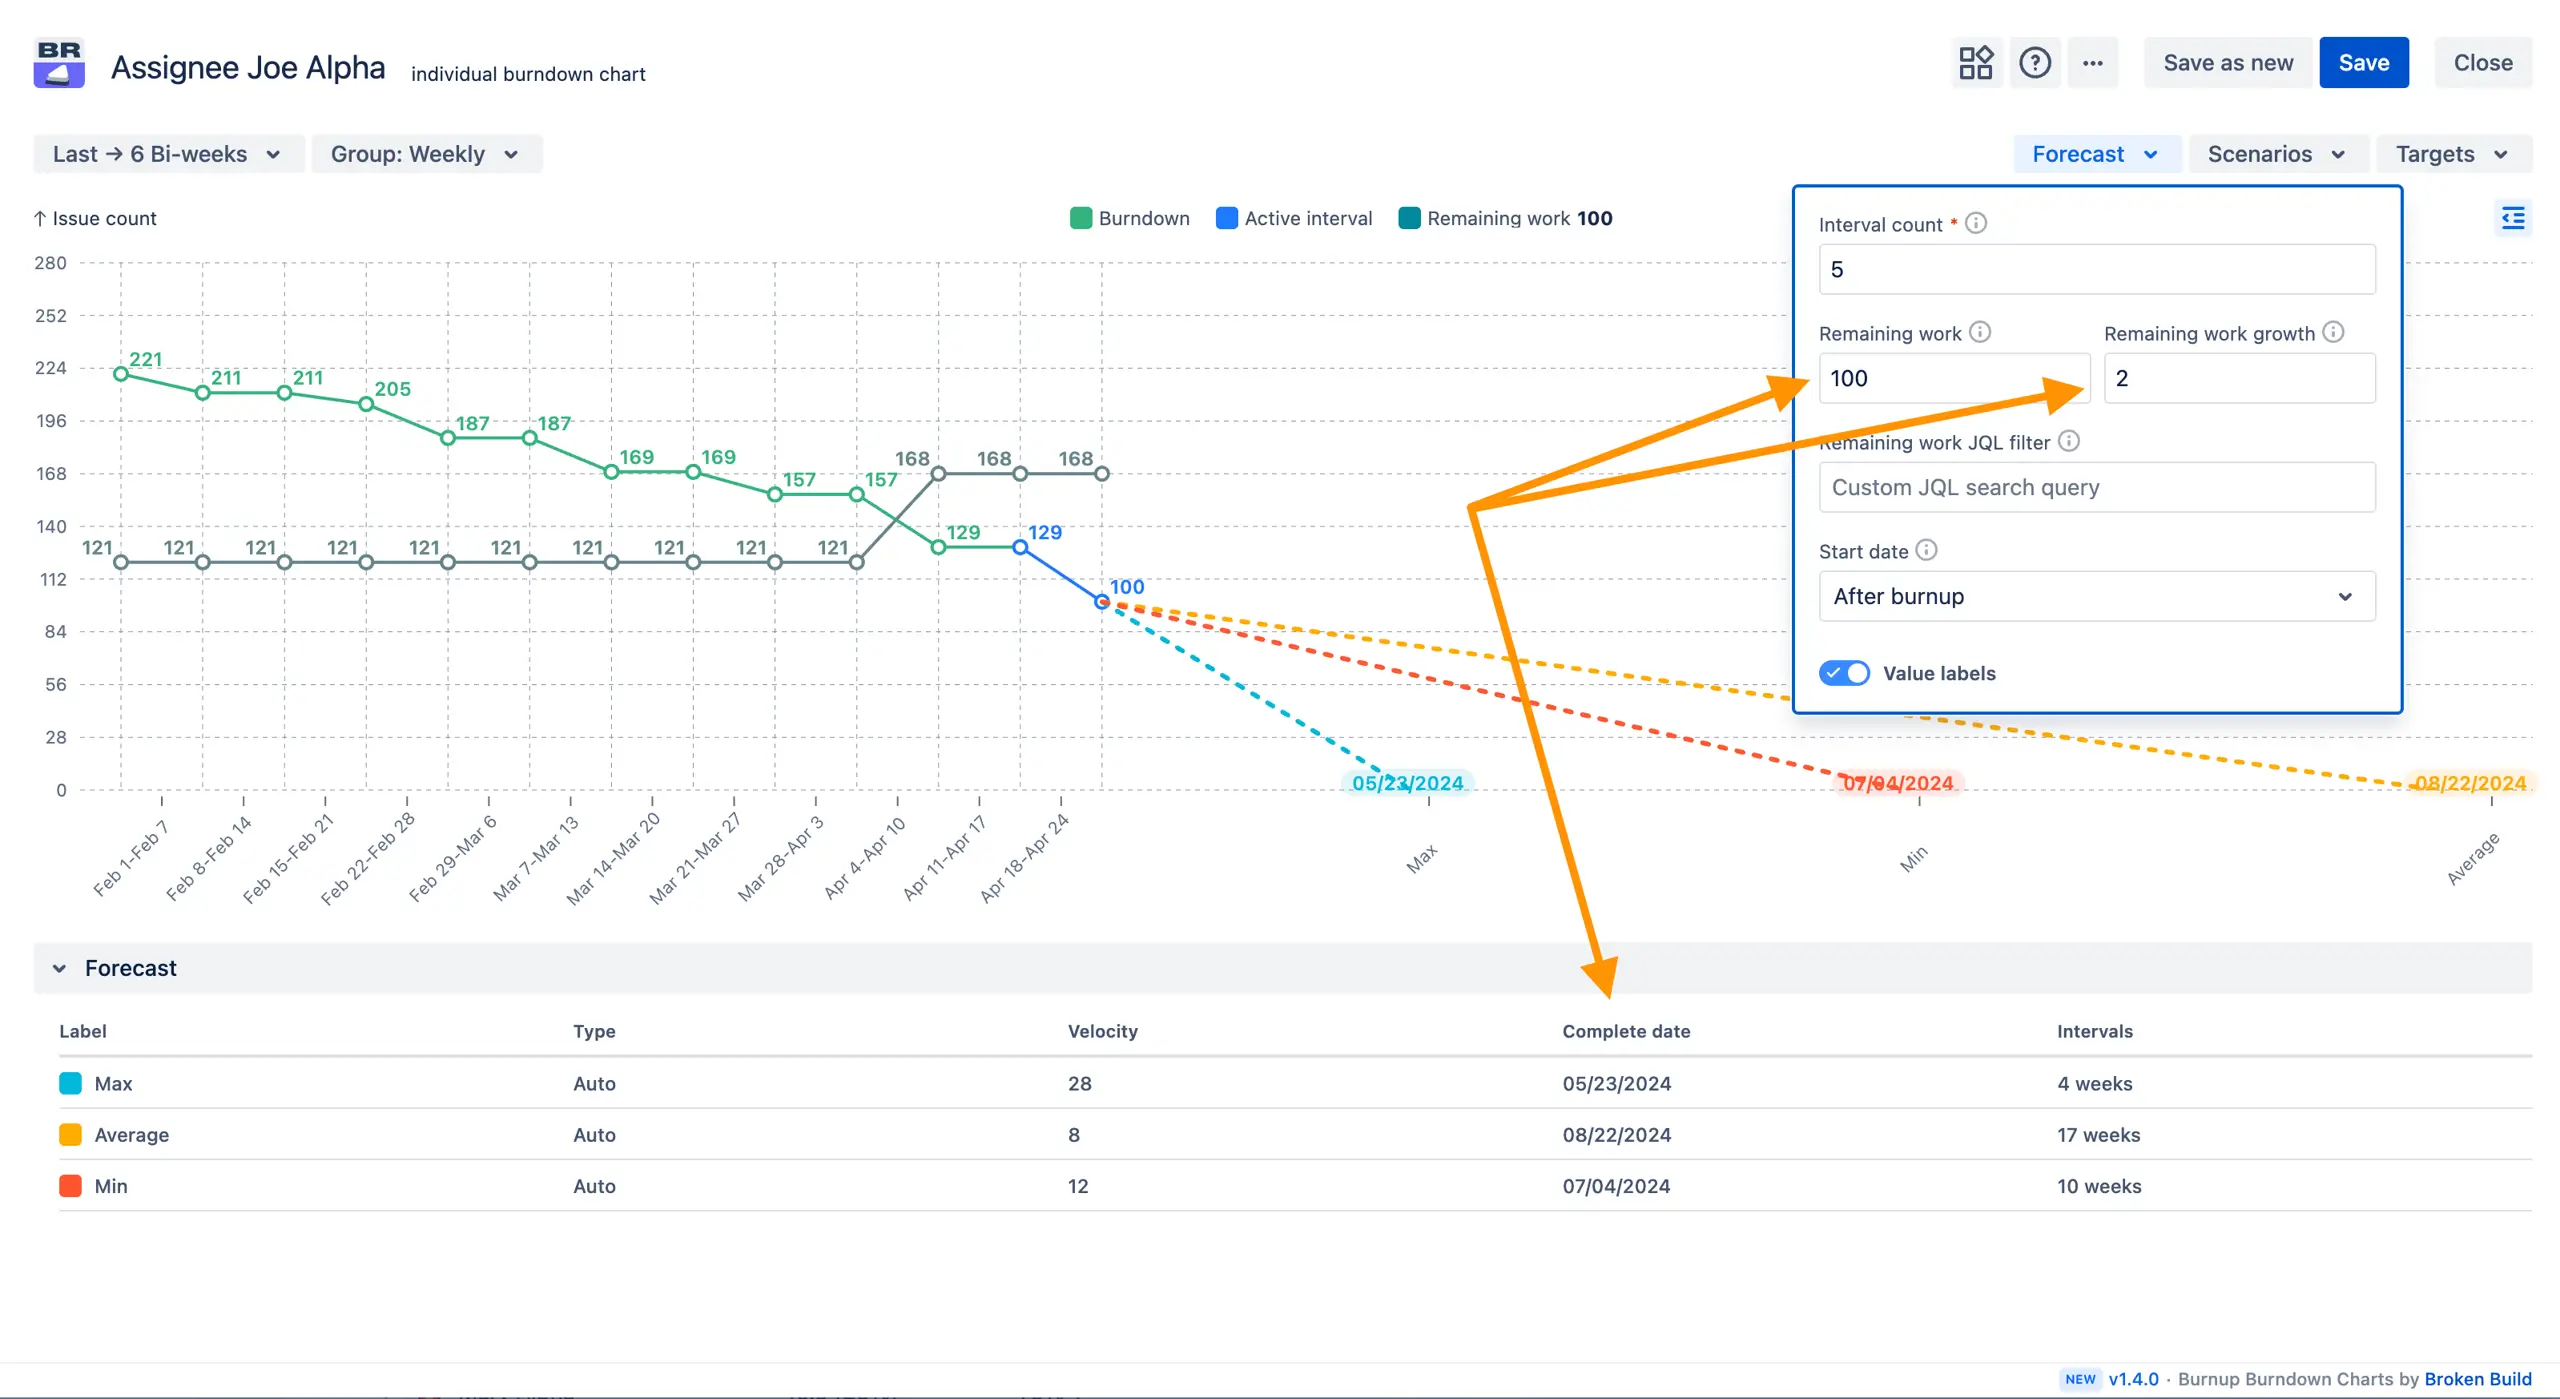
Working with Jira burndown chart by assignee, you can forecast future outcomes from pessimistic to optimistic scenarios and use those insights to make informed decisions about sprint commitments, capacity planning, and resource allocation.
By modeling a range of possible outcomes, you can better prepare for delivery risks and confidently adjust your plans. This also helps you communicate with stakeholders more effectively by sharing scenario-based forecasts grounded in real Jira data, adding transparency and credibility to your projections:
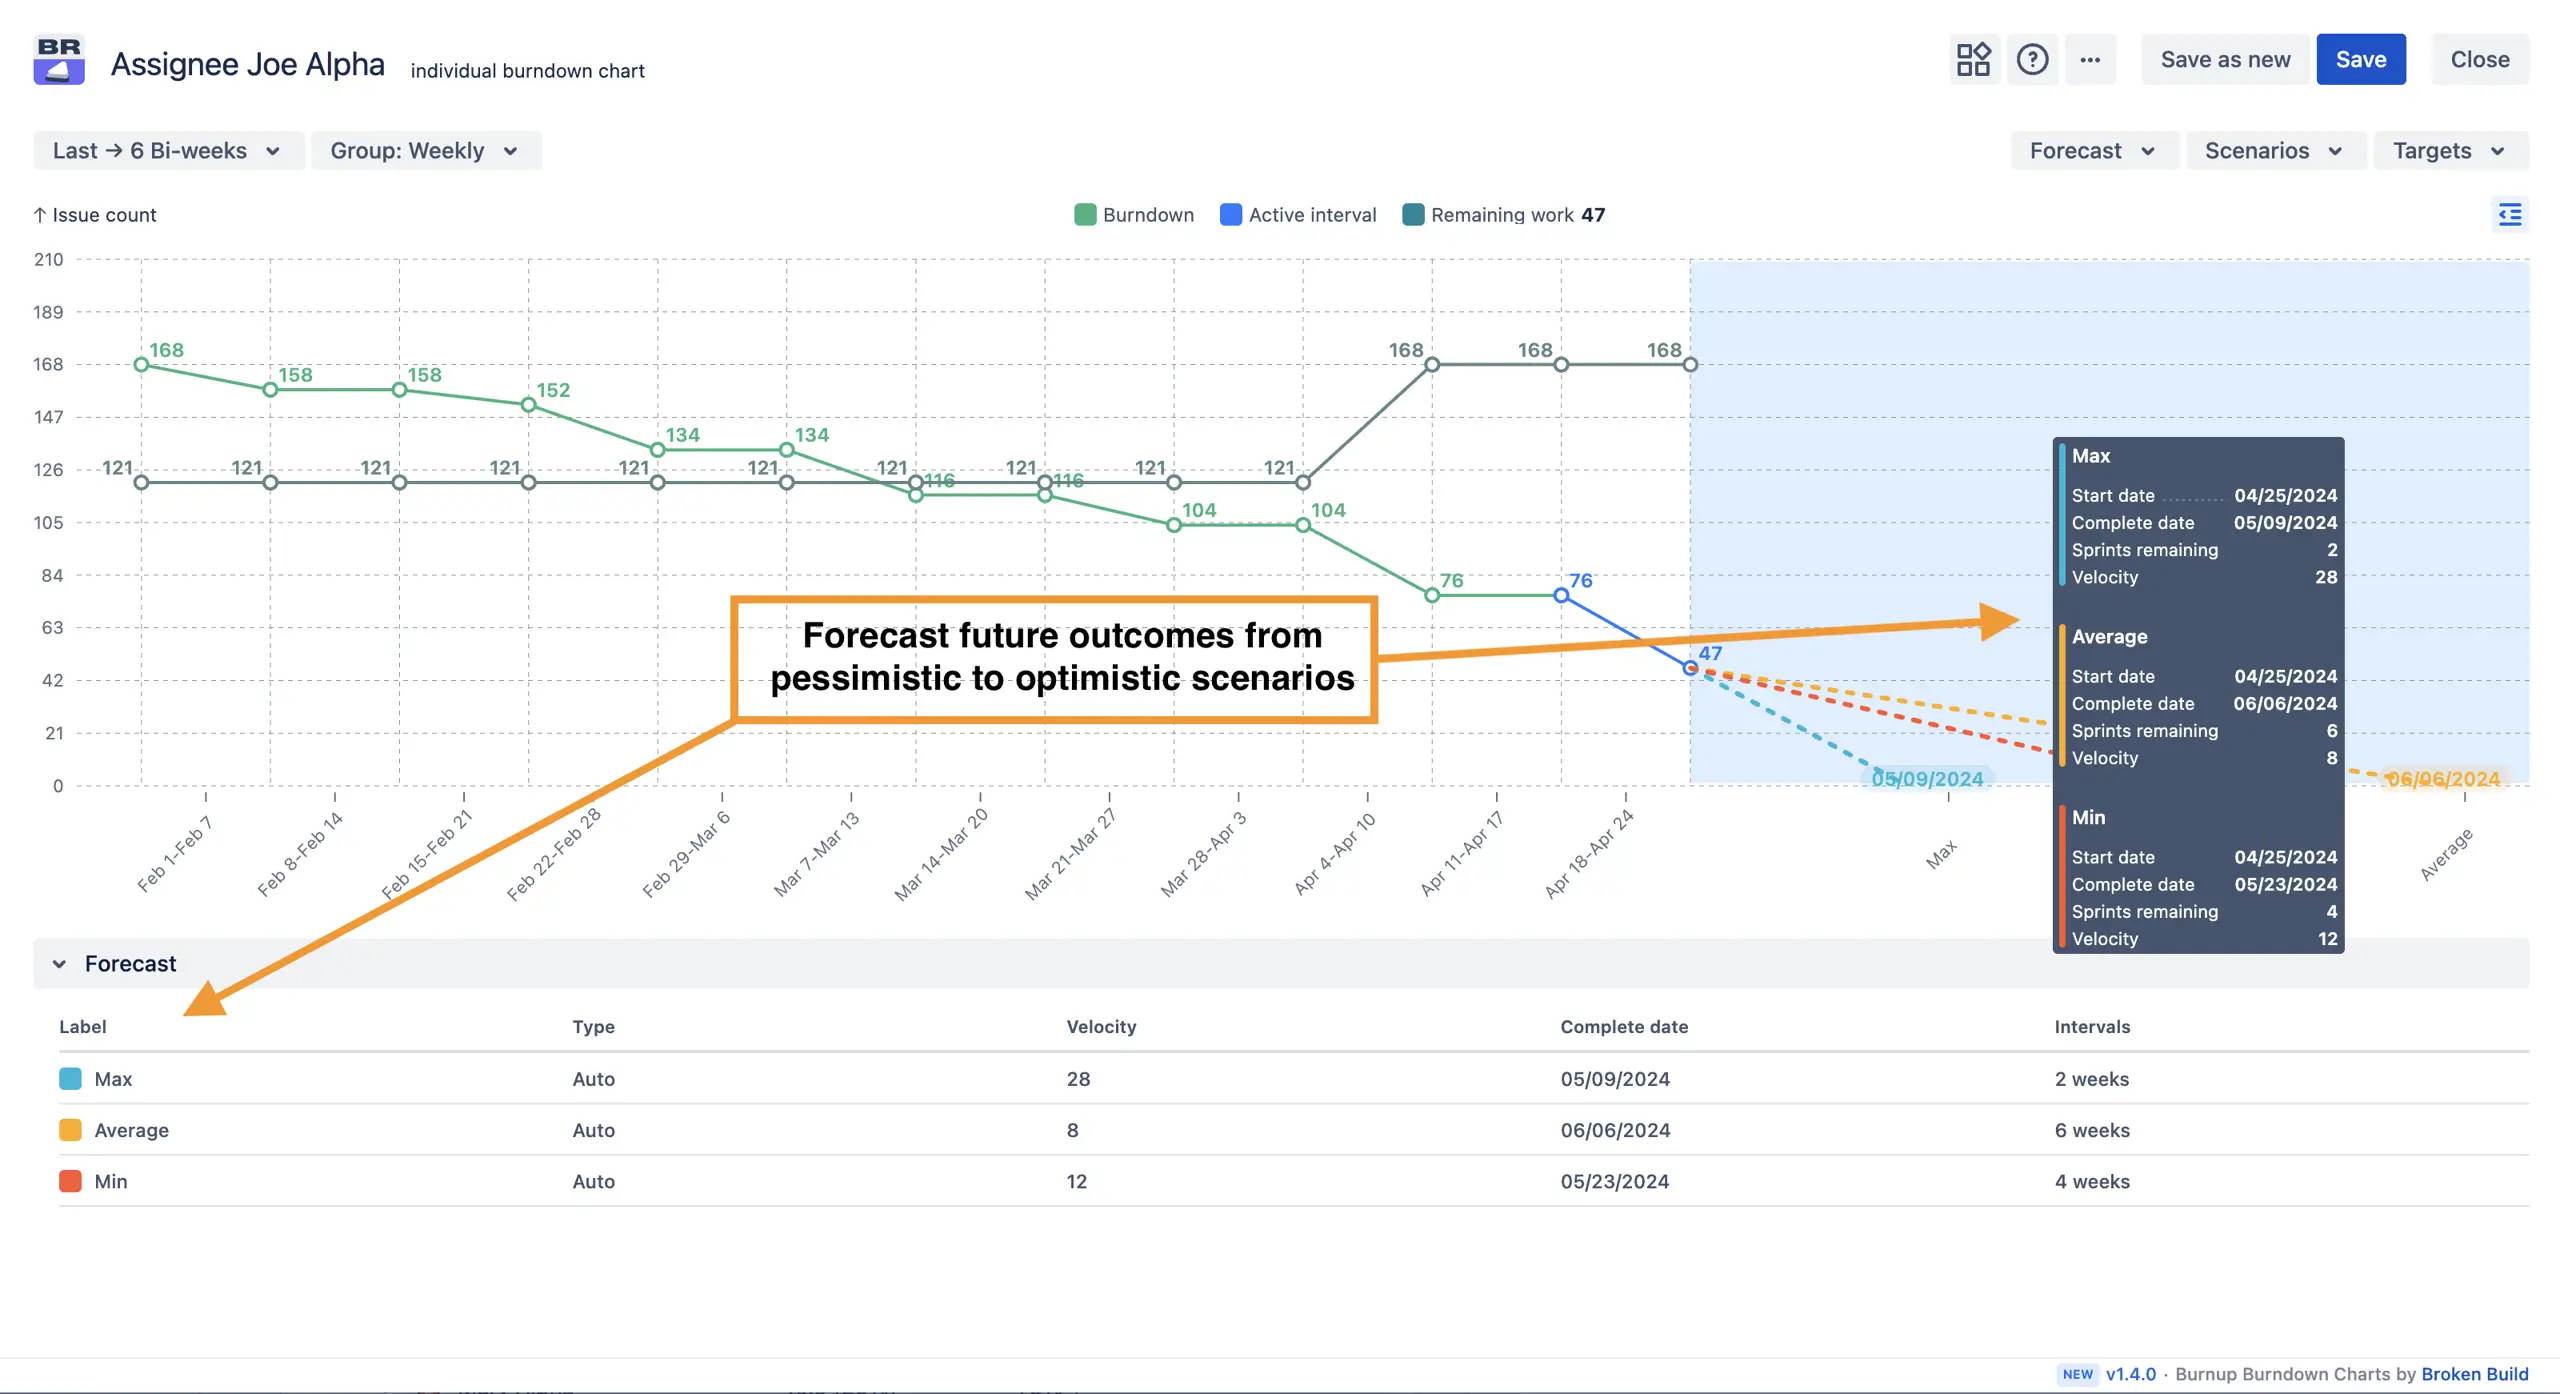
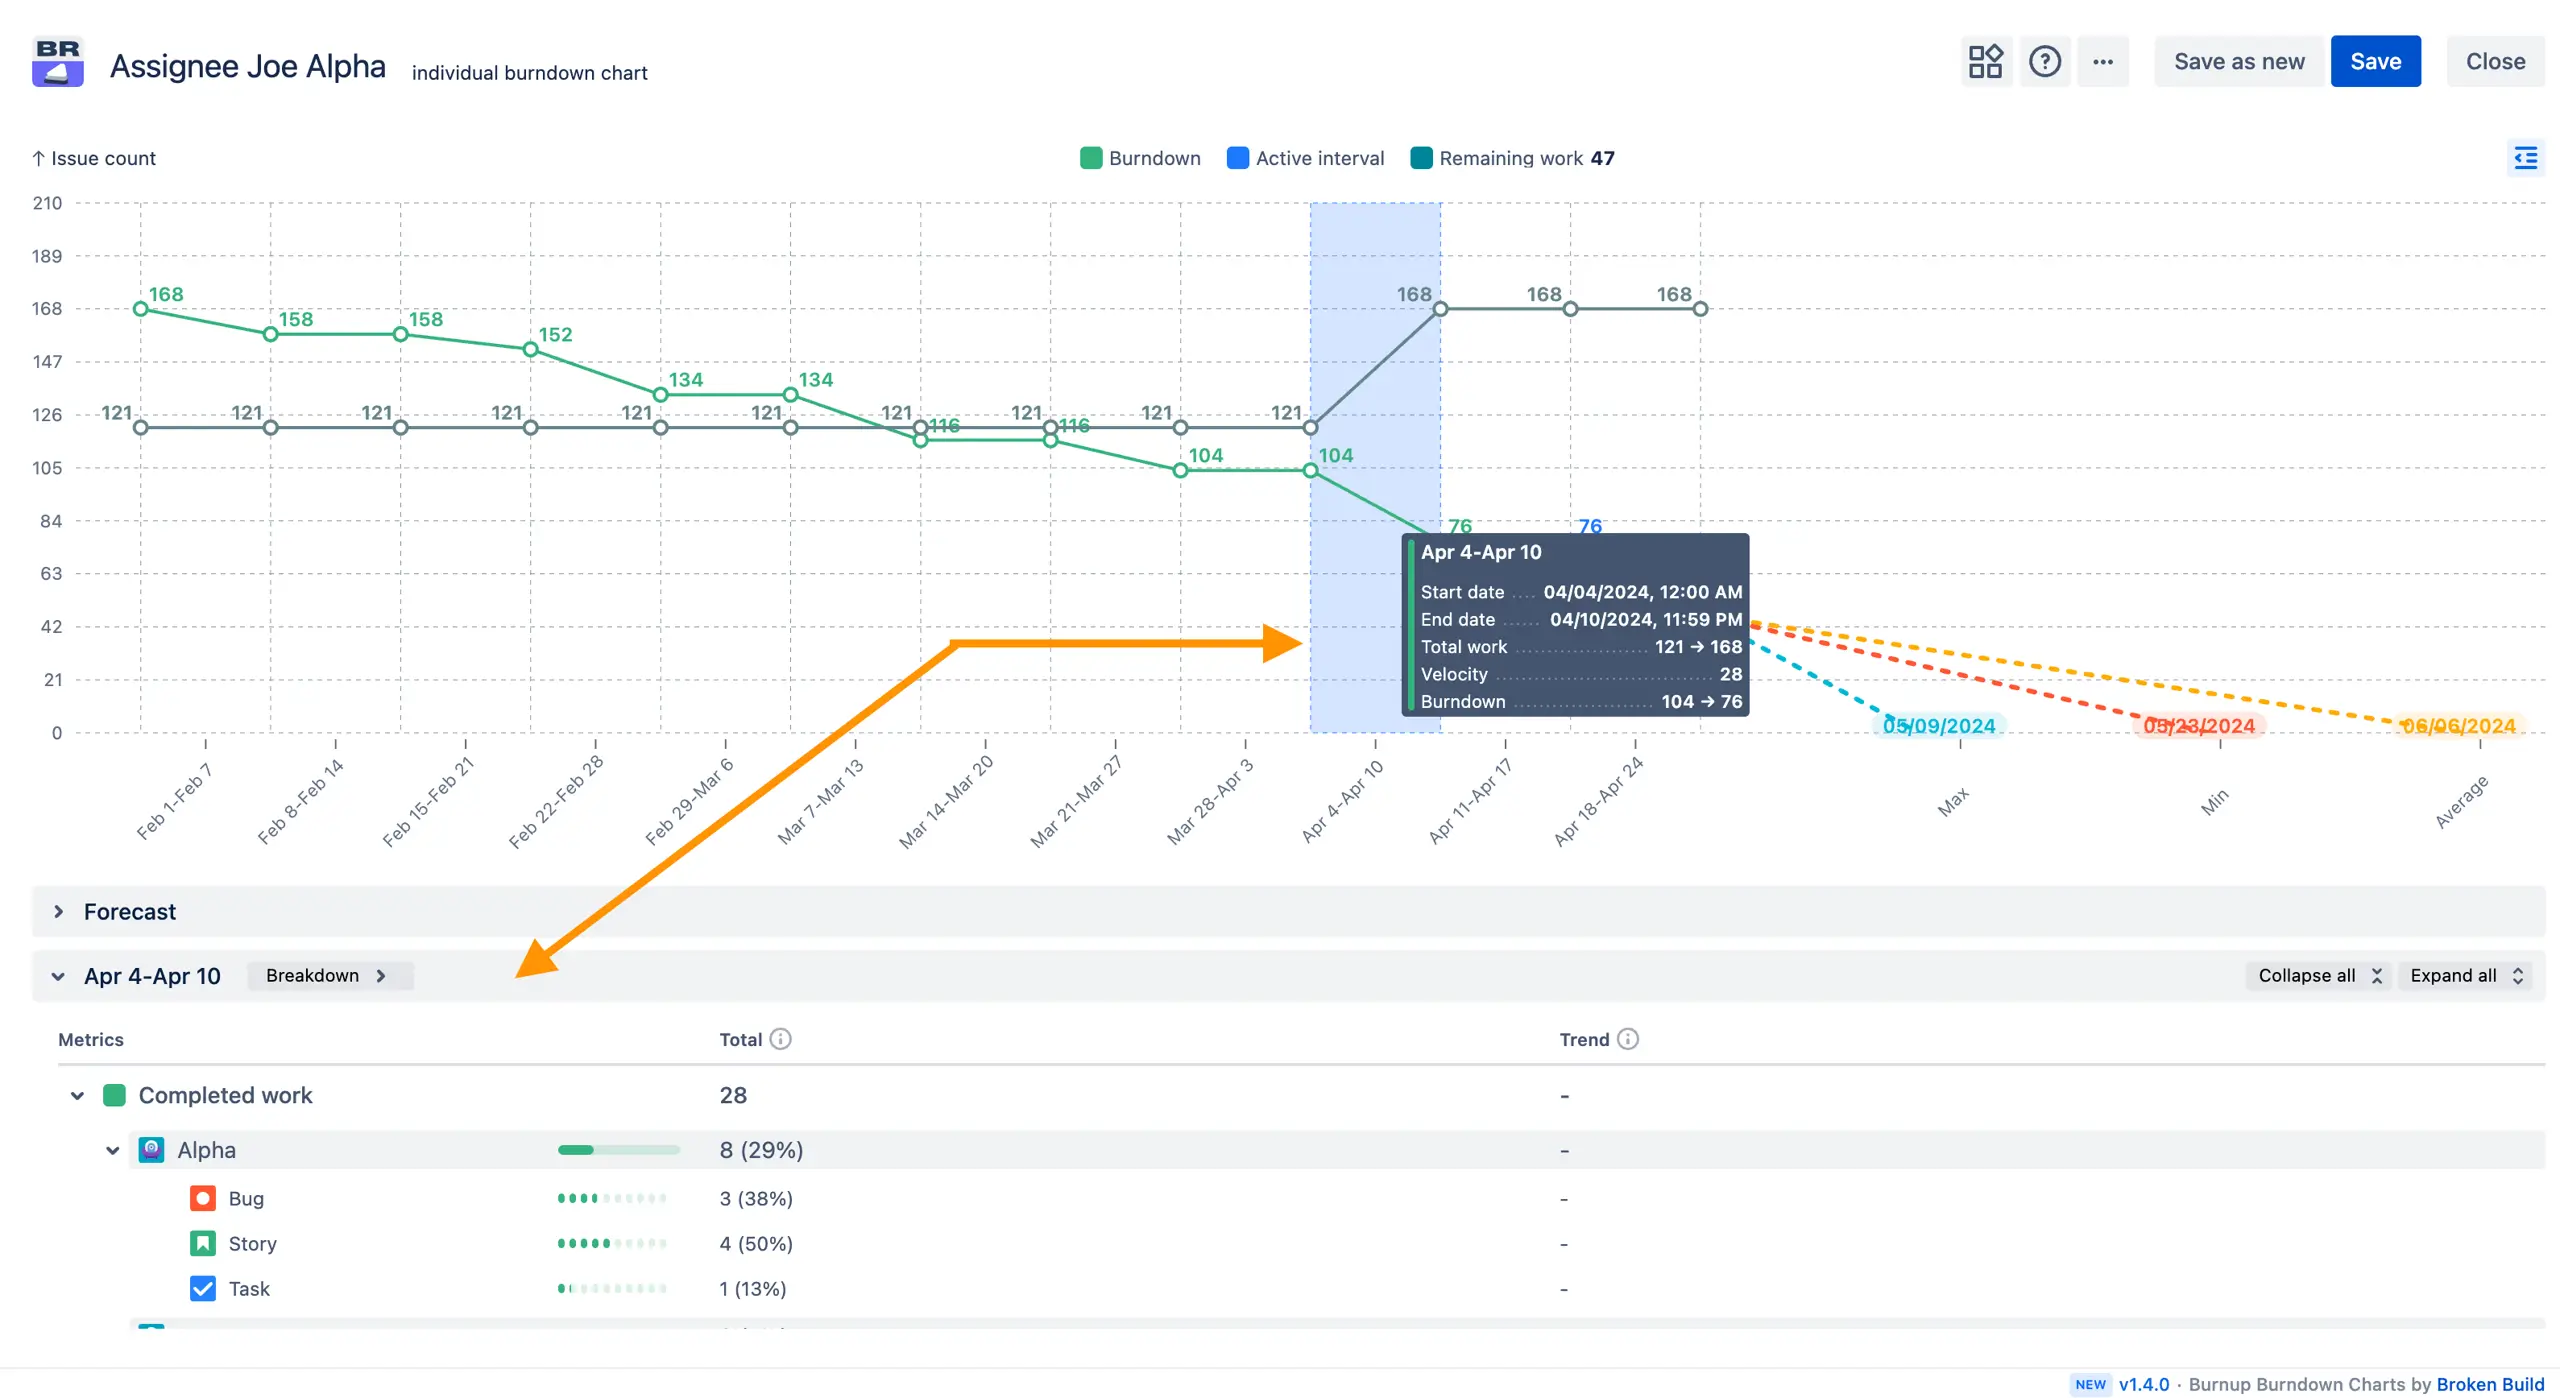
The Jira individual burndown chart allows to slice and dice the data using combinations like project vs. issue type, status vs. assignee, assignee vs. issue type, and more:
To get a clear visibility into who completed what, and when:
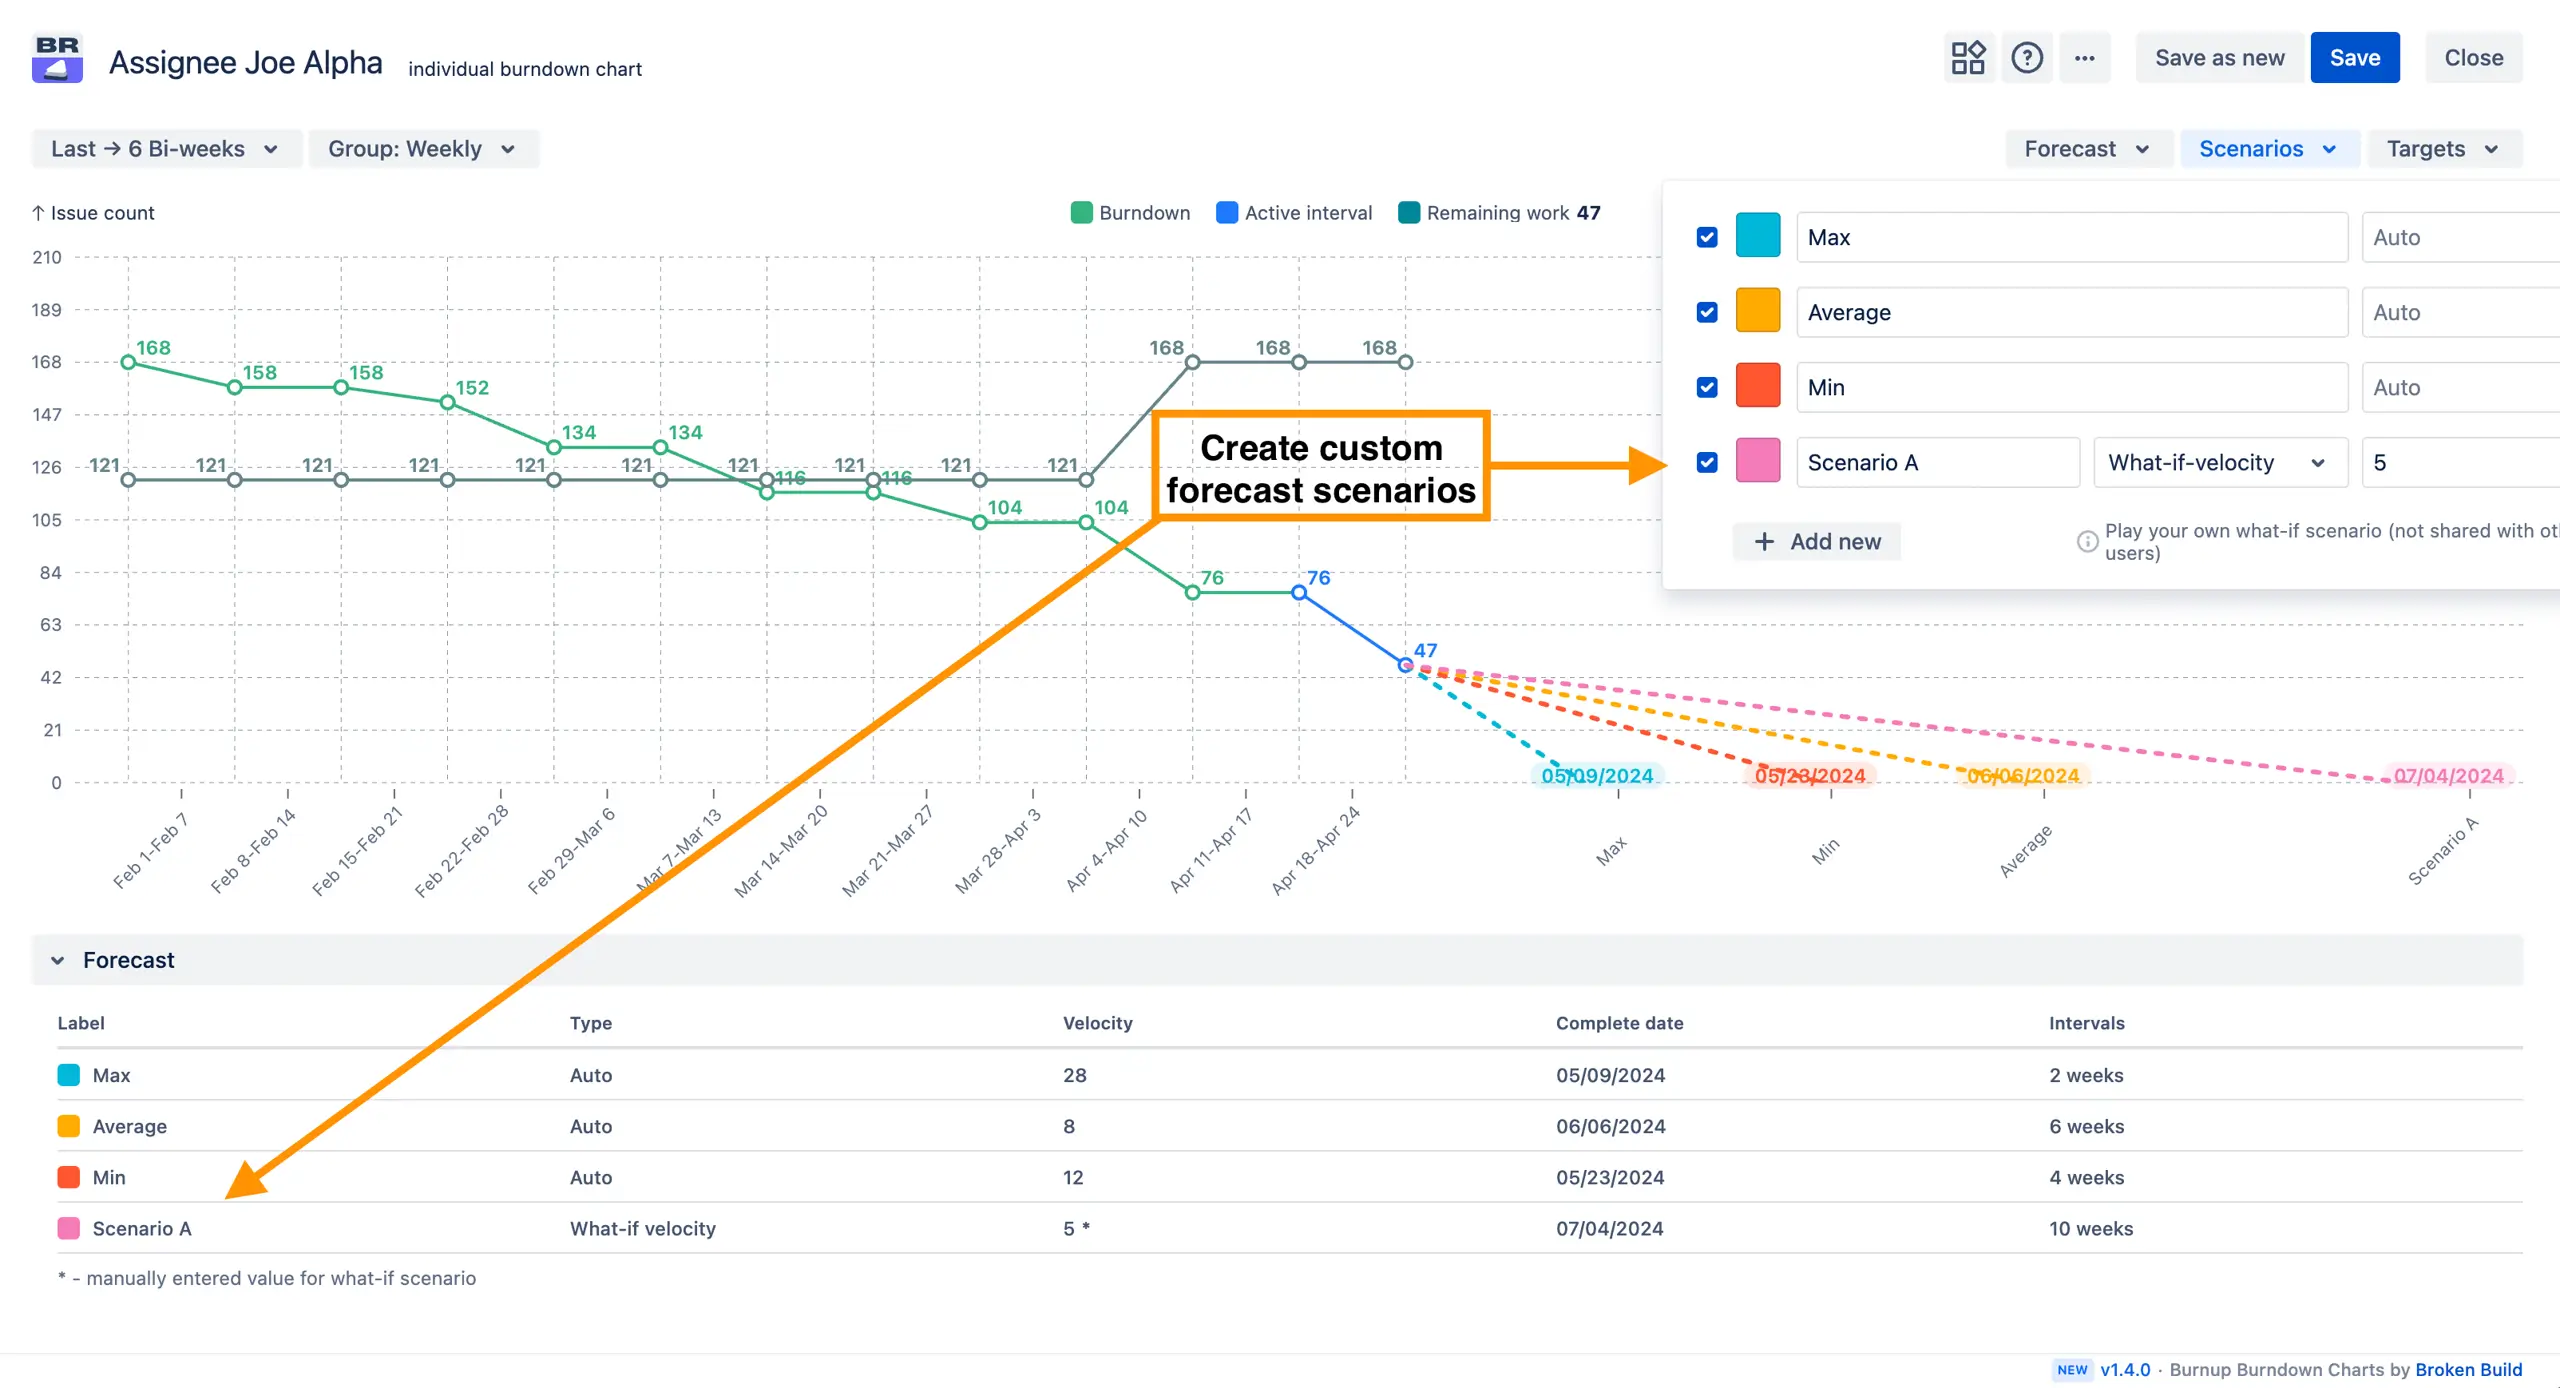
Working with the Jira burndown chart per user, you can explore the impact of scope changes or resource adjustments before they happen:
If you've ever searched "How to see burndown per user in Jira", you've likely discovered that Jira does not provide this functionality by default. While Jira’s built-in reports offer a sprint-level burndown chart, there is no way to view an Individual burndown graph in the Jira dashboard. That’s where our Individual burndown chart comes in. It fills this gap by visualizing each team member’s progress directly on your dashboard, enabling clear performance insights, more targeted delivery reviews, and improved forecasting.
Use our examples to build your use cases on the Jira Dashboard.
Both Jira apps (plugins) used in these examples have a 30-day free trial and are completely free for teams under 10 people:
The Agile Reports and Gadgets app includes Jira individual burndown chart functionality and a multitude of other reports/charts.
An individual burndown chart shows how a single team member’s work is completed over time. Unlike sprint burndowns that track team progress, it visualizes personal delivery trends to support feedback, reflection, and forecasting.
Both charts offer valuable insights into individual delivery. The burndown chart per user shows the remaining work per team member, trending downward as tasks are completed, which helps identify delays early. In contrast, the individual burn-up chart tracks completed work and highlights progress milestones and scope changes.
You can easily tailor the Individual burndown report to match your team’s needs and focus on what impacts delivery most:
Use an individual burndown chart when you want to:
Overusing individual metrics can lead to micromanagement if misapplied. The key is to use this chart for growth-focused data-informed reviews and forecasting, not pressure.
You need:
The Broken Build Jira burndown chart per user pulls this data automatically from Jira.
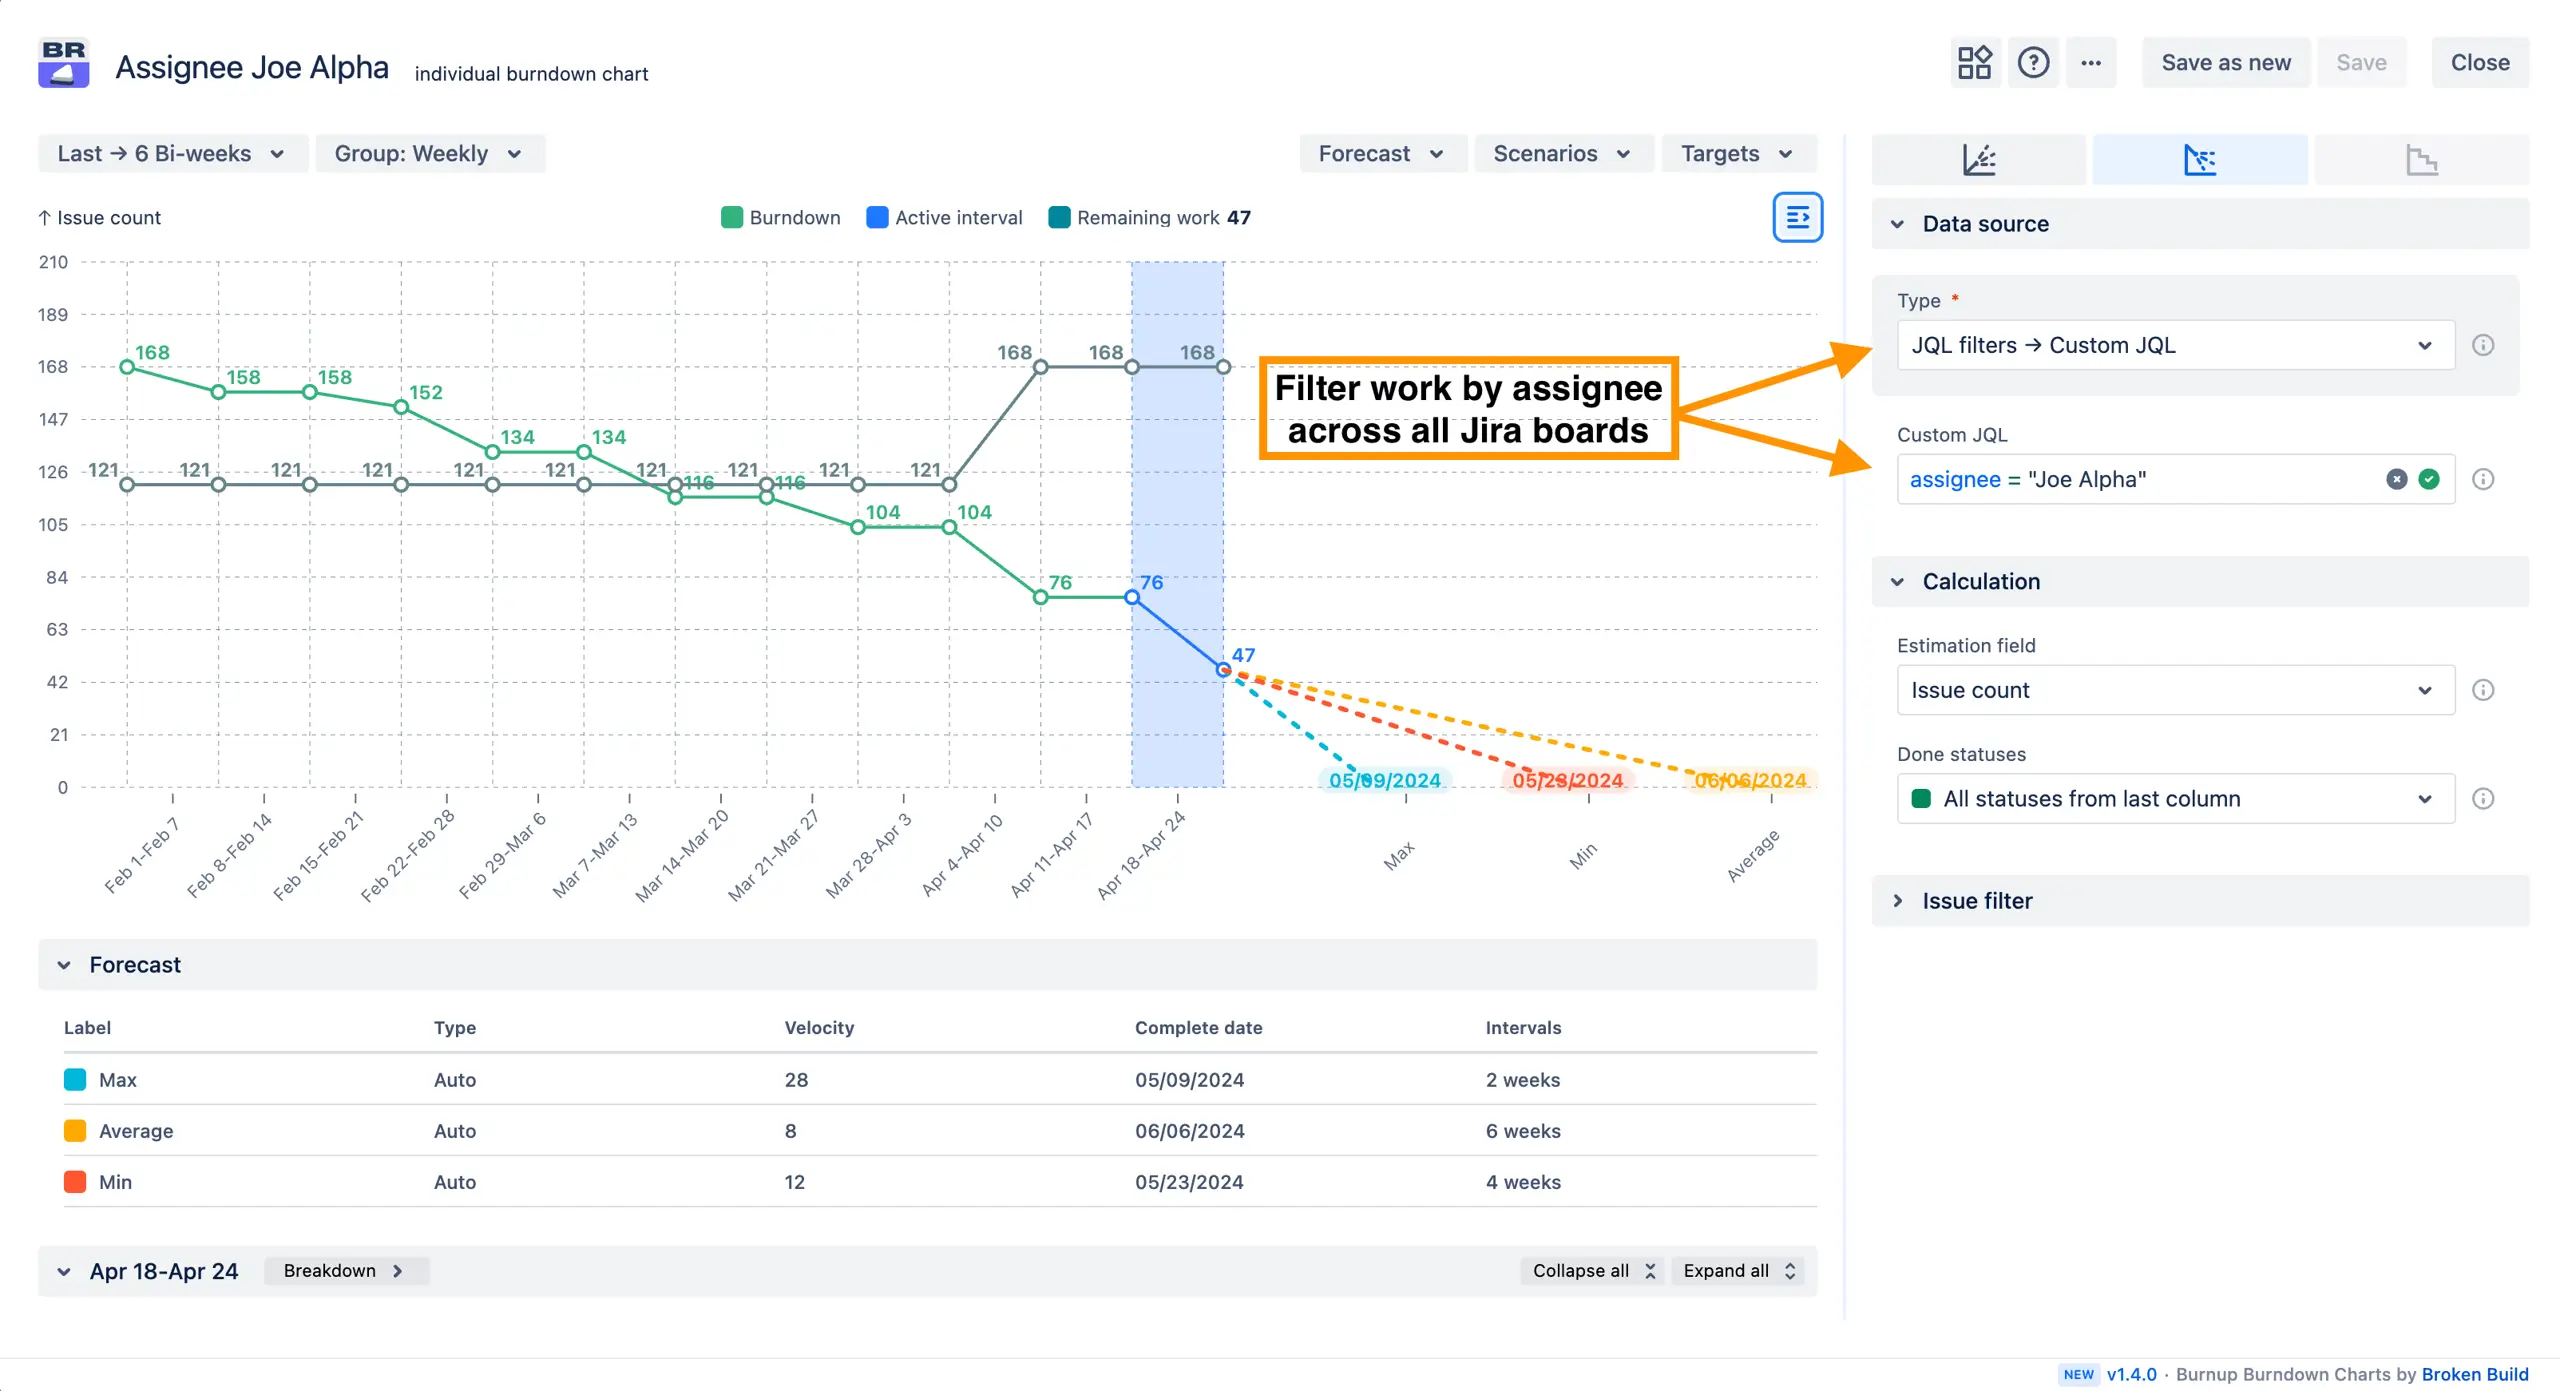
In Jira Cloud or Data Center, install the Agile Burnup Burndown Charts app by Broken Build, then add the Burndown Chart gadget to your dashboard. Select the data source and filter by assignee:


.svg)


.png)
