

A Jira Epic burndown chart shows progress against a selected epic, scope change during sprints, and a projection of remaining sprints. Jira’s native report is a useful Scrum-board view, but its scope, forecast inputs, estimation rules, and sharing surface are bounded. This guide explains the native report first, then shows when Agile Burnup Burndown Charts fit broader or more configurable delivery questions.
Native Jira Epic Burndown gives Scrum teams a single-epic view with a fixed last-three-sprints projection. Agile Burnup Burndown Charts adds configurable forecasting, broader scope, flexible estimation, progress and health visibility, drill-down, and interactive Jira dashboard and Confluence embeds so teams can understand not only where an epic is, but what may affect delivery.
If that broader question is already yours, explore Agile Burnup Burndown Charts in the Atlassian Marketplace. The rest of the article earns that recommendation by clarifying the native baseline first.
What is Jira Epic Burndown?
What the terms mean
An epic is a Jira grouping for related work. It is useful here as a reporting scope; the Scrum Guide does not make Jira epics a Scrum requirement.
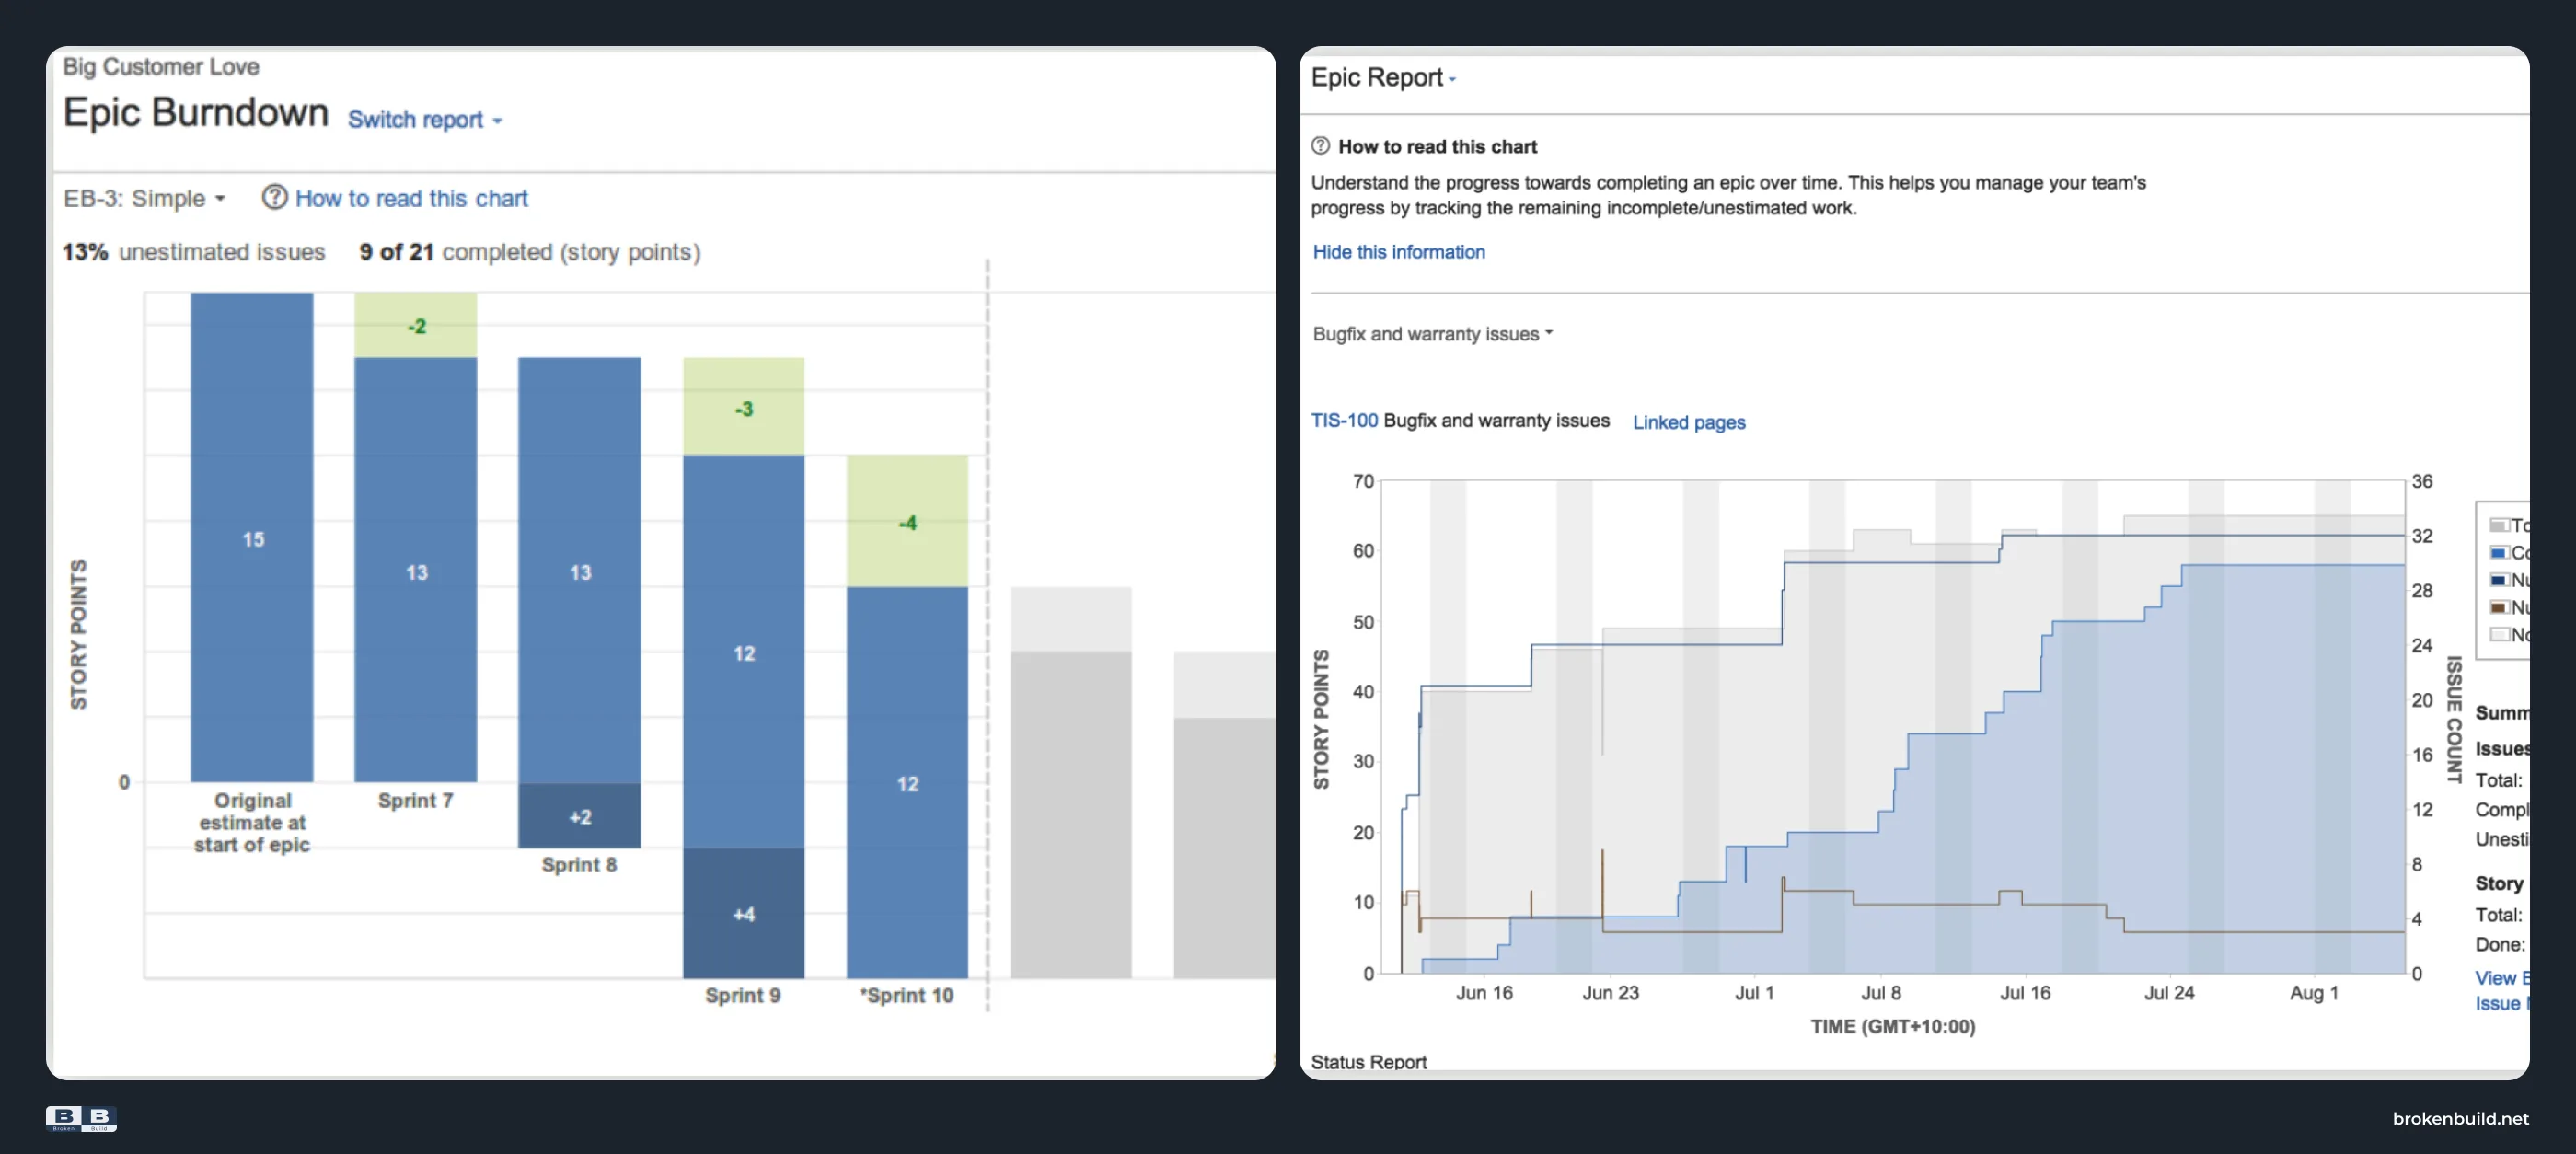
Burndown means remaining work shown over time. A falling line needs context: check the scope, estimate field, and status rules behind it. Jira Epic Burndown is Atlassian’s native report for progress against a selected epic, work added or removed during sprints, and a prediction of remaining sprints.
Do not confuse Epic Report with Epic Burndown. Atlassian’s report catalog lists them as separate report types: Epic Report focuses on progress and remaining work, while Epic Burndown adds a projected-sprints view optimized for Scrum. For a deeper explanation of the first report, see the Jira Epic Report guide.
How to access and read the report
In Jira, open the relevant board, choose Reports, open Epic Burndown, and select an epic available through the board filter. The report uses the board’s estimation statistic and is optimized for Scrum teams working in sprints; Atlassian’s report guidance covers the navigation and calculation details.
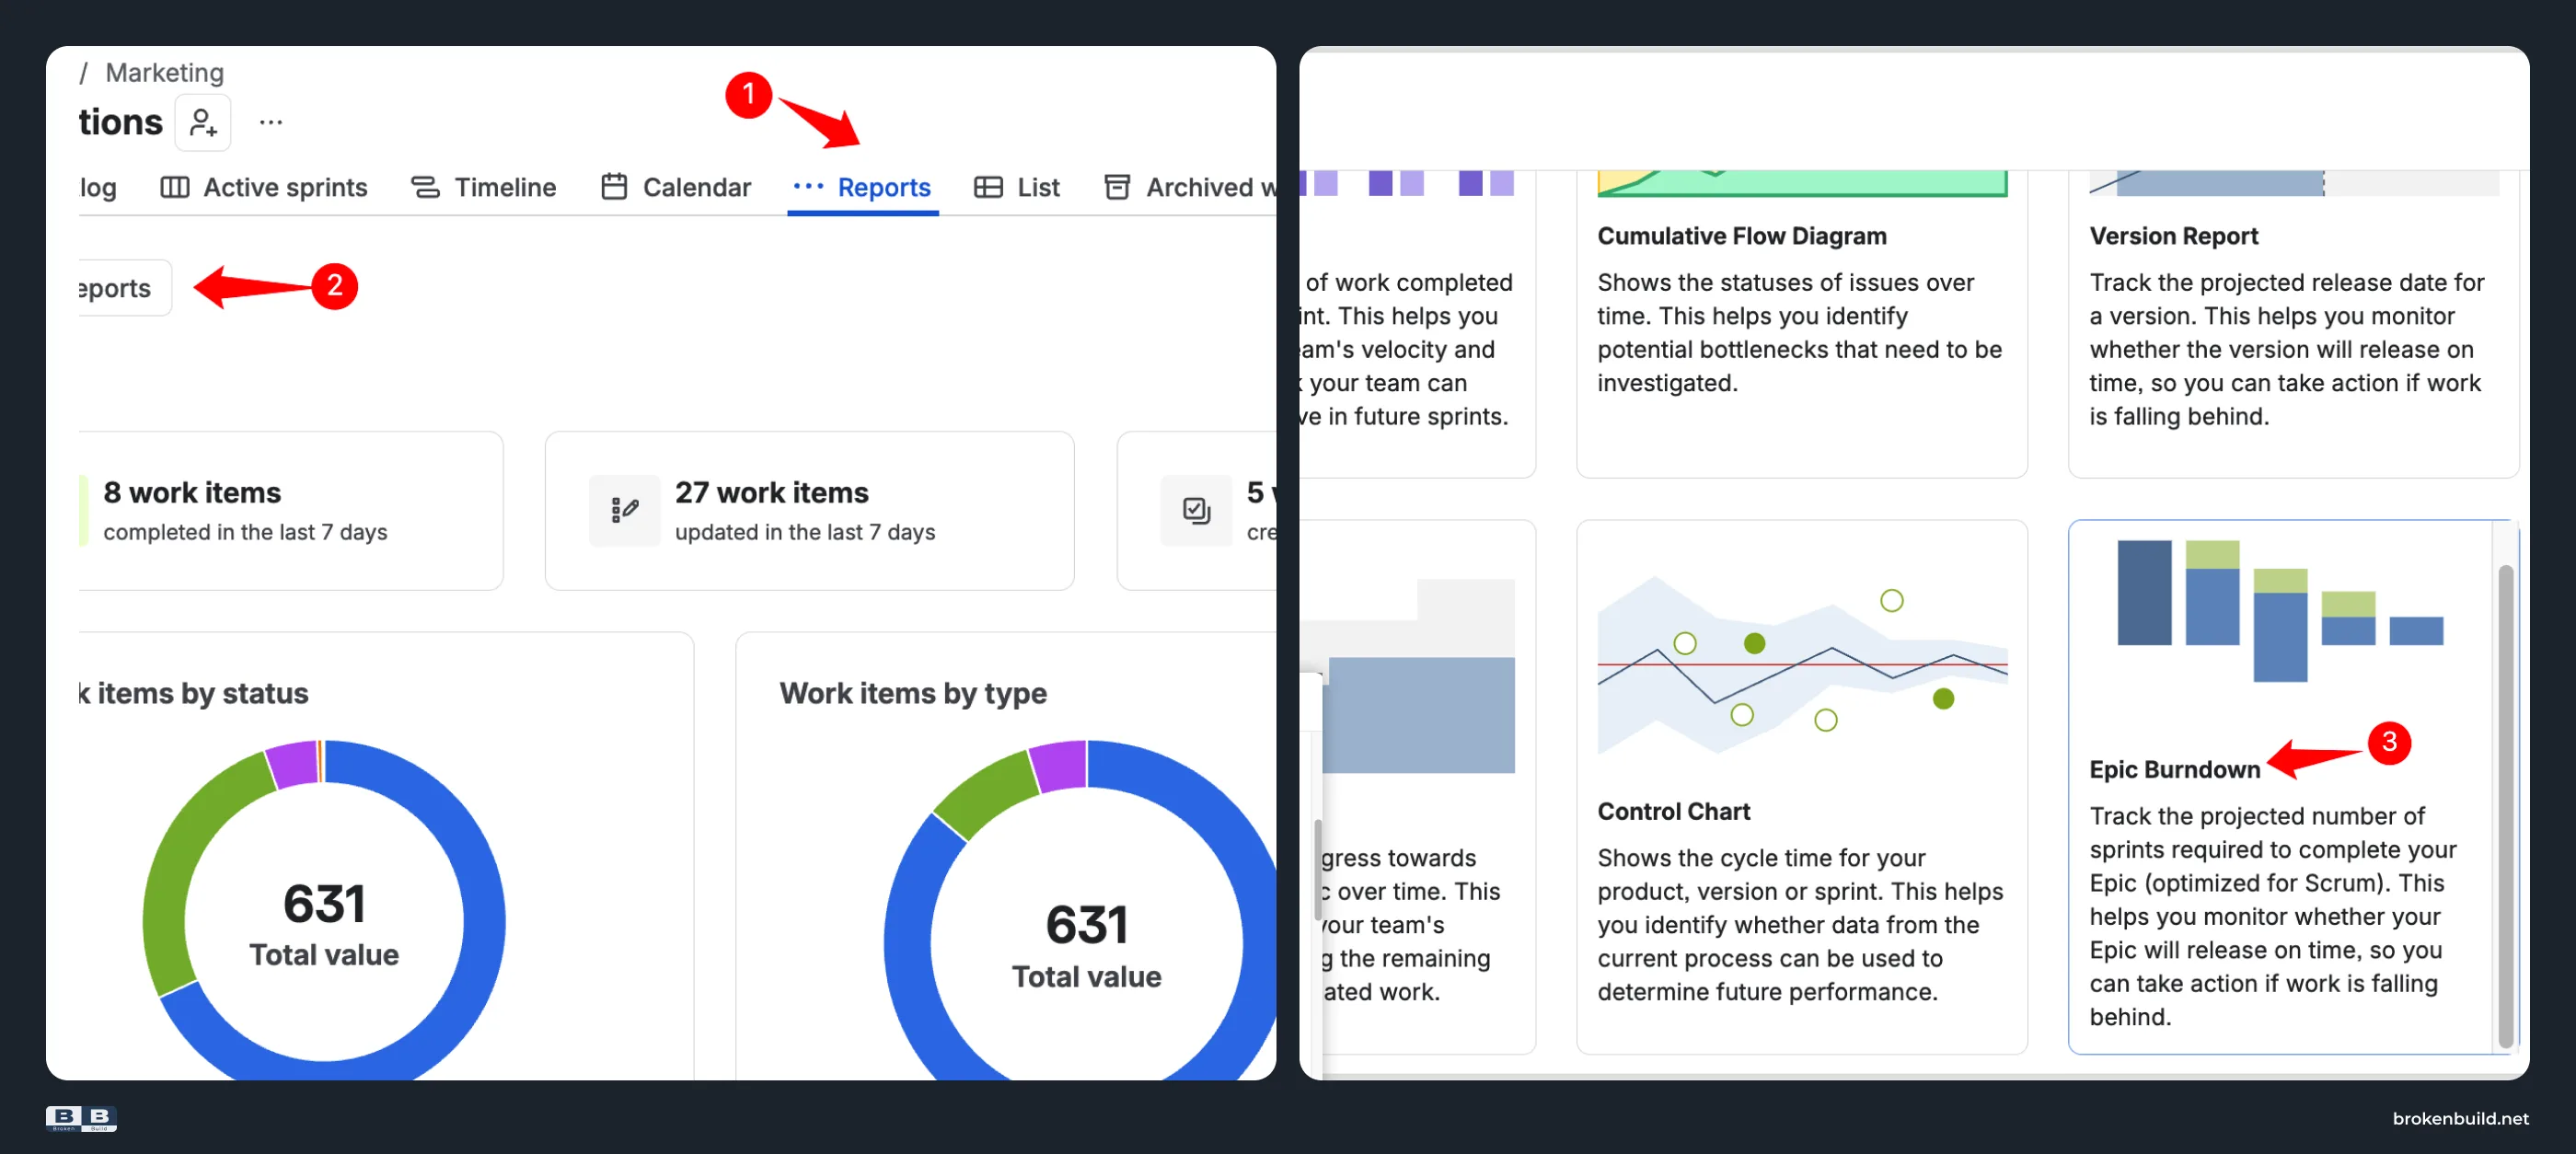
If your starting question is how to create an Epic burndown chart in Jira, the practical answer is to configure the board and epic prerequisites first, then use this Reports path. Creation details are tenant- and board-dependent; the supplied evidence does not support a more specific configuration recipe.
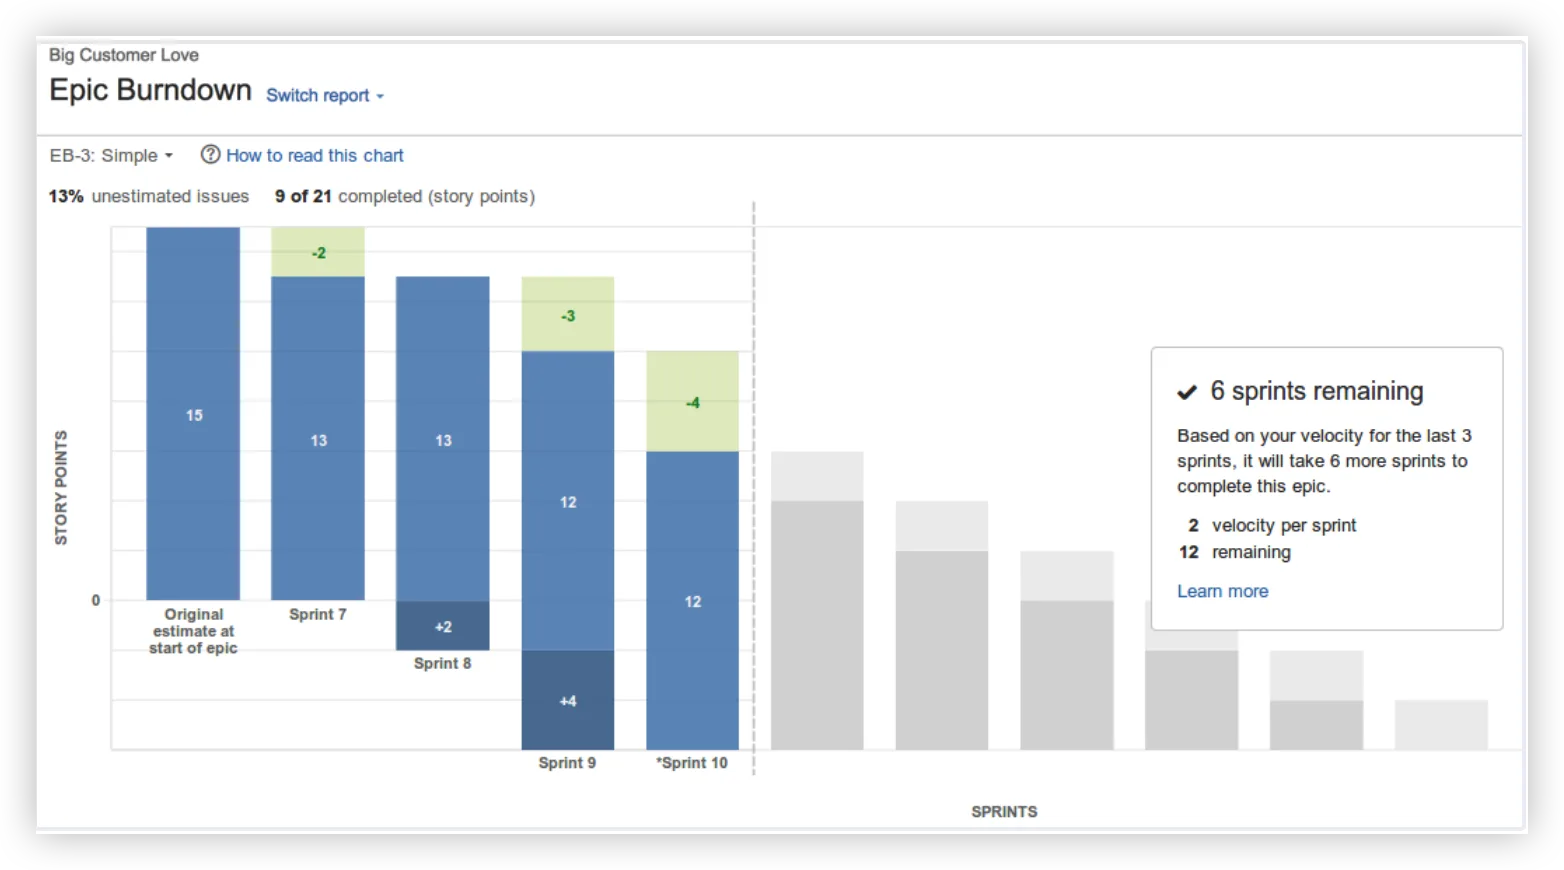
Read the report in this order:
- Start with the time axis and sprint intervals.
- Identify remaining work and where work was added or removed during a sprint.
- Check the estimation field and whether the work items are estimated. Atlassian’s report guidance flags a high share of unestimated work as a reliability risk for predictions.
- Treat the forecast as a projection, not a promise. The report guidance describes a projection based on completed work from the last three sprints and total remaining work. Scope change affects remaining work, but not the velocity calculation.
- If totals differ from another Jira report, investigate configuration and report definitions before calling it a defect. Atlassian’s troubleshooting guidance confirms that different story-point totals can occur.
Who this native view fits
Jira Epic Burndown fits a Scrum team that needs a selected epic’s sprint-based progress and a quick native projection. If the decision requires multiple epics, cross-project scope, Kanban or no-sprint intervals, customizable forecast scenarios, deeper issue inspection, or a shared interactive view, keep reading. That is a scope mismatch, not automatically a product defect.
How to interpret the trend
The Scrum Guide frames Scrum around transparency, inspection, and adaptation. That is the right way to use a burndown: inspect remaining work, scope movement, estimation quality, and forecast assumptions, then adapt. A chart is a decision aid, not proof that a forecast will be correct.

A single Scrum board epic report should not be used as a complete portfolio health measure. Wider delivery visibility may require broader scope and reporting workflows.
When scope can change, reading Completed, Remaining, and Total together can make the story clearer: a line may move because work was completed, because scope changed, or because both happened. Configurable scenarios make assumptions visible. They do not promise better forecast accuracy.
Where the native report falls short – and what Epic Burndown chart by Broken Build adds
You open the native chart to answer, “Where is this epic?” It gives you a useful Scrum-board snapshot and one recent-velocity projection. The next questions are broader: what happens if the scope spans projects, the team needs a different time model, stakeholders want to compare assumptions, or someone needs to inspect the causes behind a change?
The sections below pair the documented native boundary with the documented capability in Agile Burnup Burndown Charts. They describe a scope mismatch, not a claim that the native report is defective or that the app guarantees better outcomes.
1️⃣ One selected epic and board-bound scope → broader Epic Burndown scope
Native: Jira Epic Burndown lets you select an epic available through a board filter. It is a useful one-epic Scrum view, but it does not provide the broader multi-epic or cross-project scope needed for every delivery question.
Epic Burndown chart by Broken Build: Inside Agile Burnup Burndown Charts, build a chart from one or multiple epics, projects, releases, initiatives, boards, saved filters, or custom JQL.
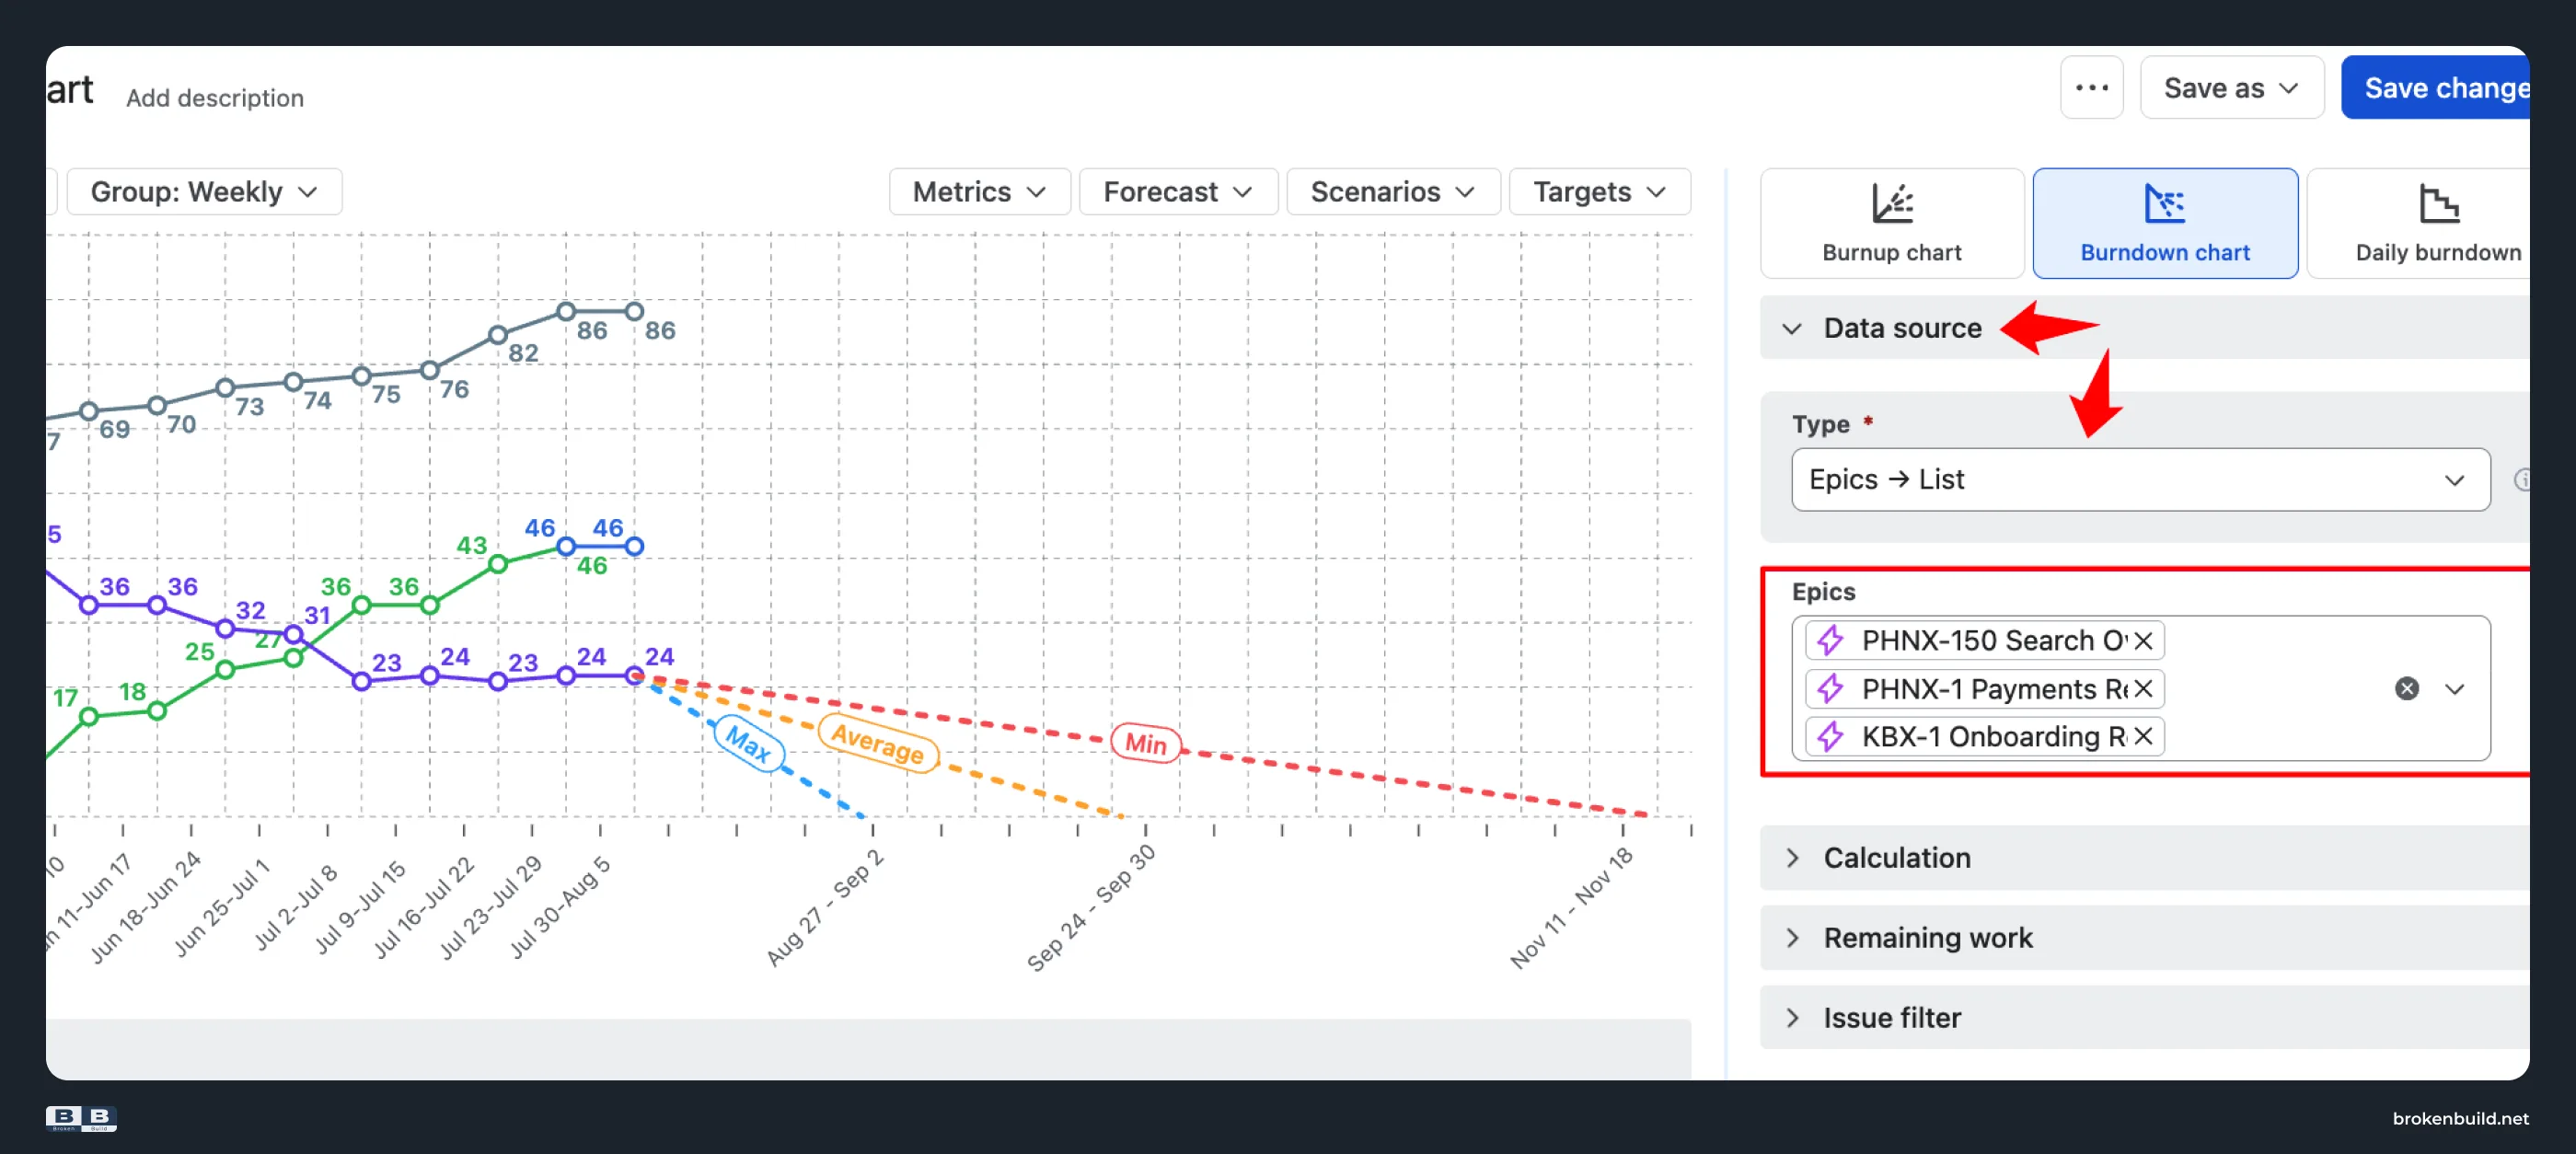
2️⃣ Sprint-oriented time axis → configurable intervals and data sources
Native: Jira Epic Burndown is optimized for Scrum teams and sprint-based reporting. A Kanban team, or a team that wants day/week intervals without sprint boundaries, is asking for a different time model.
Epic Burndown chart by Broken Build: Choose configurable intervals and broader data sources when the decision is not naturally expressed as a single Scrum sprint sequence.
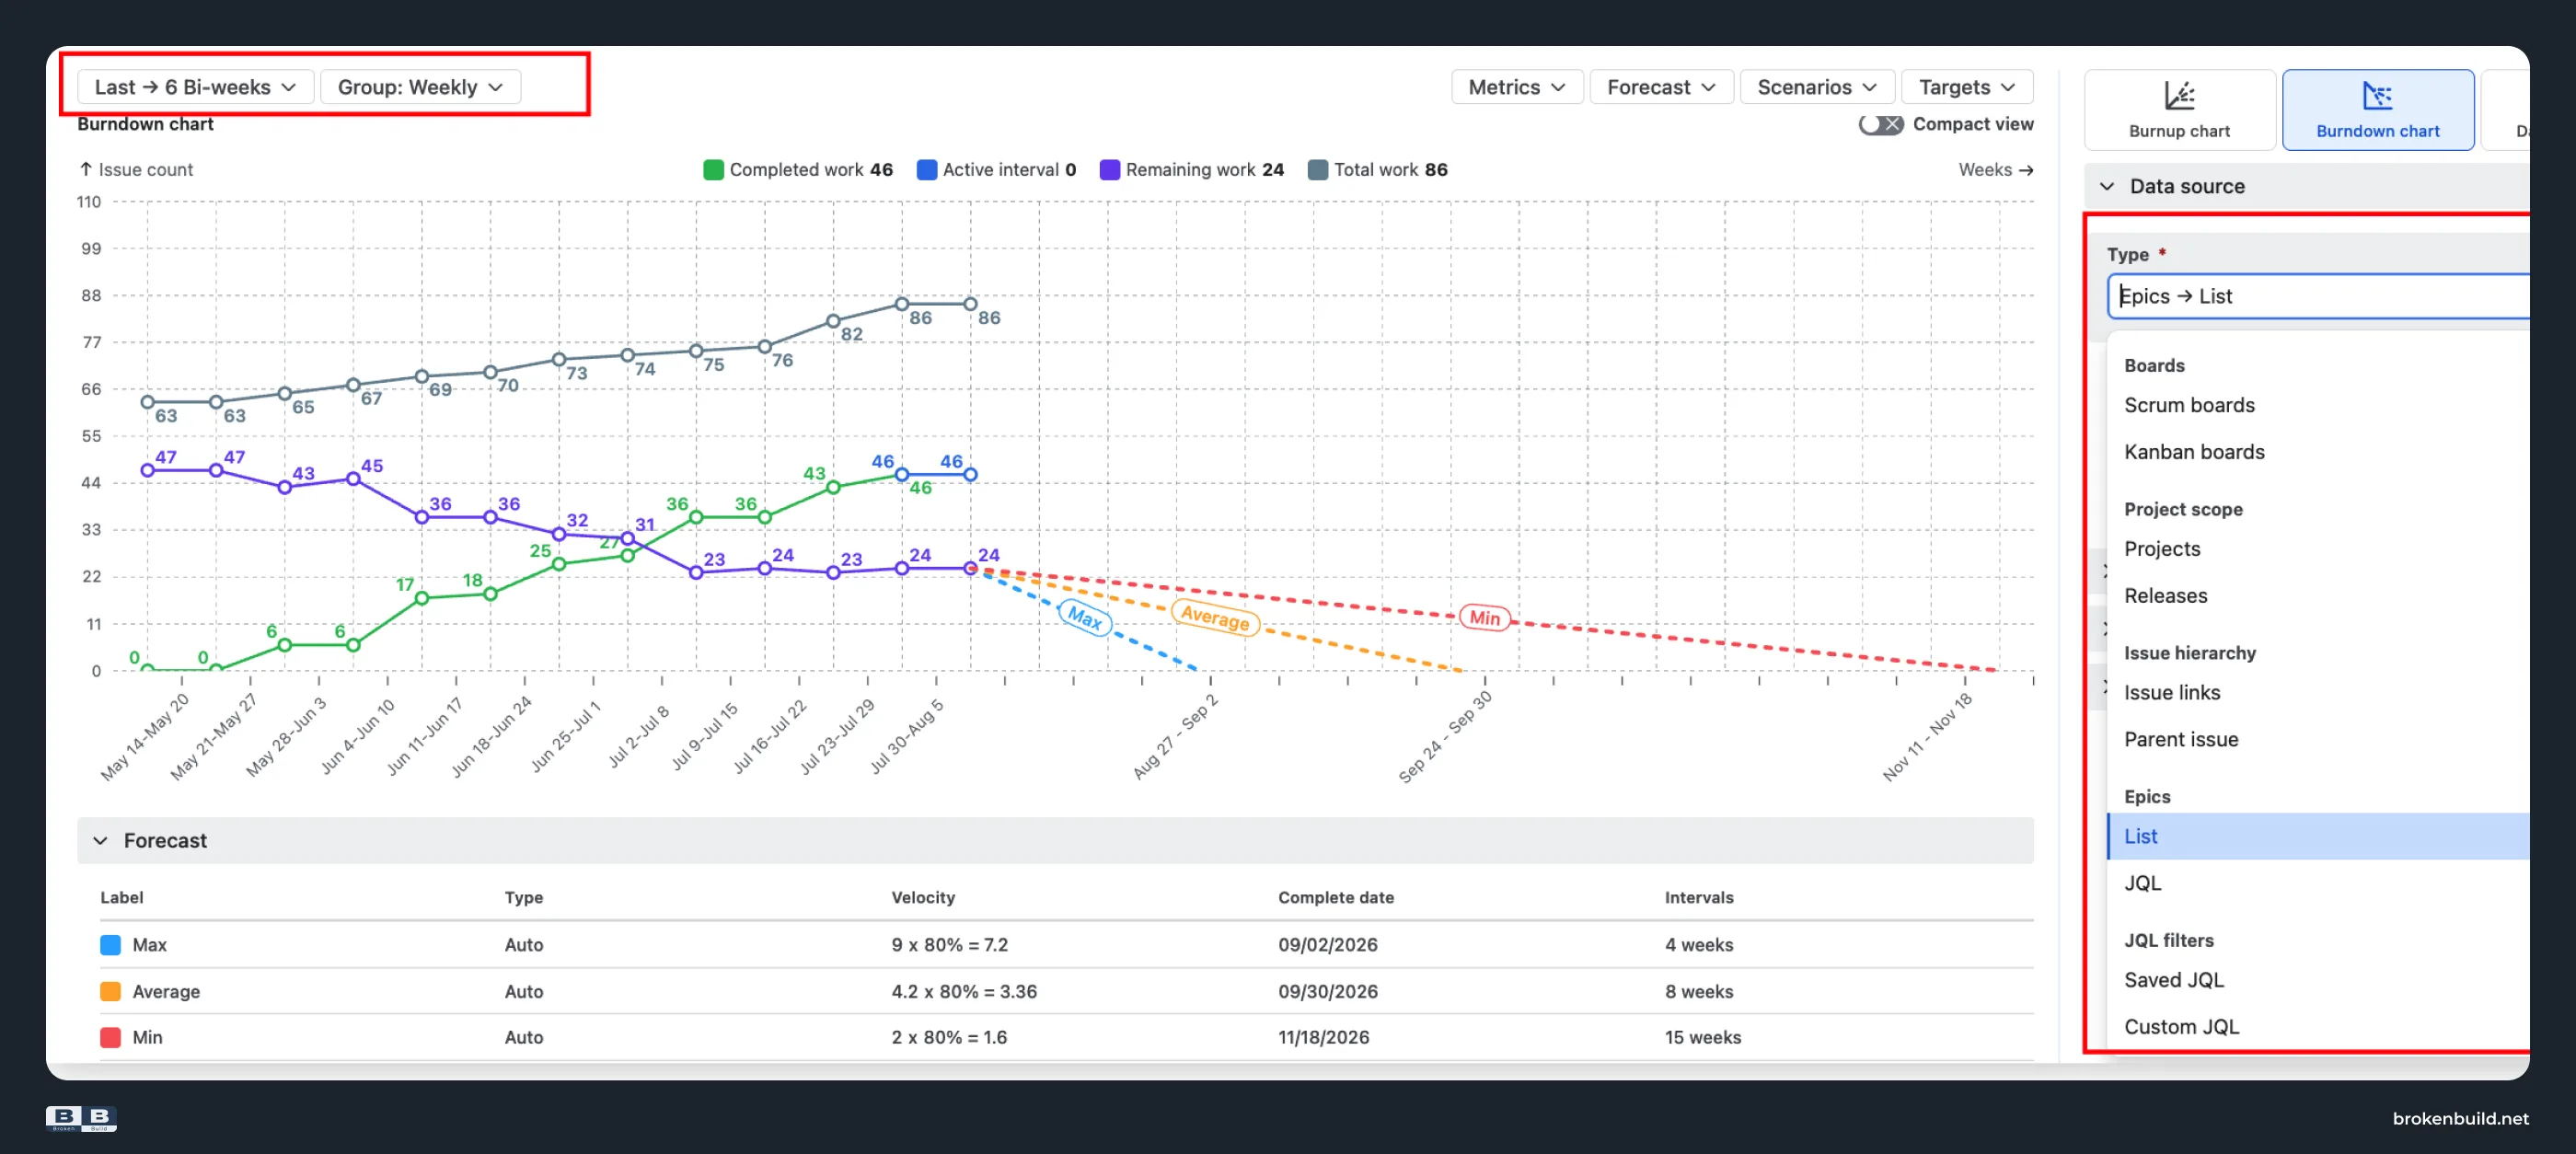
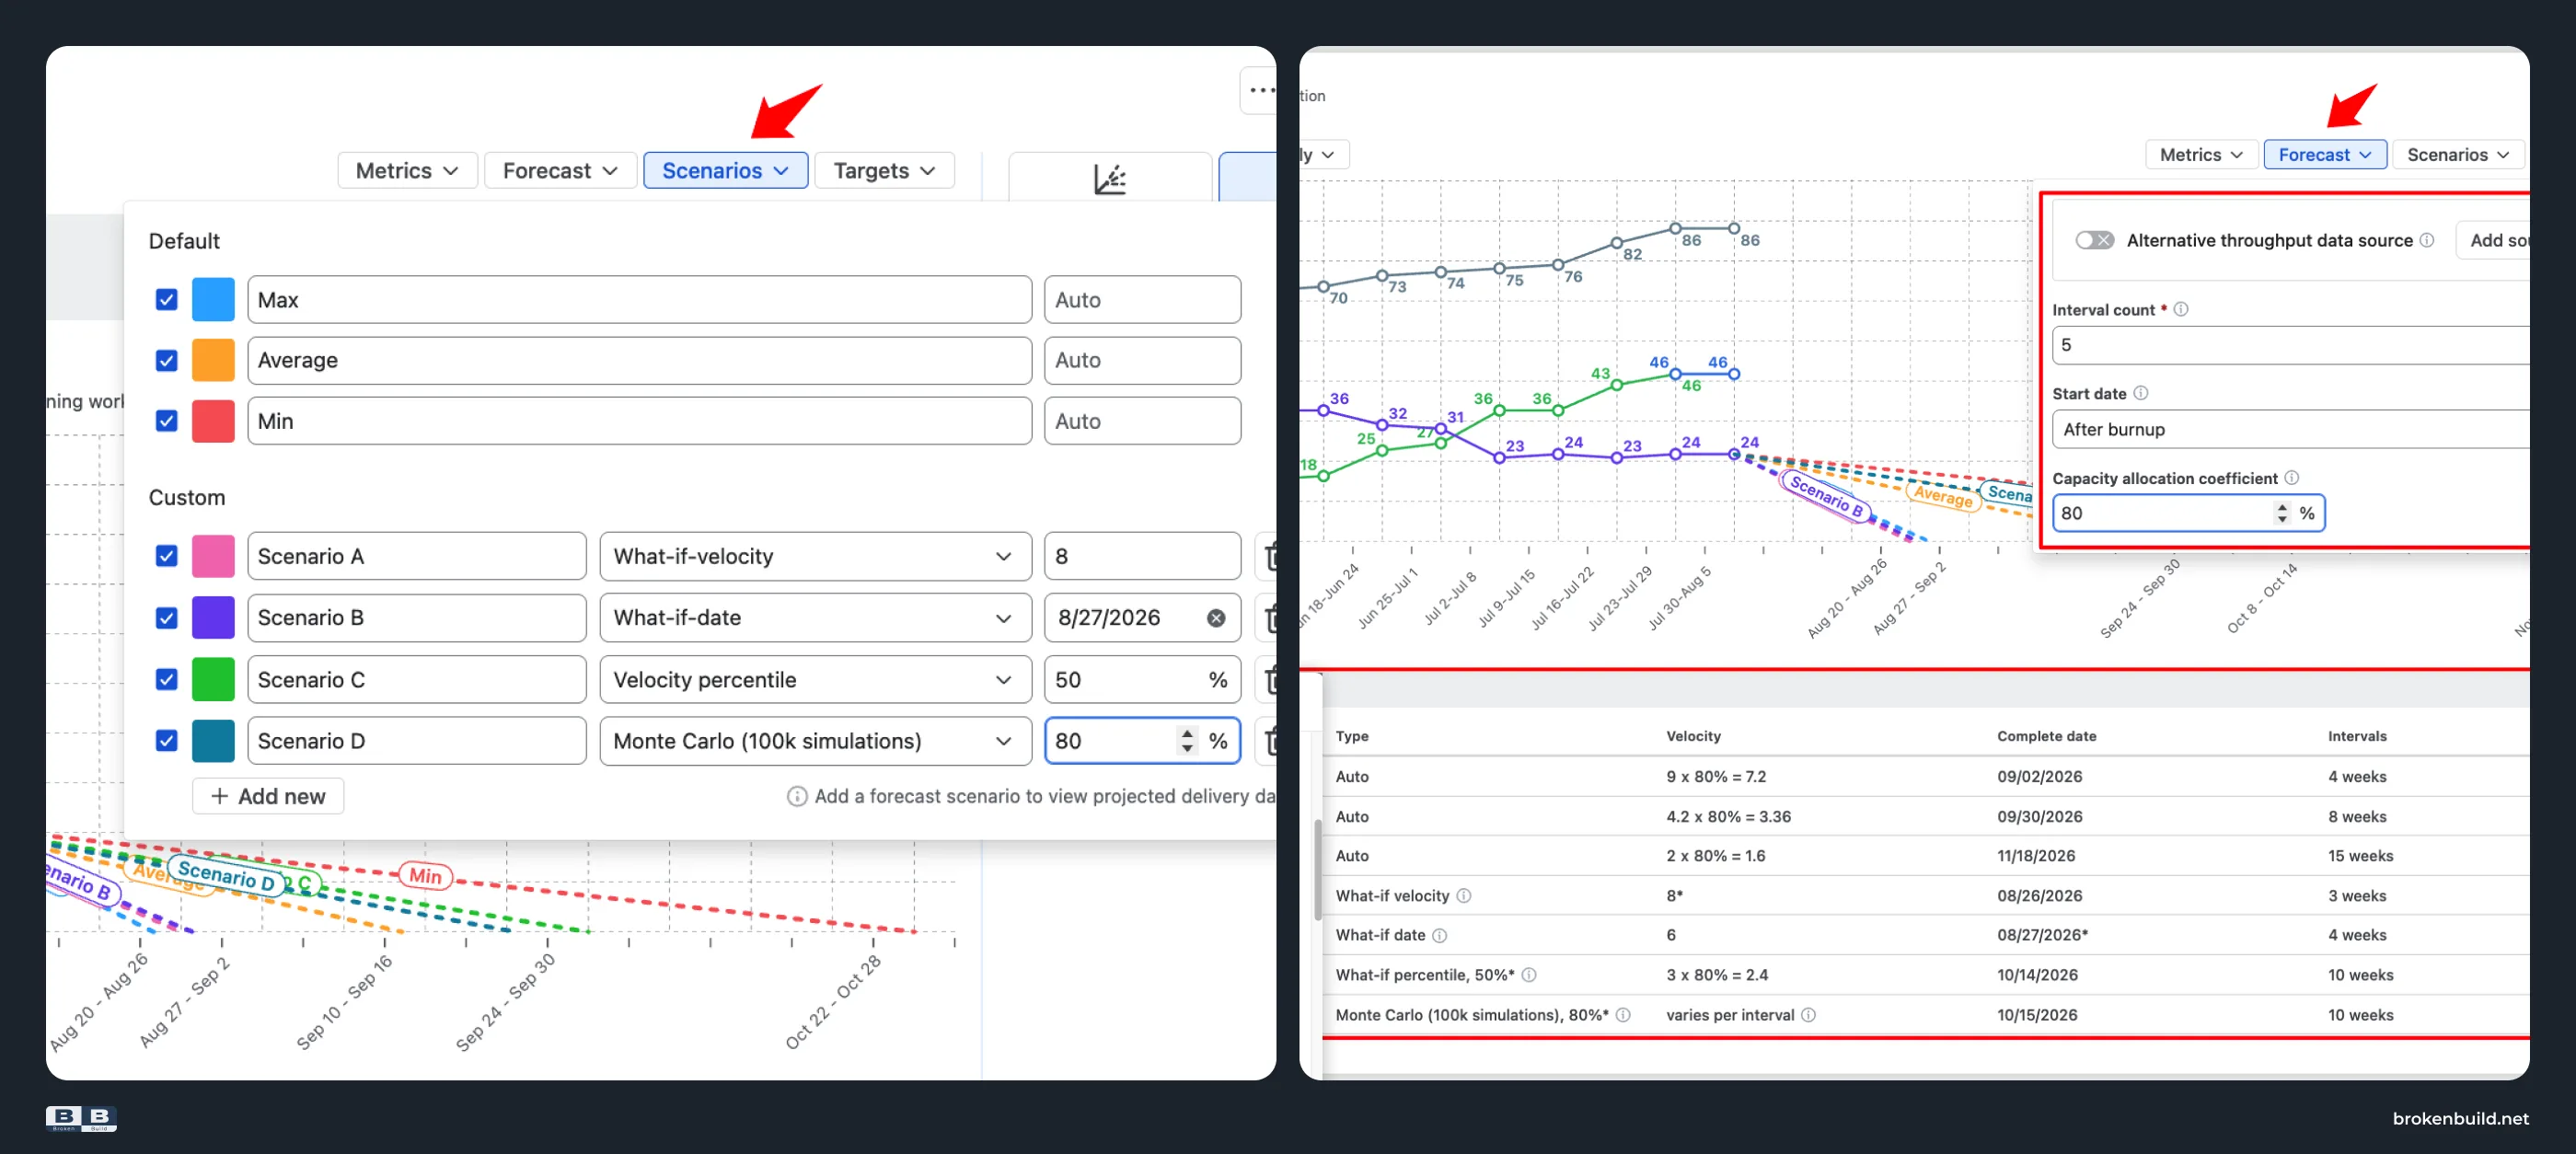
3️⃣ One recent-velocity projection → forecast scenarios
Native: The report projects remaining sprints from completed work in the last three sprints and total remaining work. That is useful as one recent-velocity assumption, but it does not let the team compare forecast scenarios.
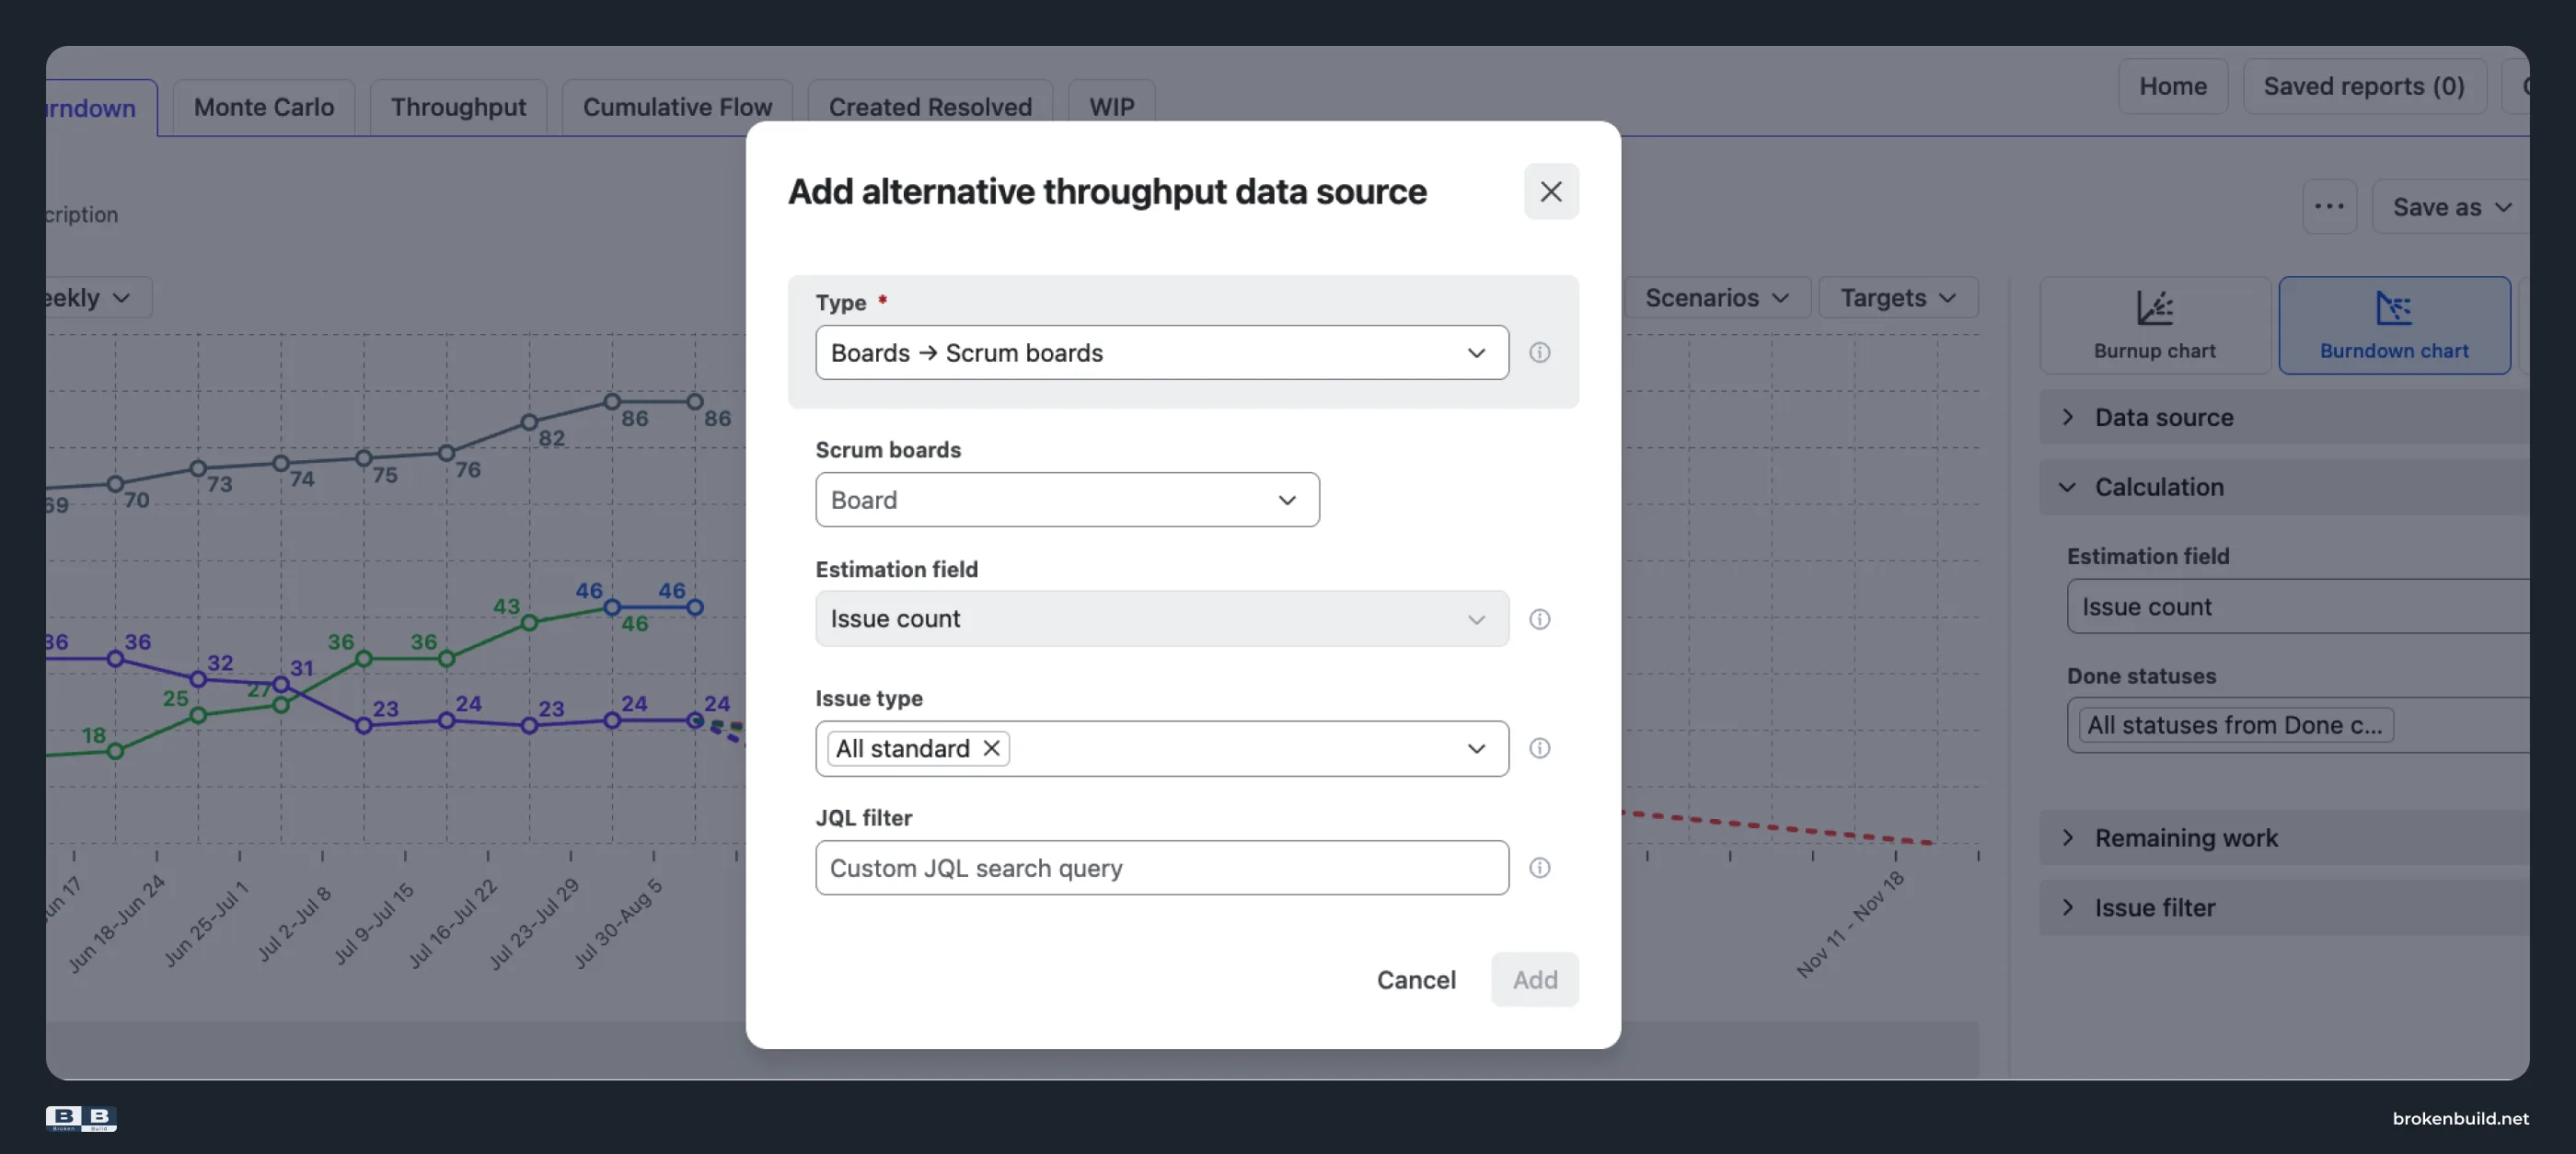
Epic Burndown chart by Broken Build: Compare the Max/Average/Min velocity, target date, target velocity, velocity percentile, and Monte Carlo scenarios. The documented forecast inputs include interval history, sprint length, forecast start date, capacity allocation, alternative throughput, scope growth, and epic estimates.
If the epic has little or no history, the alternative-throughput input can use another board, project, epic, initiative, or custom JQL scope. This provides a documented input for a new epic; it does not guarantee forecast quality.
4️⃣ Board estimation statistic → flexible estimation and Done rules
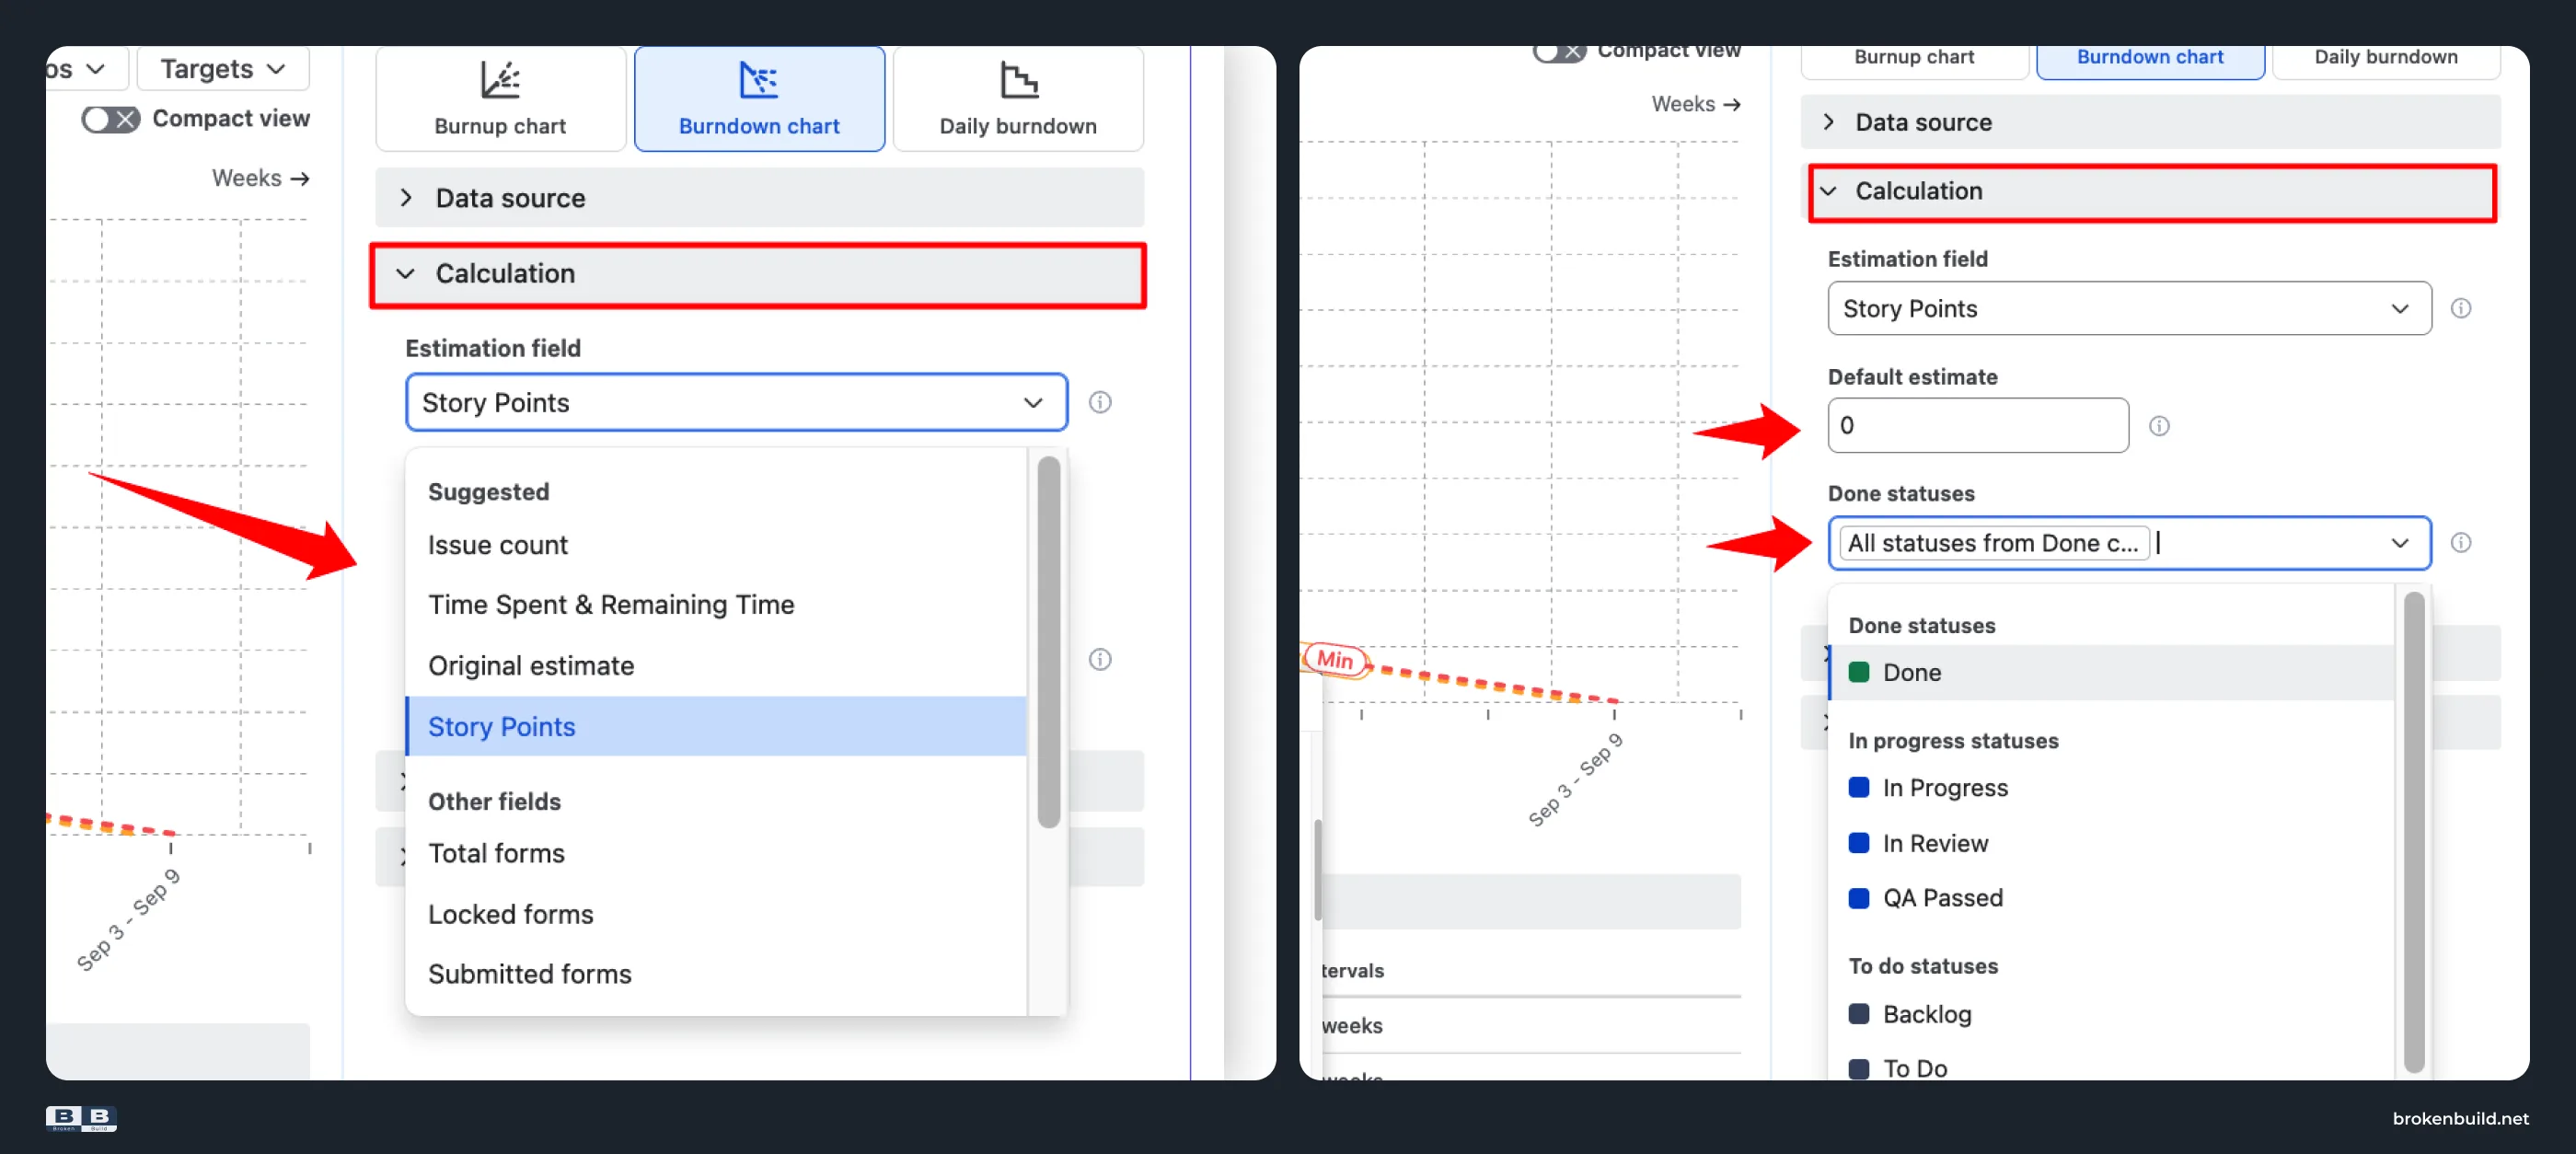
Native: The report uses the board’s estimation statistic. A high share of unestimated work can make the prediction less reliable, and the native workflow does not provide the same estimation and Done-status controls.
Epic Burndown chart by Broken Build: Choose the estimation field, configure default estimates, and define which Done statuses count for the chart.
5️⃣ Native issue inclusion → flexible issue filters
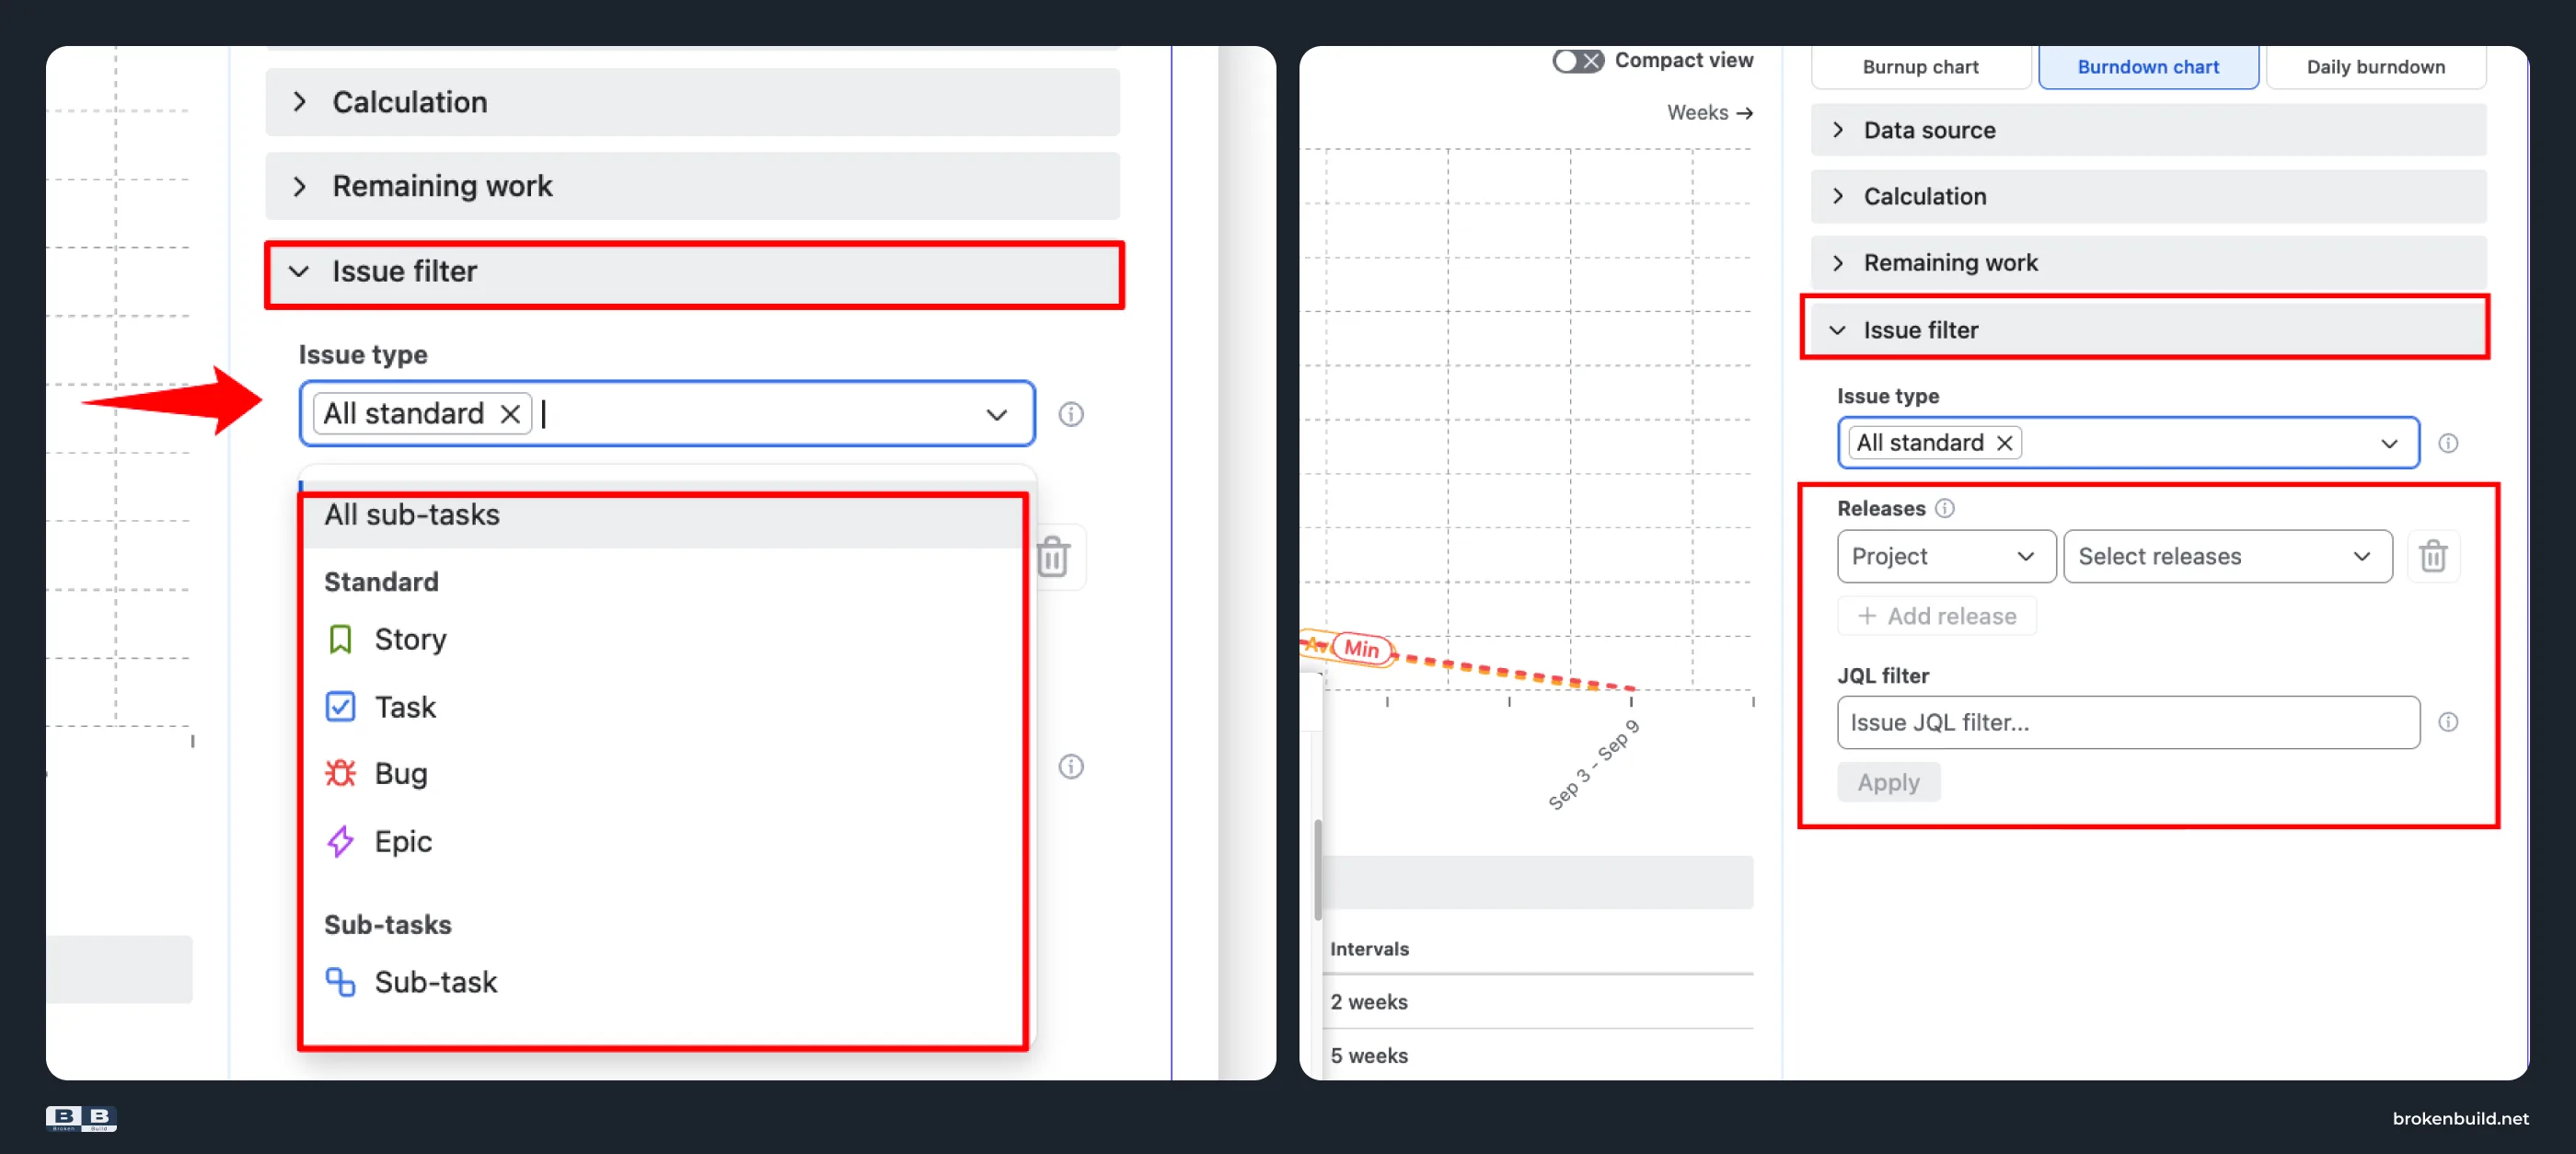
Native: The report is selected from an epic through a board filter. The supplied native report guidance does not document equivalent controls for filtering by issue type, additional epics, releases, or custom JQL.
Epic Burndown chart by Broken Build: Filter by issue types, specific epics, releases across projects, or custom JQL, including an all-subtasks option where supported by the workflow.
6️⃣ Native progress view → health metrics and scope context
Native: Epic Burndown shows progress and scope-change behavior. The supplied native report guidance does not document the Completed/Remaining/Total health-metric view described for the alternative workflow.
Epic Burndown chart by Broken Build: Read Completed, Remaining, and Total together with health metrics and tiles that make progress and scope change easier to interpret.
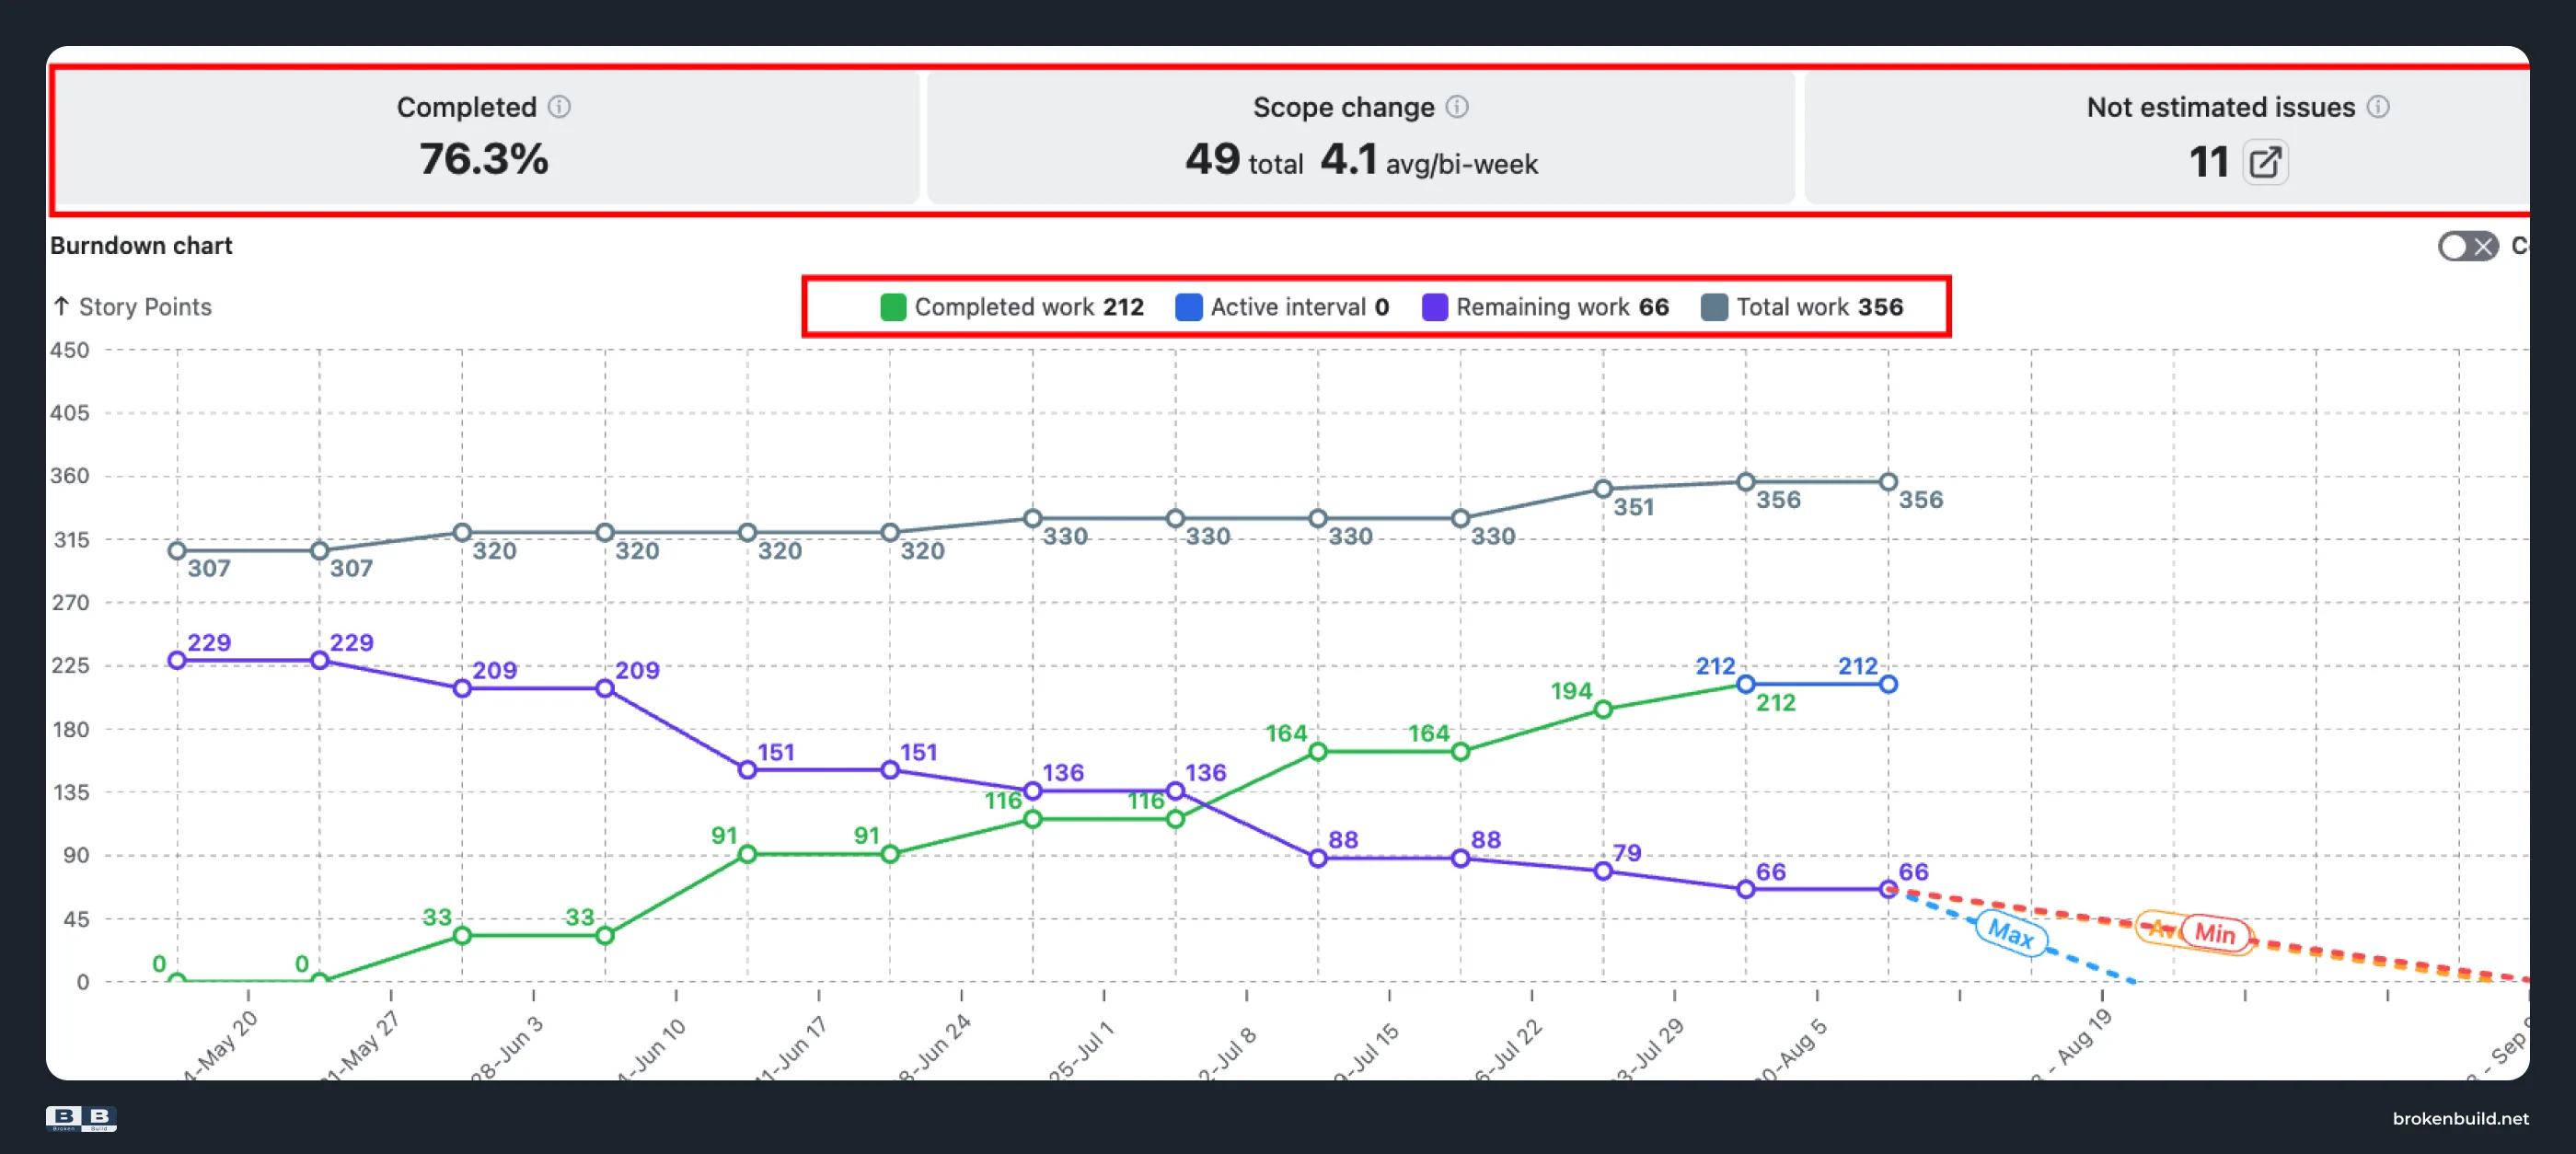
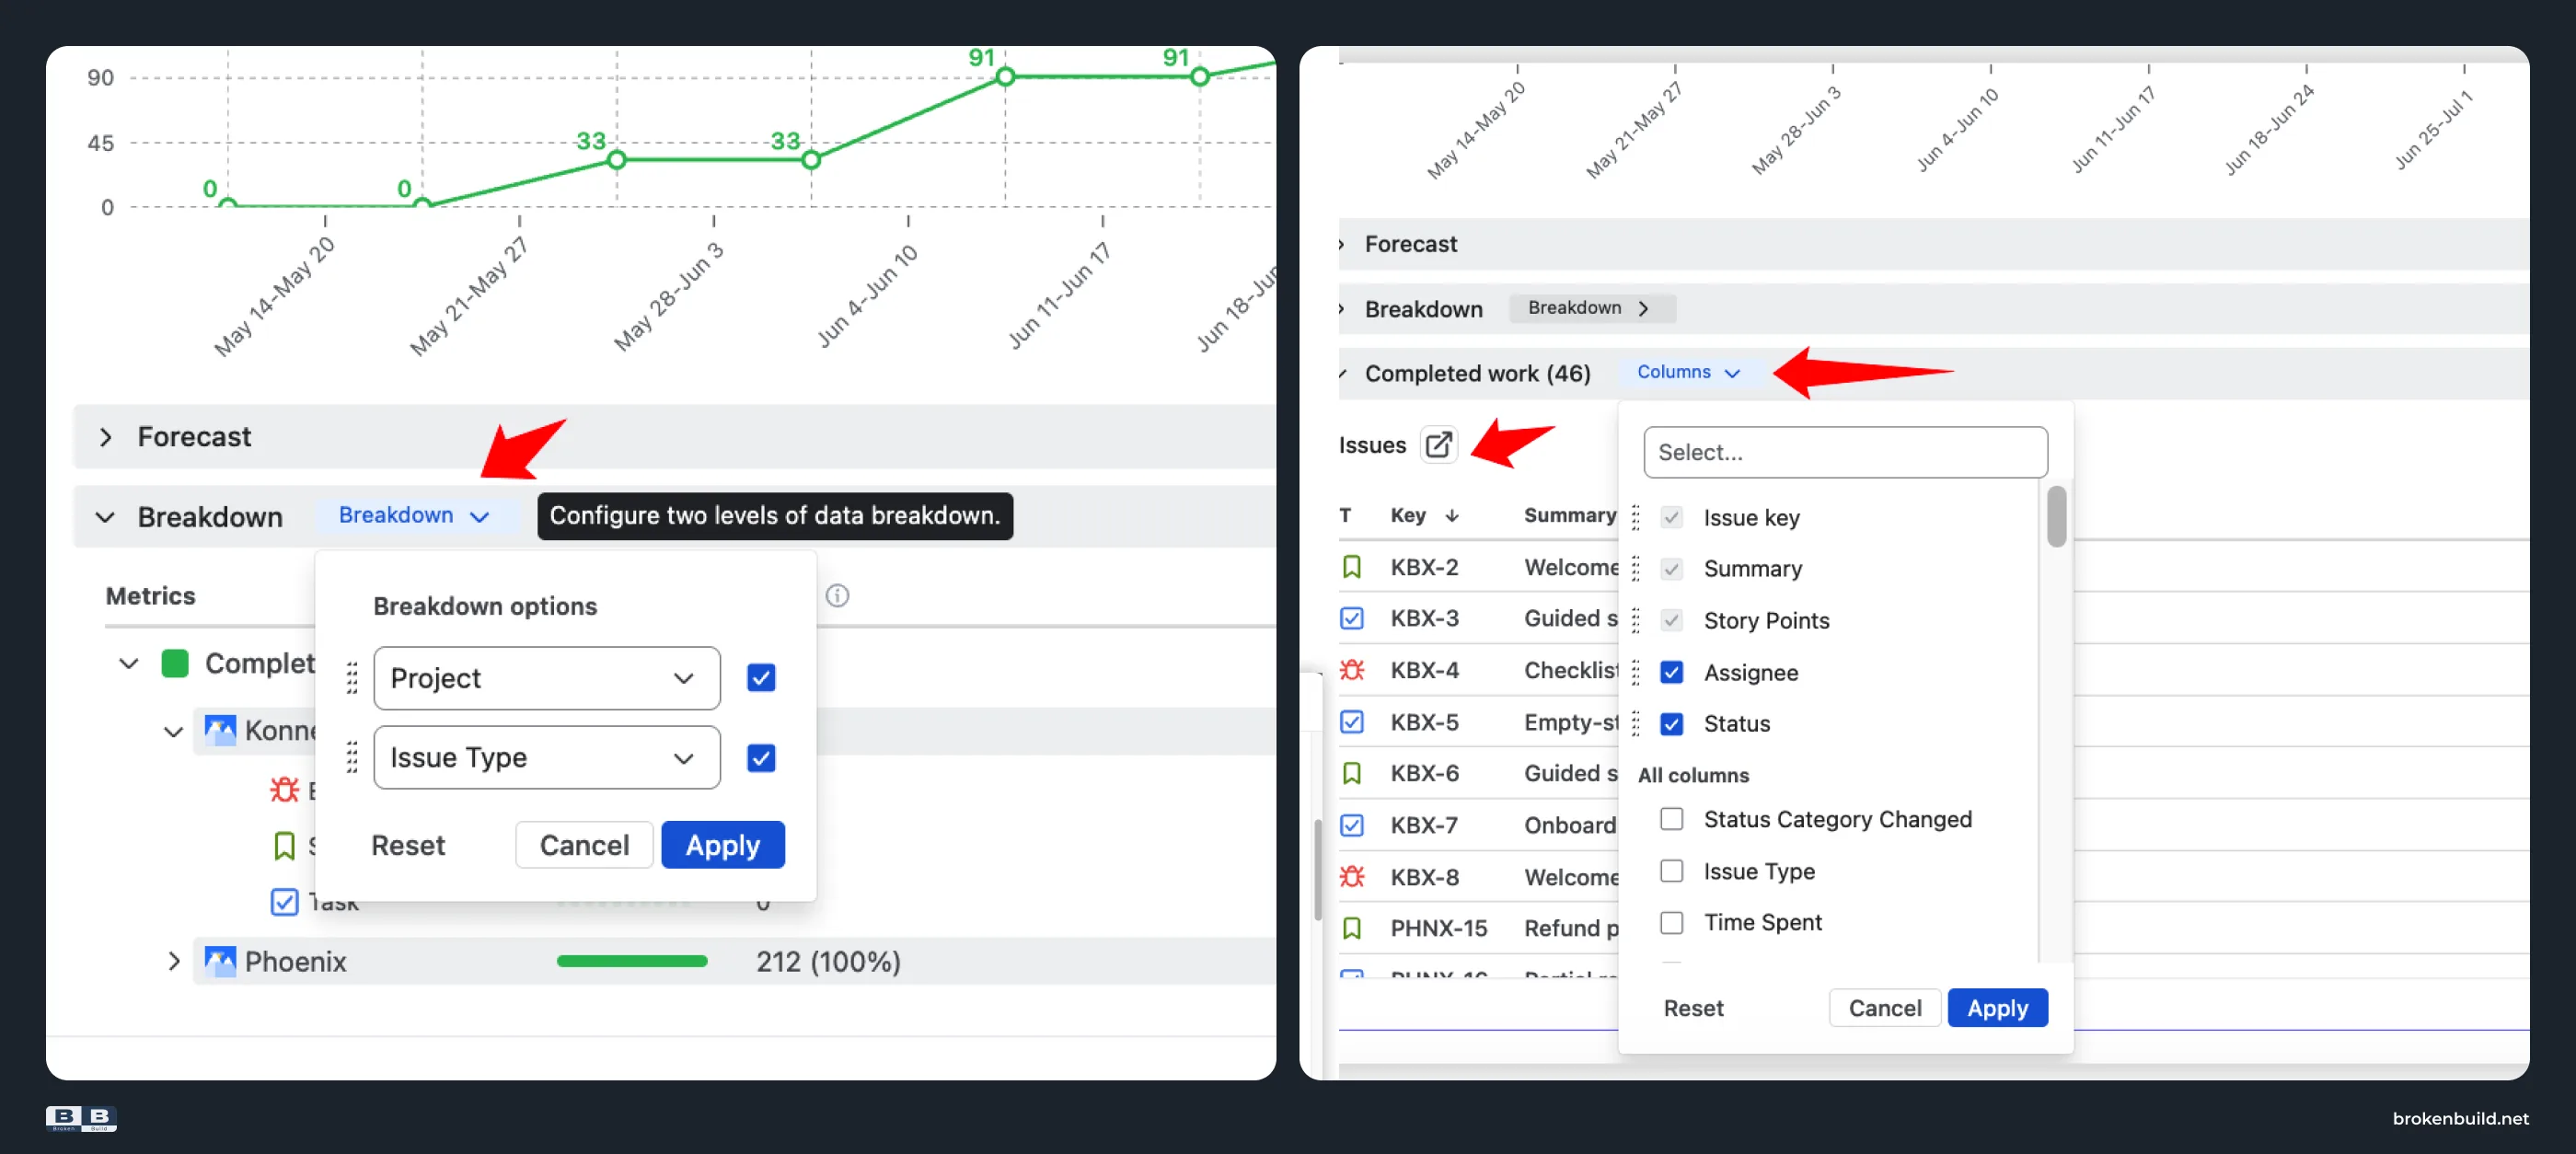
7️⃣ Report interpretation → breakdown and issue-list drill-down
Native: The supplied native report guidance focuses on interpreting the chart and navigating Jira; it does not document a dedicated breakdown and issue-list workflow for explaining what drove a change.
Epic Burndown chart by Broken Build: Open Breakdown and the issue list to inspect the Jira fields and specific tickets behind the chart.
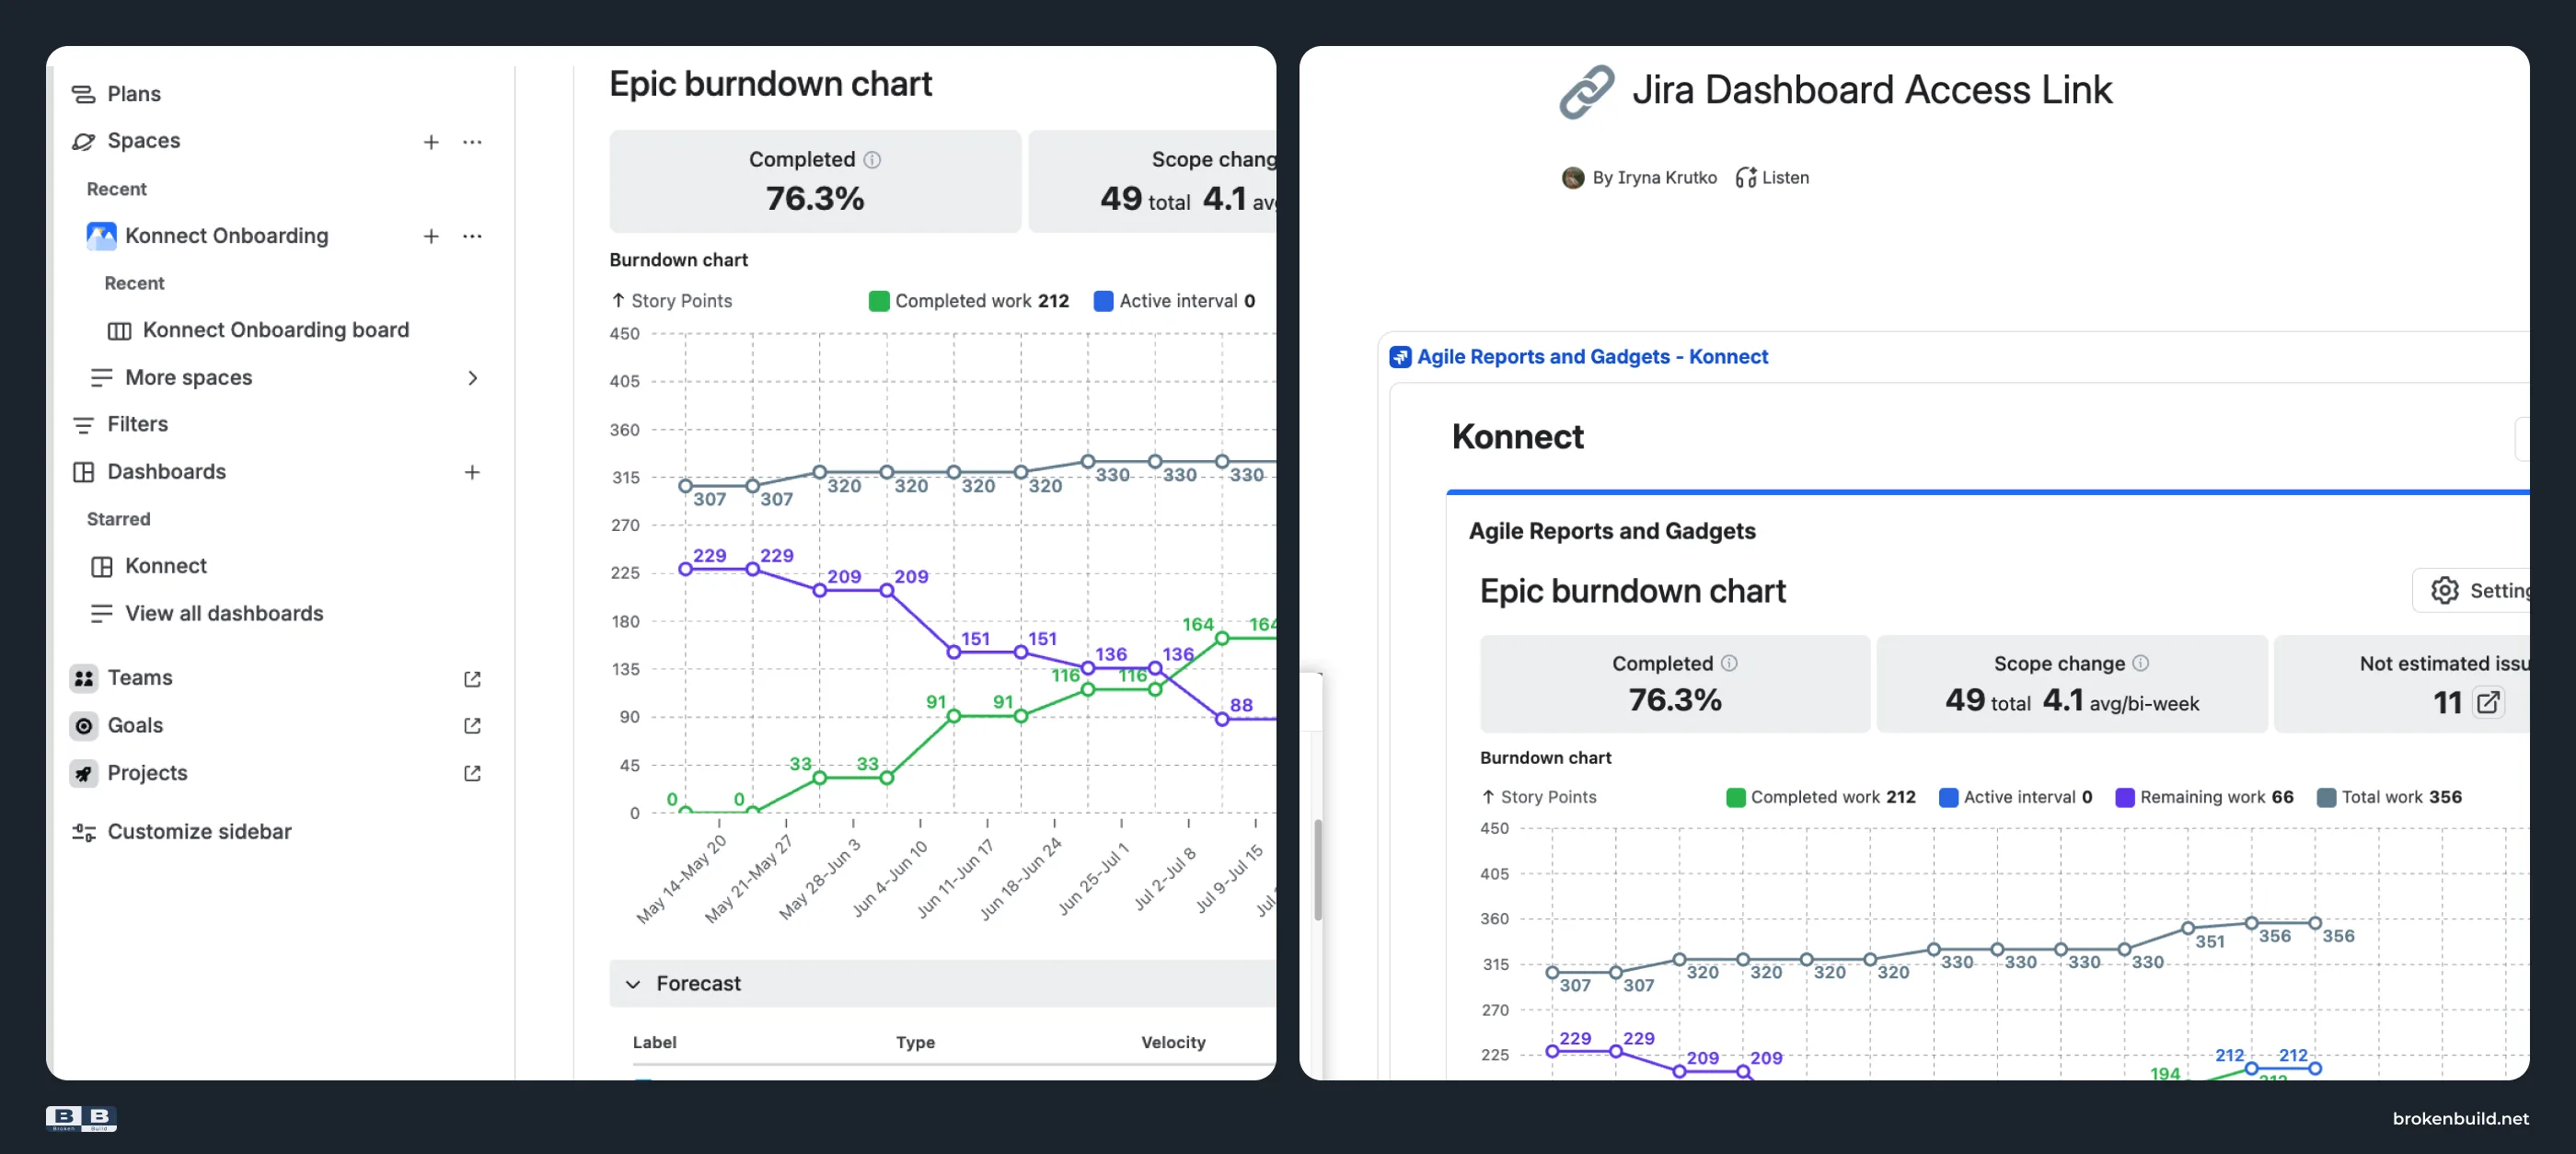
8️⃣ Reports page → dashboard and Confluence sharing
Native: Jira presents Epic Burndown from the Reports page. If stakeholders need a dashboard or Confluence view, verify the available sharing workflow and permissions for the tenant.
Epic Burndown chart by Broken Build: Share interactive charts through Jira dashboards and Confluence Smart Links, subject to tenant permissions and final workflow verification.
Five questions to ask
Ask:
- Do you need more than one epic or a cross-project scope in one chart?
- Do you need day/week or other non-sprint intervals, or a Kanban data source?
- Do you need to compare forecast assumptions rather than use one recent-velocity projection?
- Do you need configurable estimation or Done-status rules?
- Do stakeholders need an interactive Jira dashboard or Confluence view?
One “yes” does not make the native report wrong. It identifies a requirement to compare against the Agile Burnup Burndown Charts by Broken Build.
A practical workflow
Menus can vary by Jira tenant, so verify the final workflow against the current product view before rolling it out to a team.
- Define the decision: one epic, multiple epics, project/release scope, or a JQL-defined set.
- Choose the chart data source. Agile Burnup Burndown Charts supports epics, projects, releases, initiatives, Scrum boards, Kanban boards, and JQL filters.
- Refine issue inclusion by issue type, additional epics, releases, or custom JQL where the workflow supports it.
- Select the estimation field and decide how unestimated issues and Done statuses should be handled.
- Choose the interval and customize forecast inputs relevant to the decision.
- Customize forecast scenarios by comparing Max/Average/Min velocity, target date, target velocity, percentile, or Monte Carlo. Choose the scenario that matches the decision you are making.
- Read Completed, Remaining, and Total together, then inspect health metrics where enabled.
- Open Breakdown and the issue list to investigate a change in progress or scope.
- Share the chart through its Jira dashboard or Confluence Smart Link workflow, subject to tenant permissions and final UI verification.
See the Epic Burndown chart by Broken Build in action while reviewing the workflow.


Which chart fits your delivery question?
Start with native Jira Epic Burndown when you need to read one epic’s Scrum progress and its recent-velocity projection. Choose the Agile Burnup Burndown Charts by Broken Build when you need multiple epics or projects, configurable forecast scenarios, flexible estimation, progress and health visibility, drill-down, or interactive sharing.
Agile Burnup Burndown Charts is available as a standalone app or as part of the Agile Reports and Gadgets bundle. The bundle brings together nine agile chart types: Velocity, Cycle Time, Time in Status, Burnup Burndown, Monte Carlo, Throughput, Cumulative Flow, Created vs Resolved, and WIP. It also includes ready-to-use templates for teams that need reporting beyond epic forecasting.




.png)