

Native Jira sprinkles hints of scope change across several reports – asterisks on added items in Sprint Report, dark blue segments in Release Burndown and Epic Burndown – but never publishes scope change as a quantified metric you can trend, target, benchmark, or drill into. Broken Build's Agile Reports and Gadgets make scope change a first-class number – per sprint, per release, per epic – with drill-down to the work items driving it.
What is scope change in Agile?
Scope change is work added, removed, or re-estimated after a sprint, release, or epic begins. The Scrum Guide says scope "may be clarified and re-negotiated between the Product Owner and Developers as more is learned." Scope change is expected, not forbidden.
The question is not whether scope changes – it is whether you can see and manage it.
Mountain Goat Software puts it directly: "A Sprint Backlog should change during the sprint as developers learn things and may discover new tasks, remove unnecessary tasks, or change estimates."
Scope change vs scope creep: Scope change is neutral – it can be healthy adaptation or unhealthy churn. Scope creep is uncontrolled scope change that risks the sprint goal or release date. The difference is visibility: if you can see the number, you can manage it.
Where native Jira shows scope change – and where it stops
Native Jira acknowledges that scope change happens. It just does not help you manage it.
Sprint Report: asterisks
The Sprint Report flags mid-sprint additions with an asterisk (*). If a work item was added after the sprint started, it gets an asterisk in the "Completed" list.
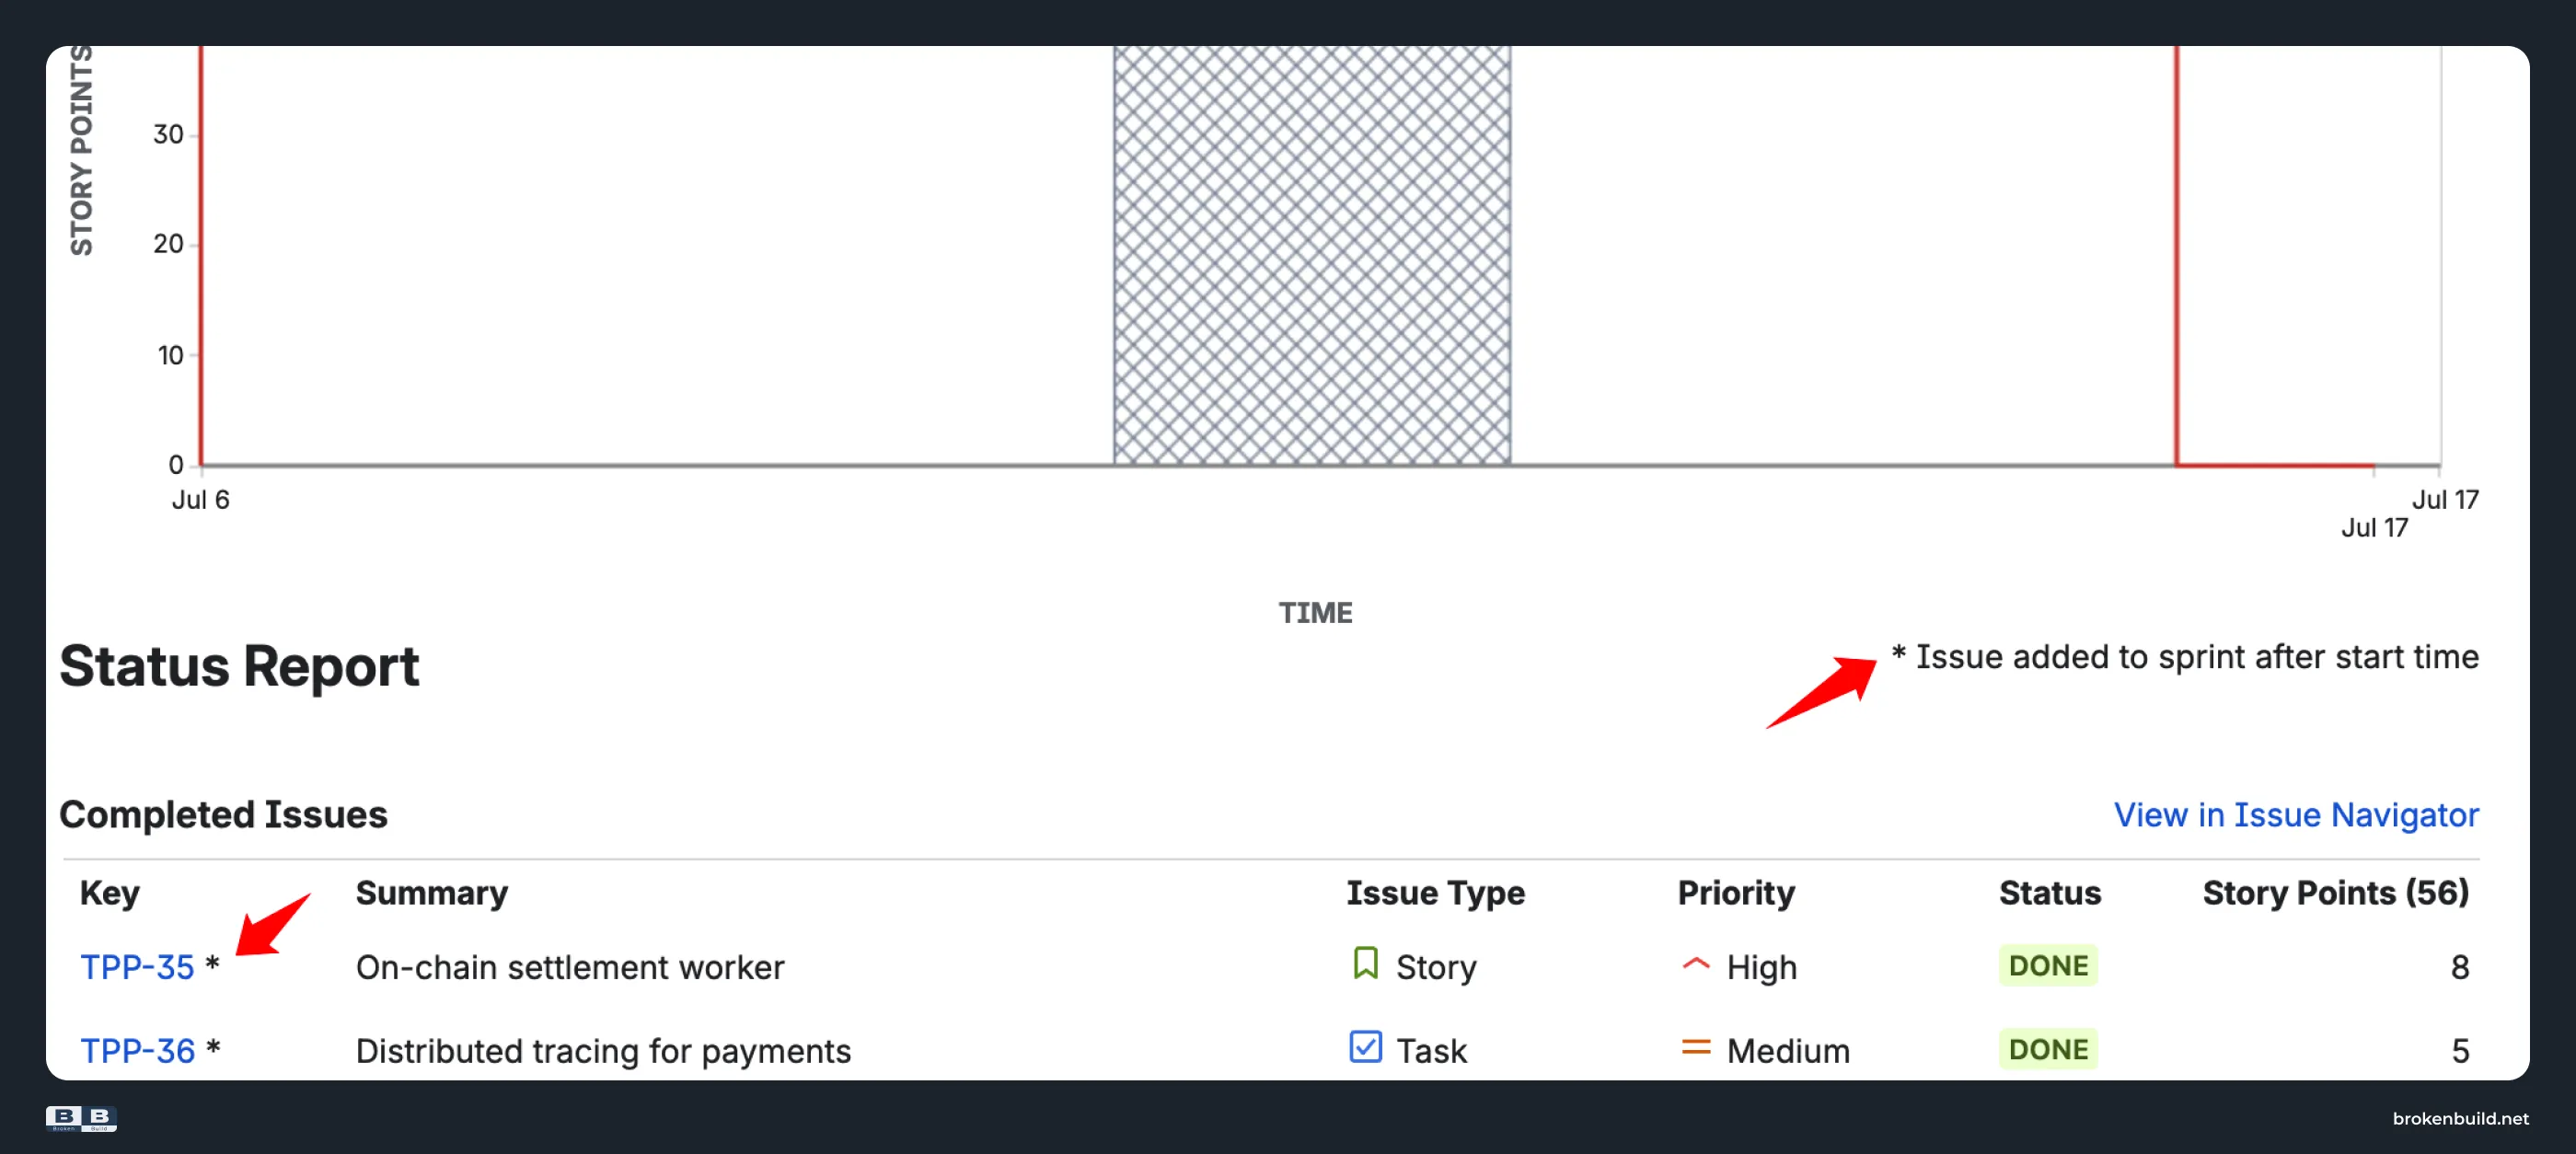
What the asterisk lacks:
- No aggregate number – you cannot quote "15 story points added mid-sprint" to a stakeholder
- No trend – you cannot see "is scope creep getting worse over the last 6 sprints?"
- No distinction between added, removed, and re-estimated
- No drill-down to see which work items drove the change
Release Burndown and Epic Burndown: dark blue segments
The Release Burndown and Epic Burndown show a dark blue bar segment per sprint representing "work added during the sprint."
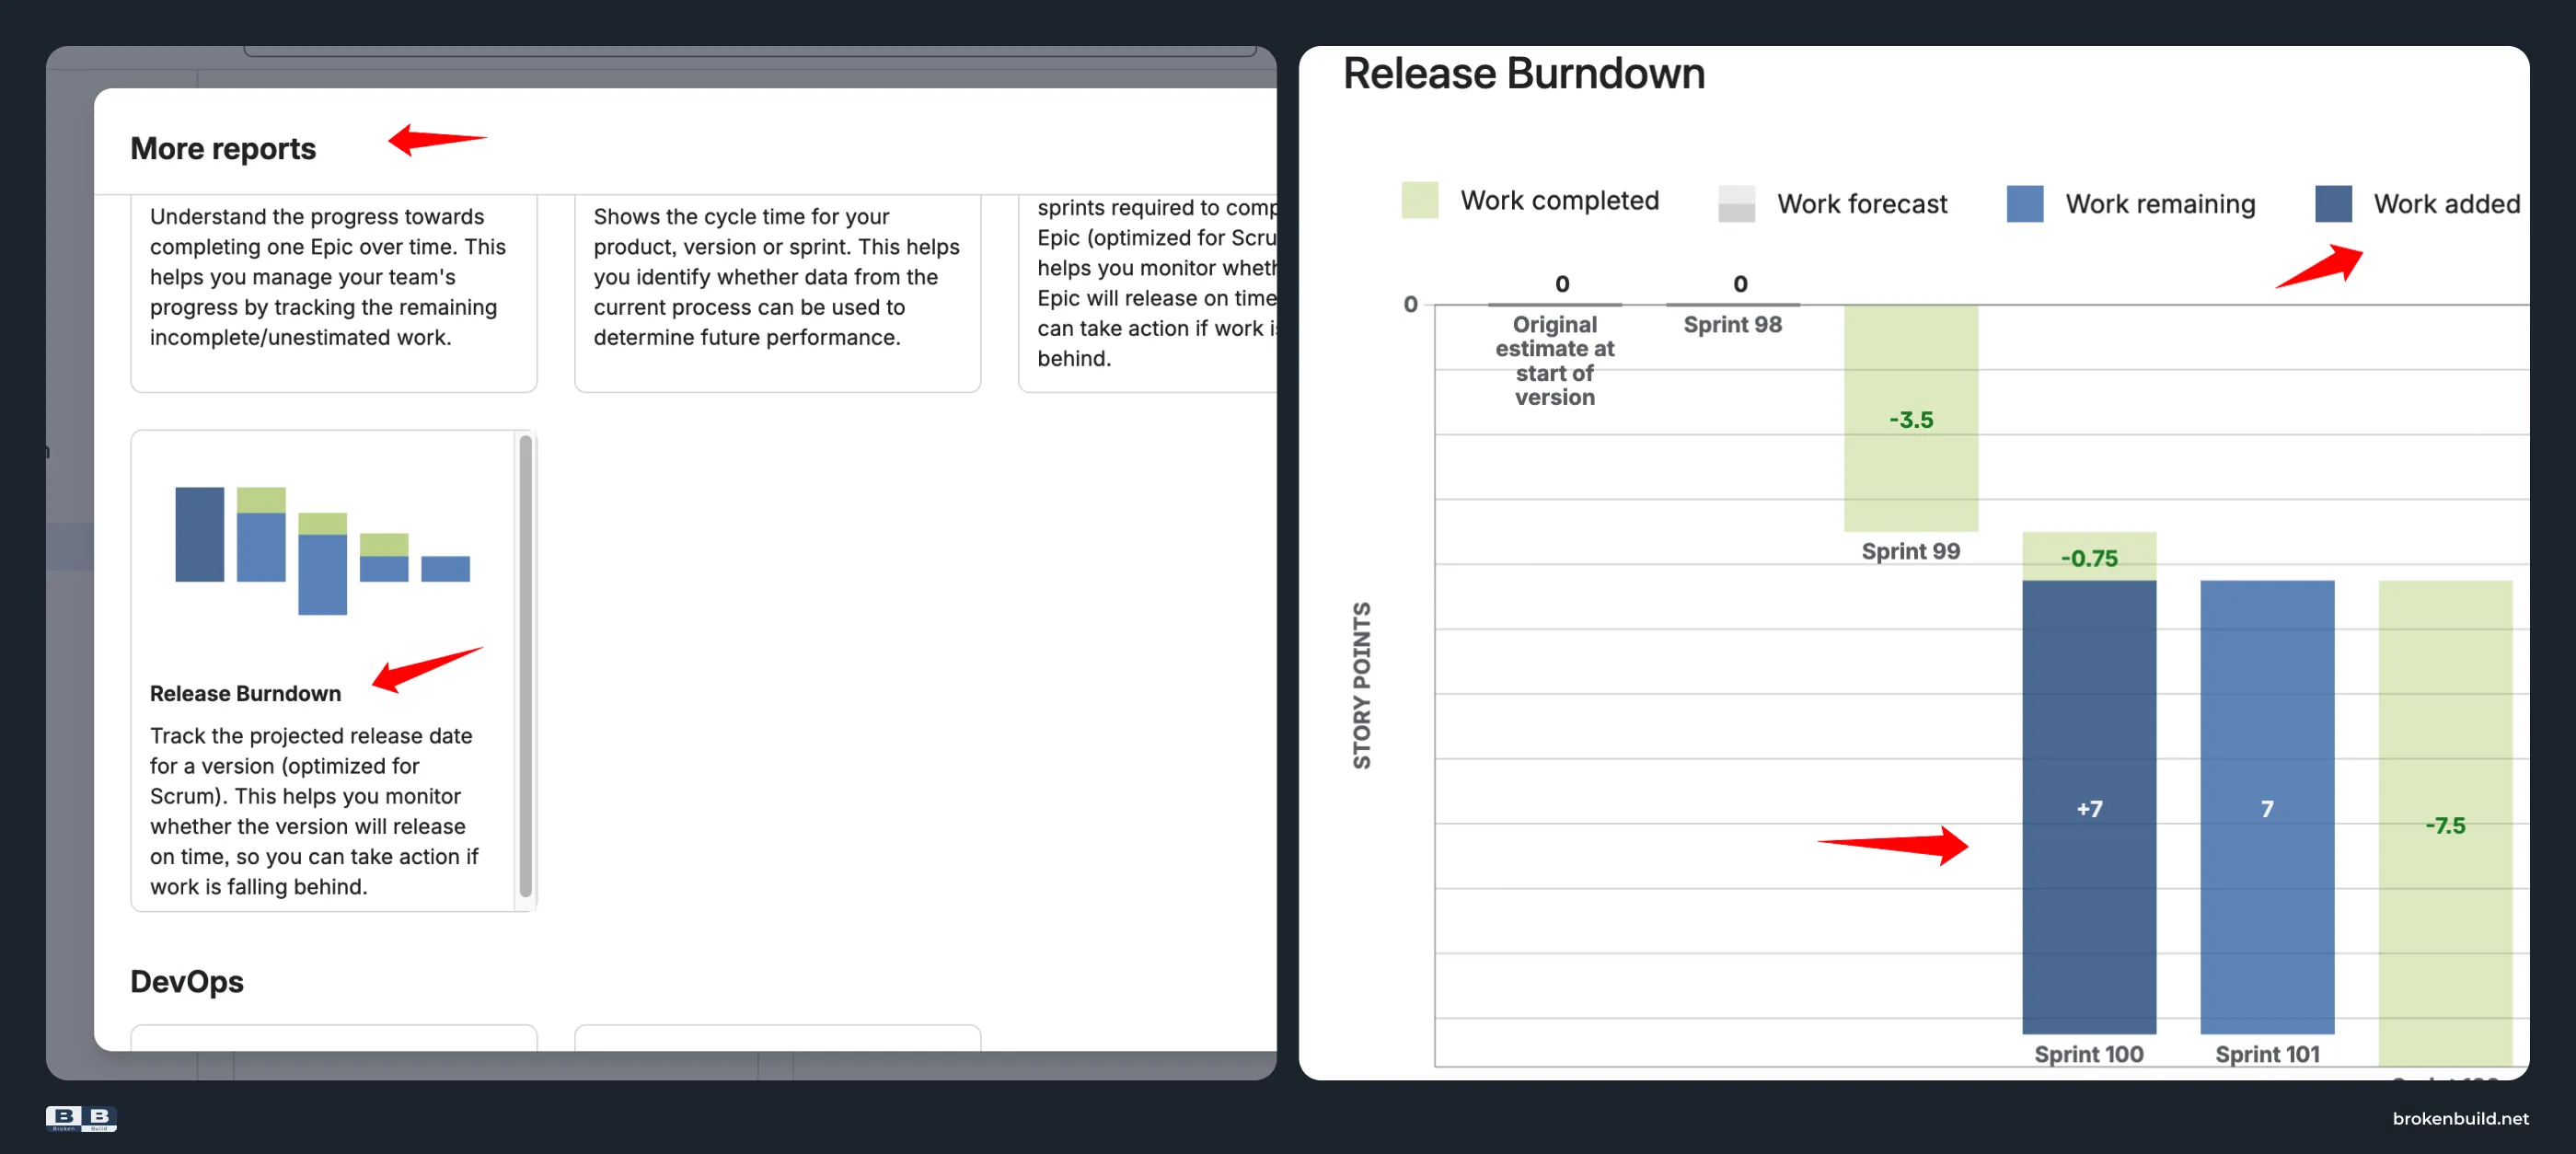
What the segment lacks:
- No explicit number – just a colored shape
- No trend view – "how has scope creep evolved across this release?"
- No breakdown by epic, assignee, or work item type
- No percentage view to normalize across sprints of different sizes
- Scrum-only – Kanban teams have no Release Burndown at all
Velocity Chart: nothing
The native Velocity Chart shows only Commitment, Completed, and an Average line. There is no scope change metric. If a team misses its sprint goal, native cannot tell you whether it was scope creep, rollover, or estimation drift.
Turn scope change into a real metric
Two Broken Build apps turn native hints into quantified, trendable, drillable scope change metrics.
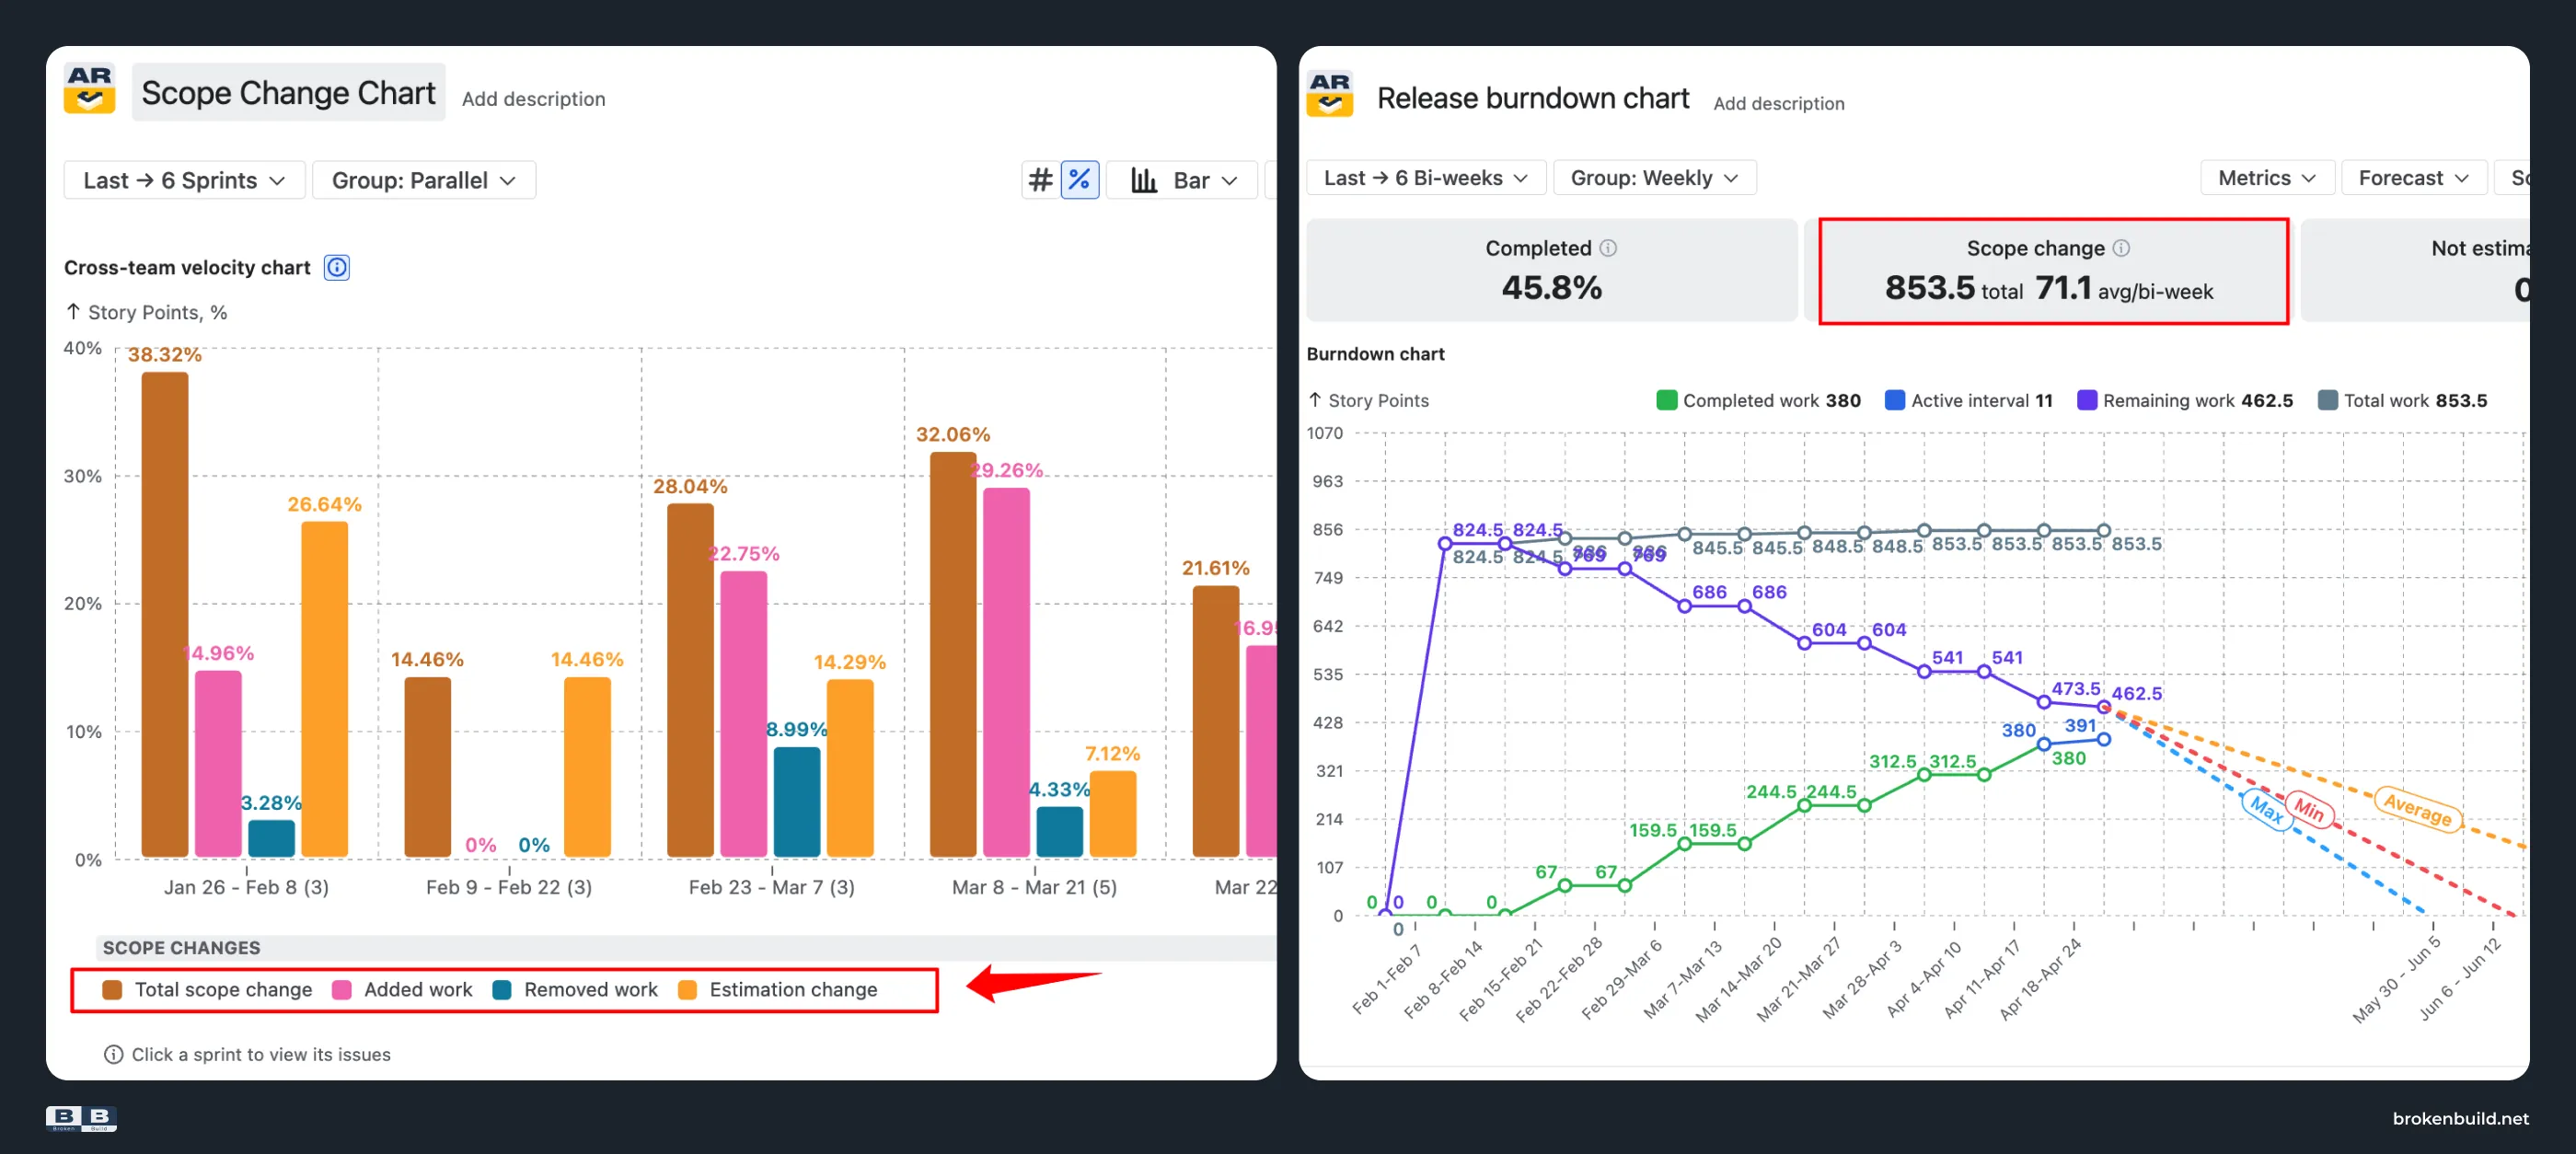
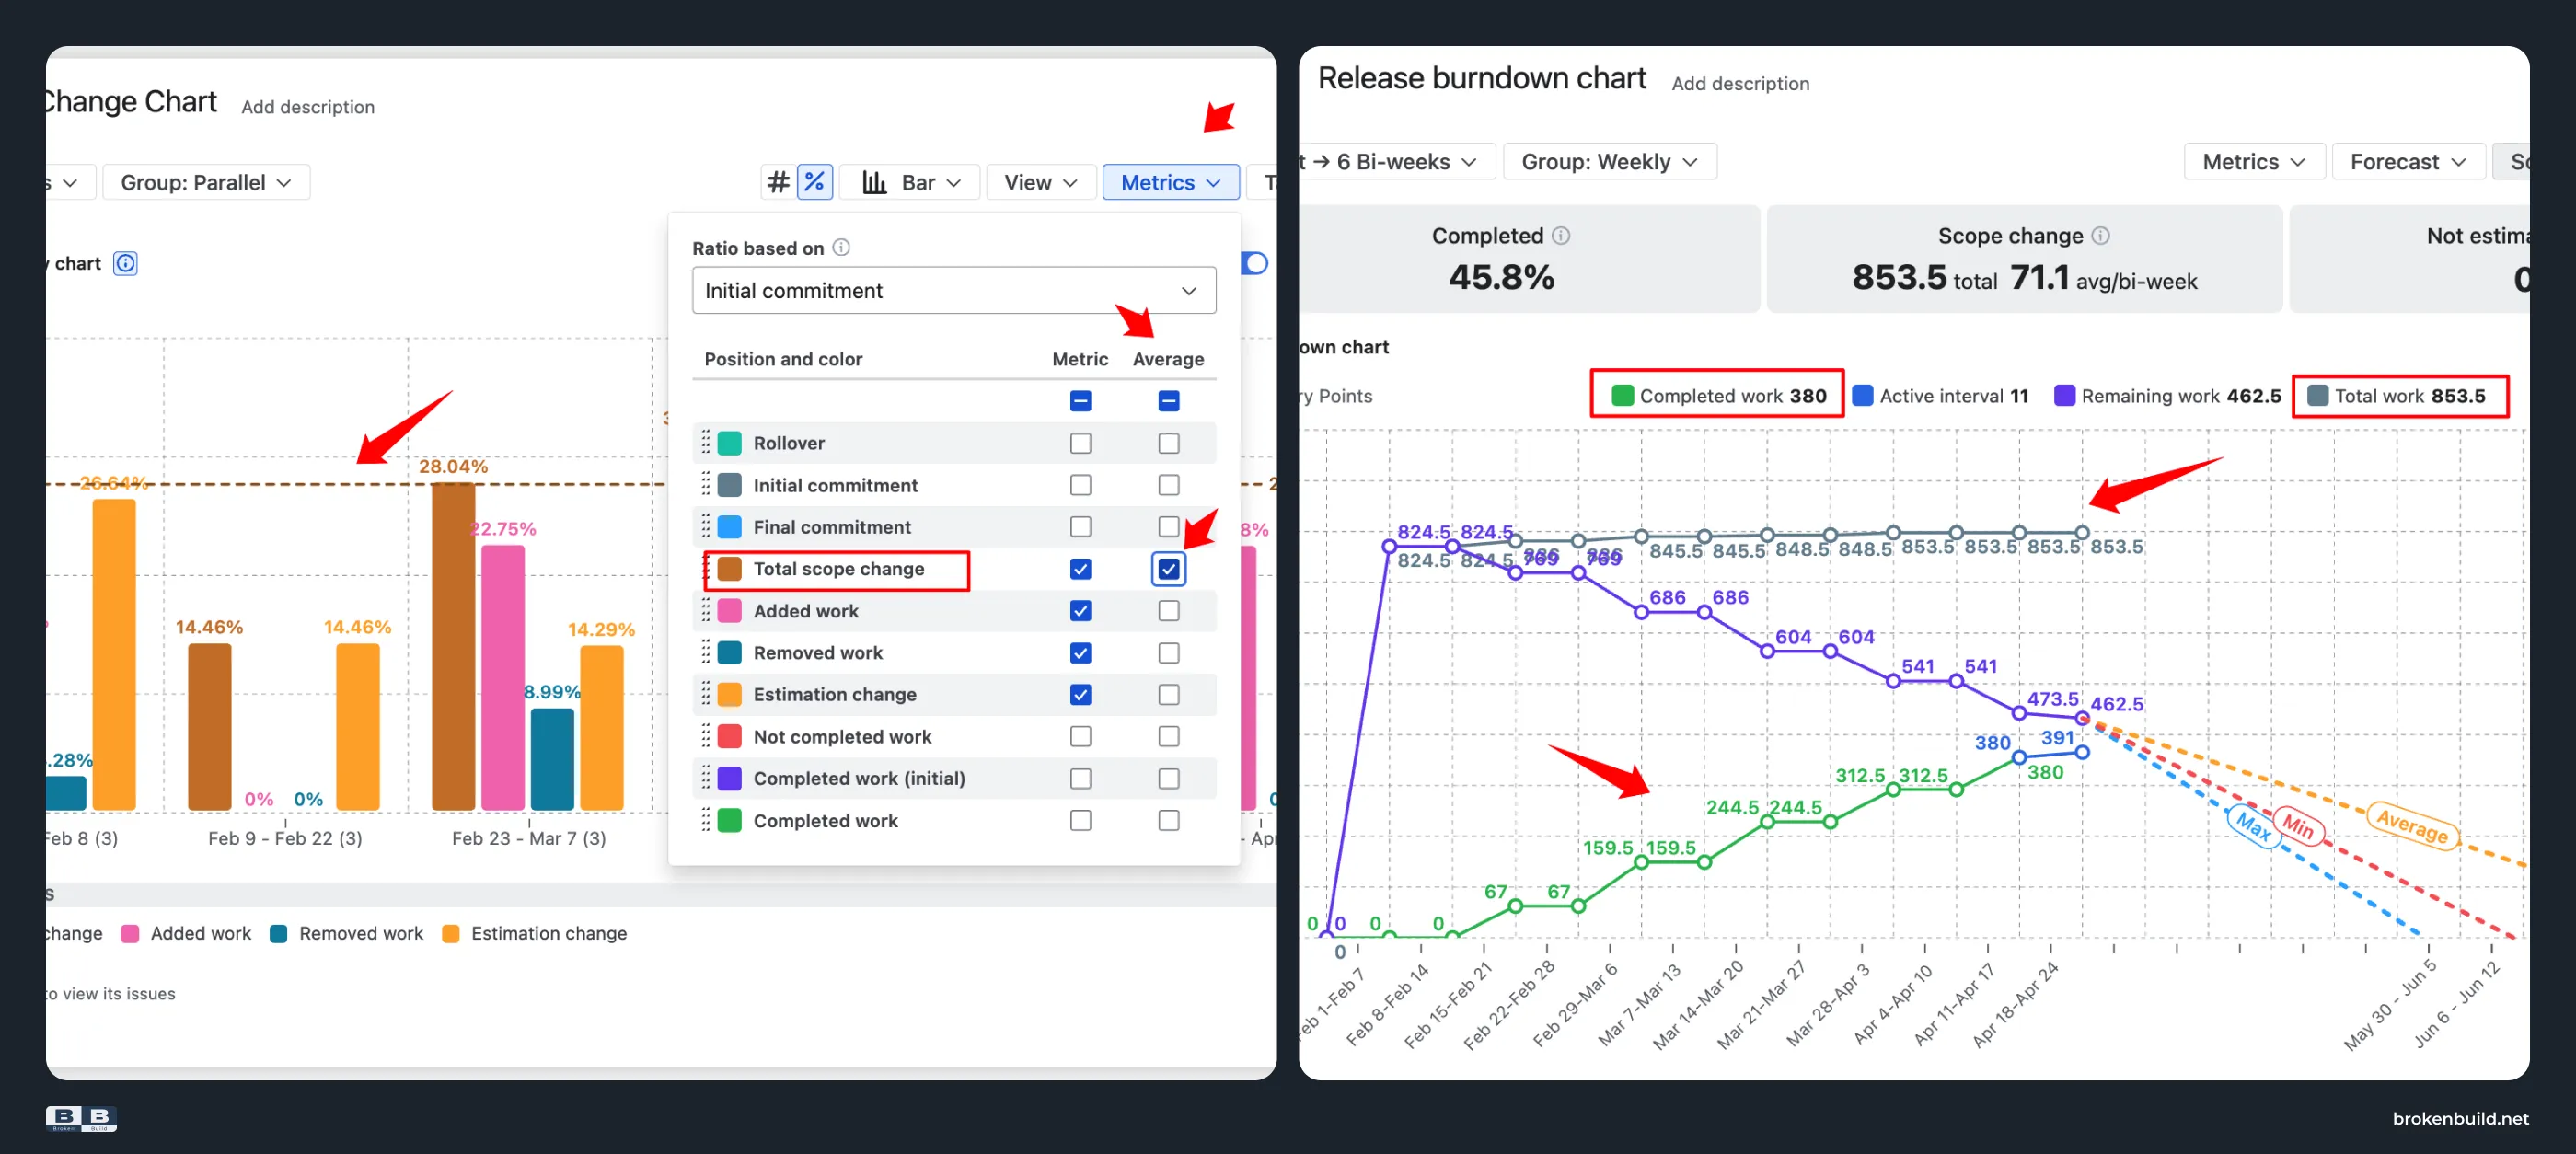
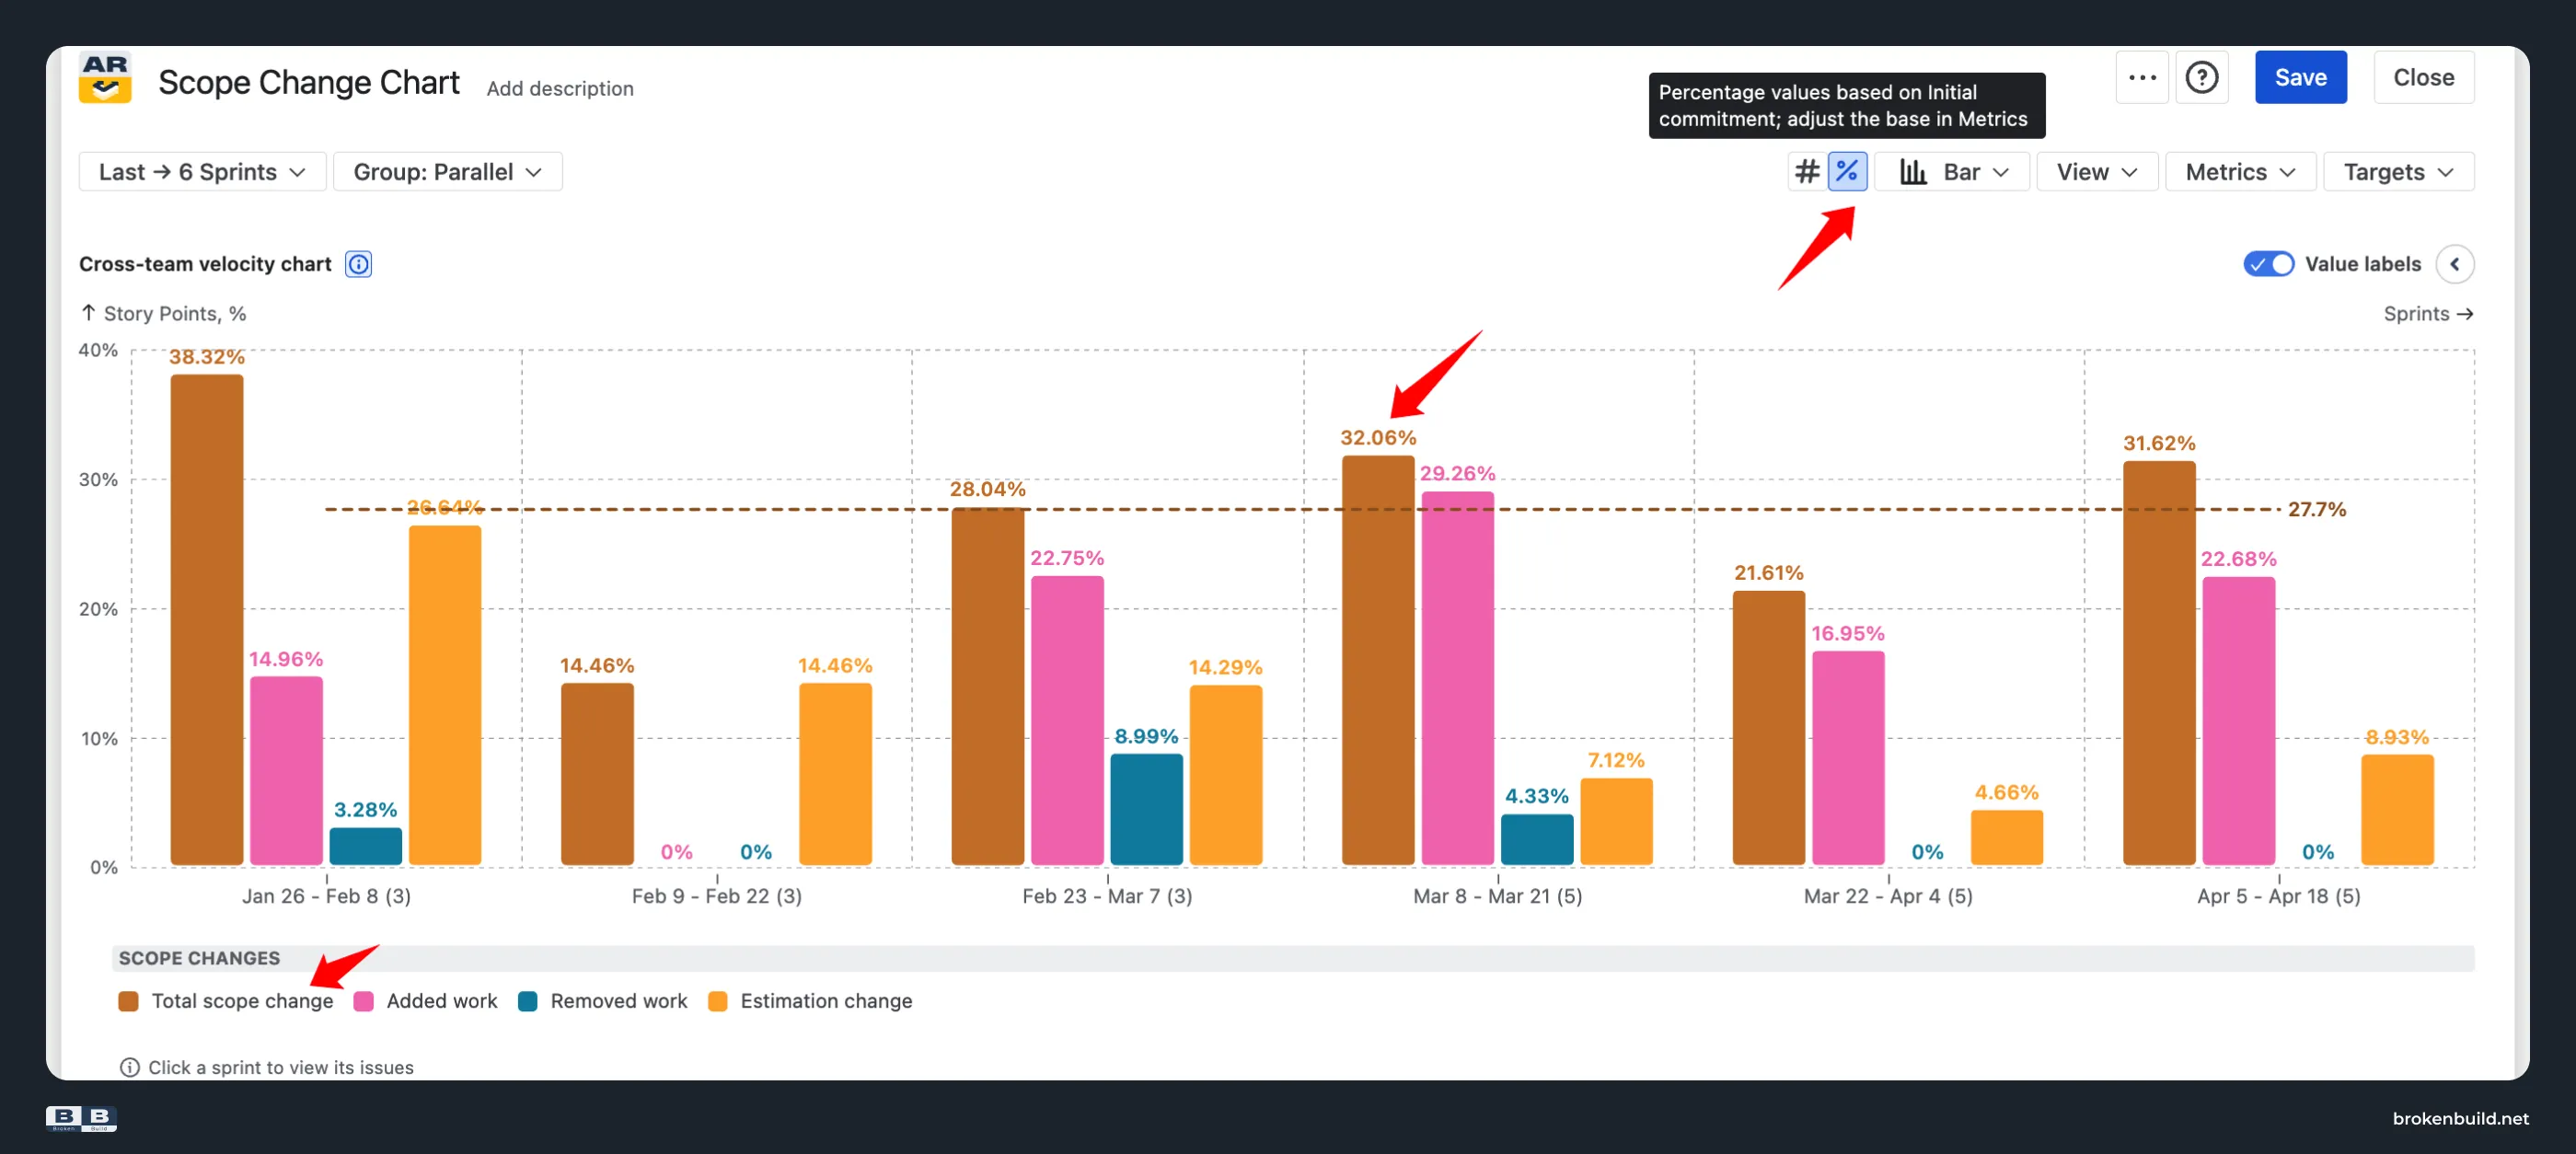
Agile Velocity Charts track four scope change metrics per sprint – Total scope change, Added work, Removed work, Estimation change – as part of a ten-metric diagnostic set. Switch between absolute values and percentage view normalized against Initial or Final commitment. Add targets, compare teams, drill into the work items driving each bar.
Agile Burnup Burndown Charts publishes a Scope change health tile with per-interval average, visualizes the Total work line evolving over time, and models expected scope growth into forecasts.
Both apps work with any data source – Scrum boards, Kanban boards, projects, releases, epics, saved filters, custom JQL, or any combination.
Both are also included in Agile Reports and Gadgets – a bundle that adds cycle time charts, throughput analytics, cumulative flow diagrams, Monte Carlo forecasting, and other agile metrics.
Where native falls short – and what closes each gap
1️⃣ Asterisks and colored segments → explicit numbers
Native Jira: The Sprint Report flags mid-sprint additions with asterisks; Release Burndown and Epic Burndown color-code them as dark blue bar segments. Neither publishes a number.
Agile Reports and Gadgets by Broken Build: Four explicit scope change metrics per sprint (Total scope change, Added work, Removed work, Estimation change) in Agile Velocity Charts. Plus a Scope change health tile in Agile Burnup Burndown Charts – all trendable, targetable, and quotable to stakeholders.
2️⃣ No trend → scope change over time
Native Jira: Dark blue segments are per-sprint hints on one report. There is no way to trend "how has scope creep evolved?"
Agile Reports and Gadgets by Broken Build: Agile Velocity Charts plots scope change per sprint as a metric line; a growing trend becomes visible immediately. Agile Burnup Burndown Charts show the Total work line evolving over time alongside the Completed line.
3️⃣ Absolute only → percentage view for normalized comparison
Native Jira: Shows only absolute story-point values. No percentage view, no normalized comparison across sprints of different sizes.
Agile Velocity Charts by Broken Build: Percentage view lets you compare scope change across sprints of different sizes – "10 SP added" on a 30-SP sprint (33%) reads differently from "10 SP added" on a 100-SP sprint (10%).
4️⃣ No targets → KPI overlays
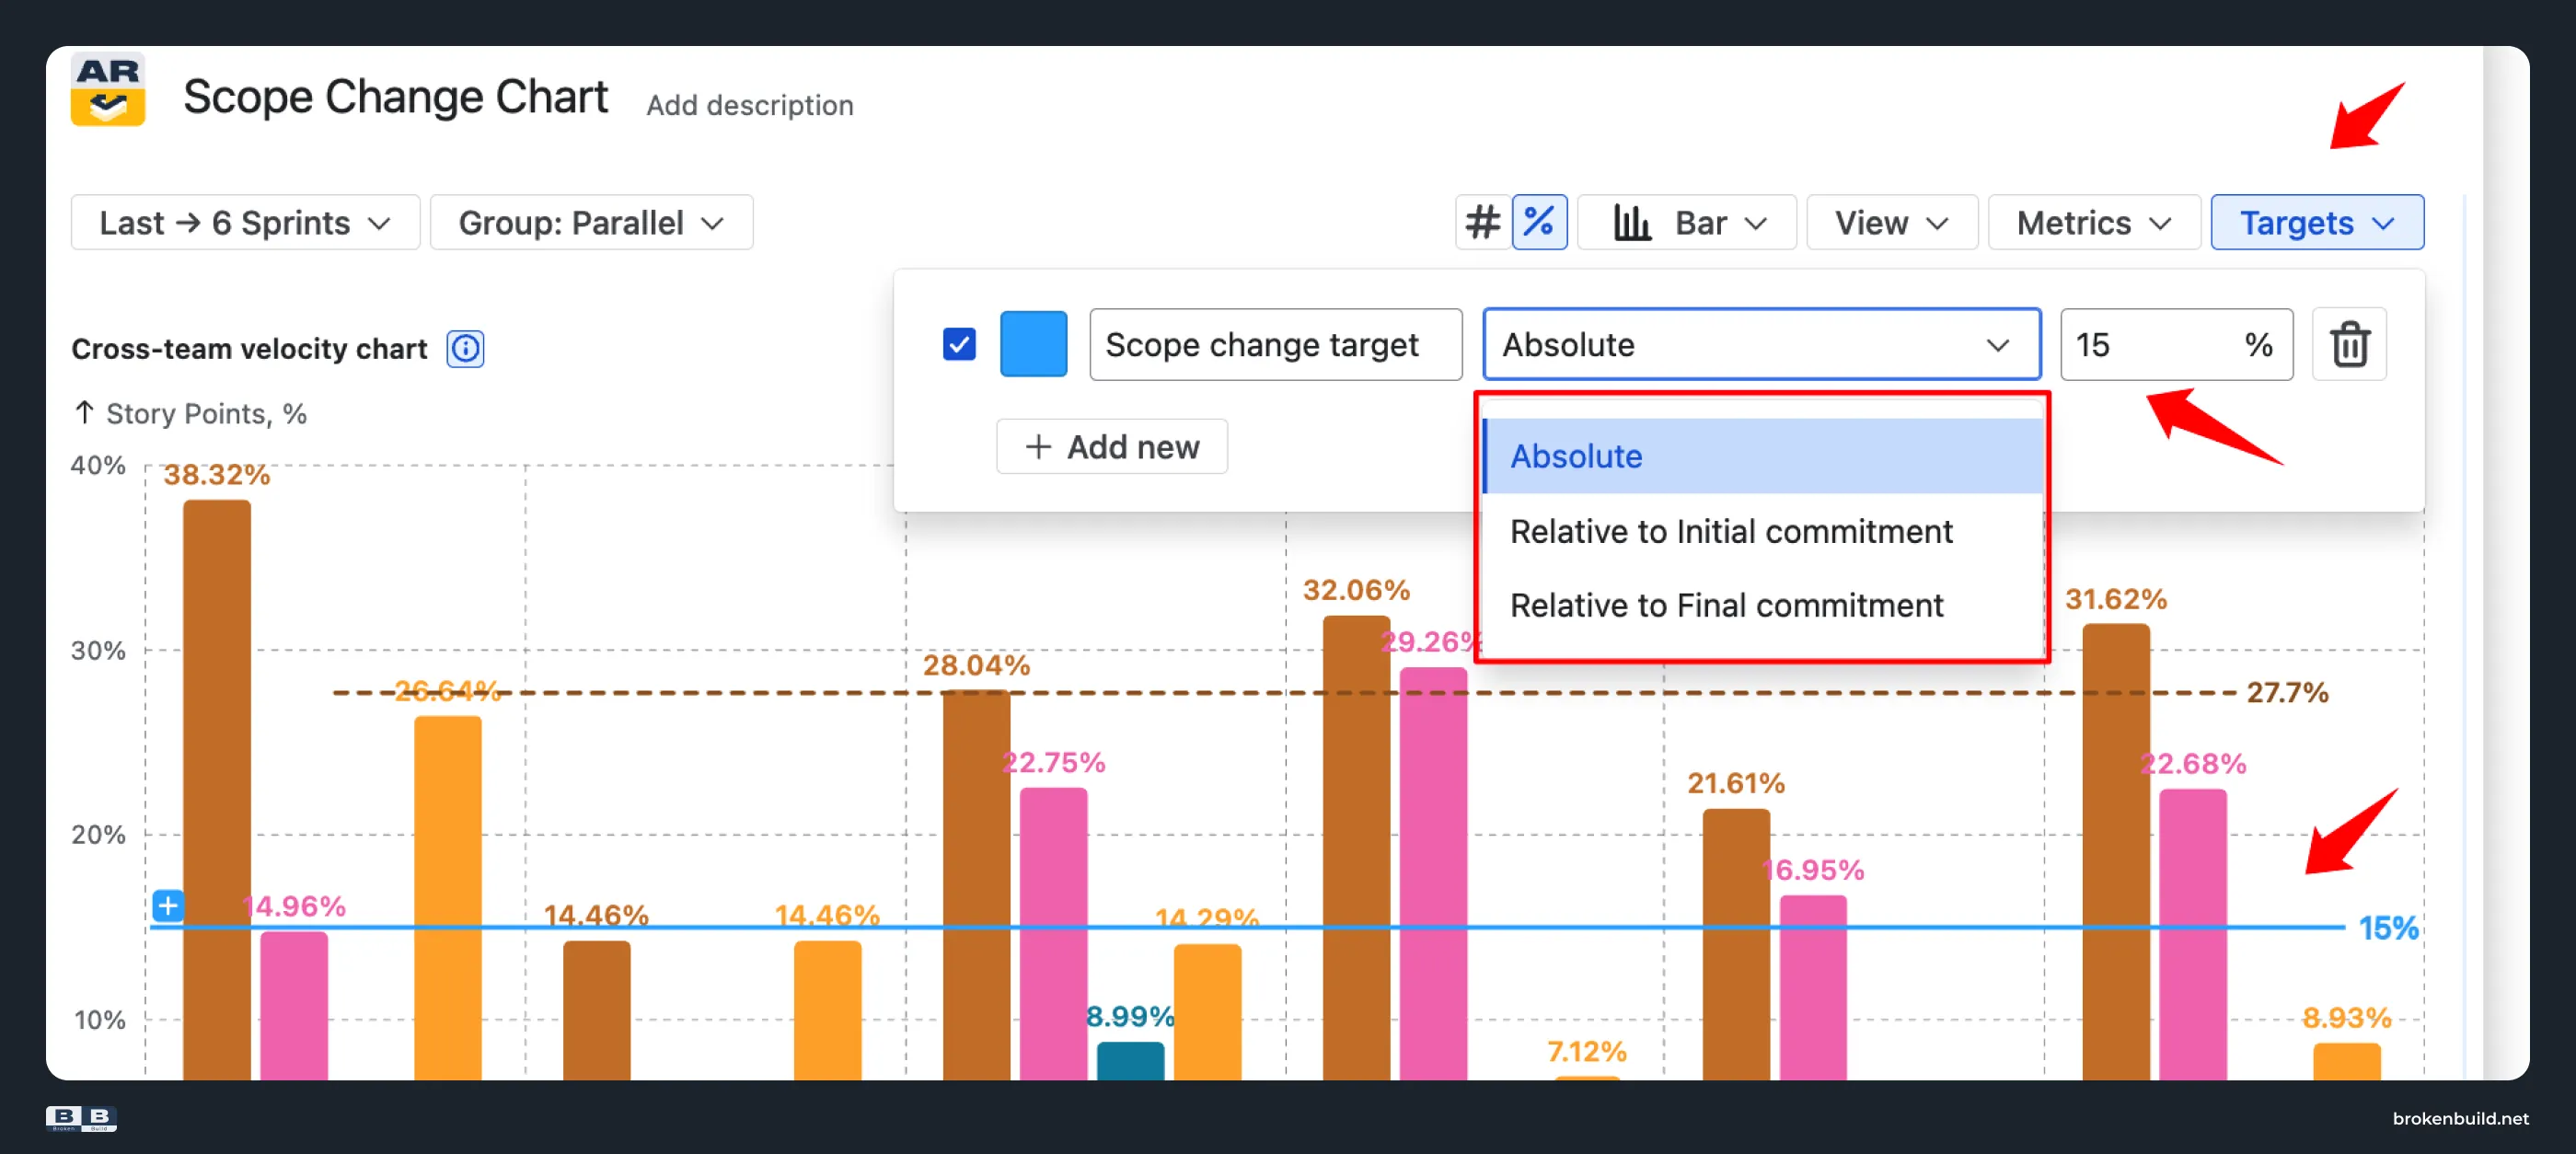
Native Jira: No target overlays. No way to set "scope change should stay under 15% per sprint" and see whether the team is meeting it.
Agile Velocity Charts by Broken Build: Overlay target lines directly on the chart. Targets can be absolute (e.g. "scope change should stay under 10 story points") or relative to a percentage of Initial commitment or Final commitment (e.g. "scope change should stay under 15% of initial commitment"). In percentage mode, pick the denominator that matches your KPI – Initial commitment measures planning-time scope discipline; Final commitment measures execution-time discipline after mid-sprint changes.
5️⃣ One team at a time → cross-team benchmarking
Native Jira: Shows one team at a time. No way to compare scope change patterns across teams.
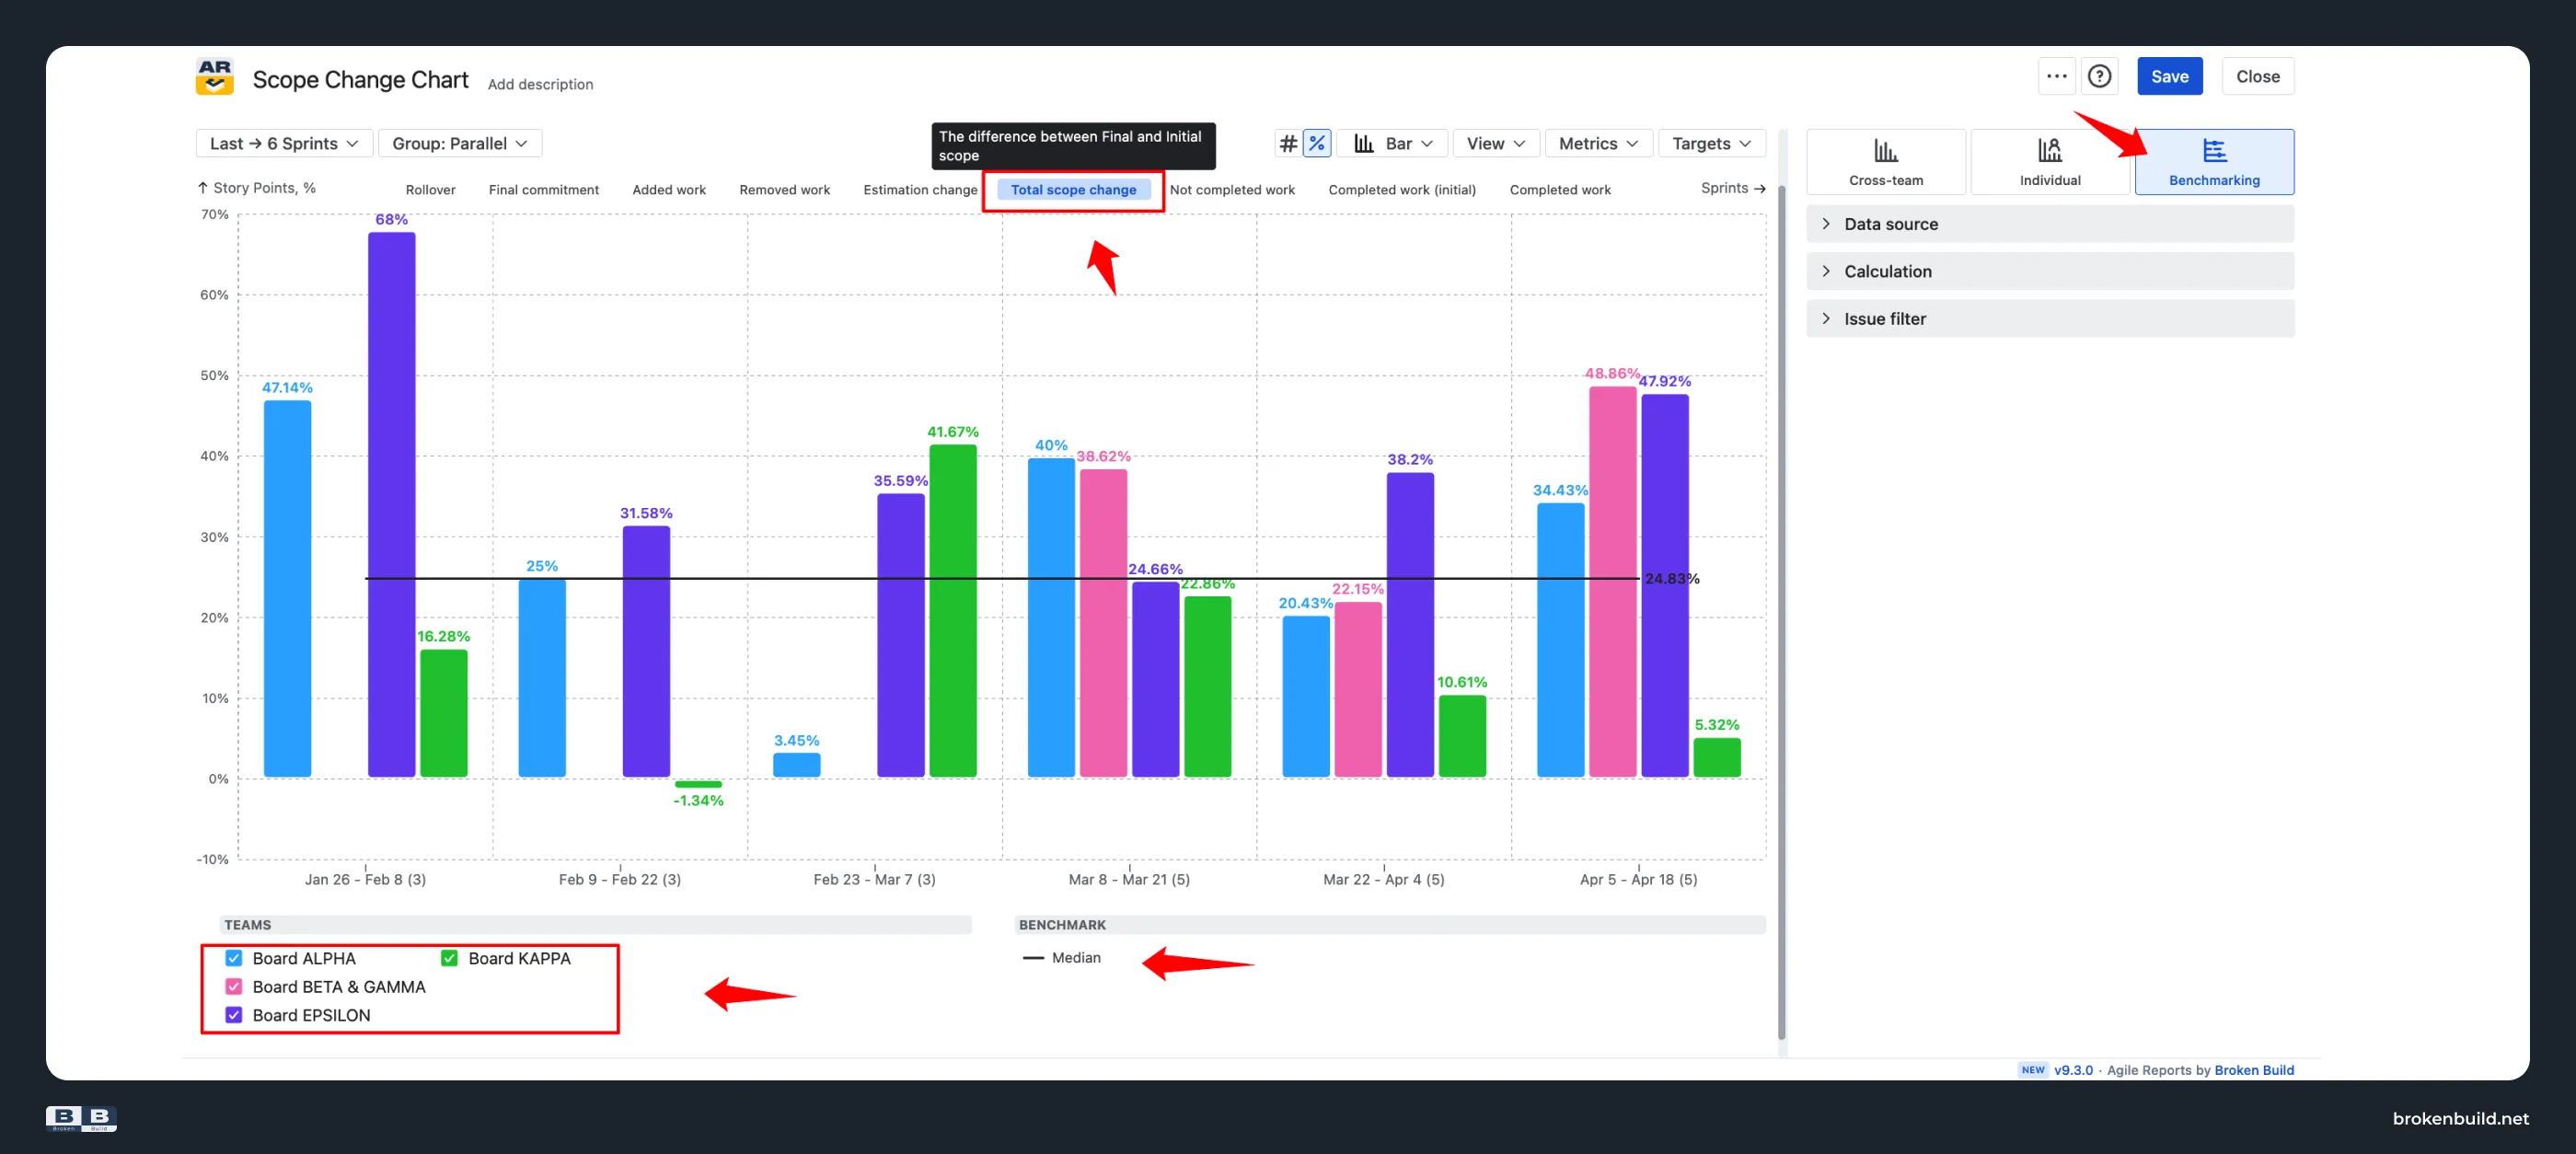
Agile Velocity Charts by Broken Build: Benchmarking view shows multiple teams' scope-change patterns on the same chart – useful for spotting which teams protect their sprints and which absorb the most churn.
6️⃣ Static forecasts → scope-growth modeling
Native Jira: Forecasts assume today's scope holds. Release Burndown predicts "N more sprints to finish" based on current remaining work. If scope keeps growing, the forecast is wrong.
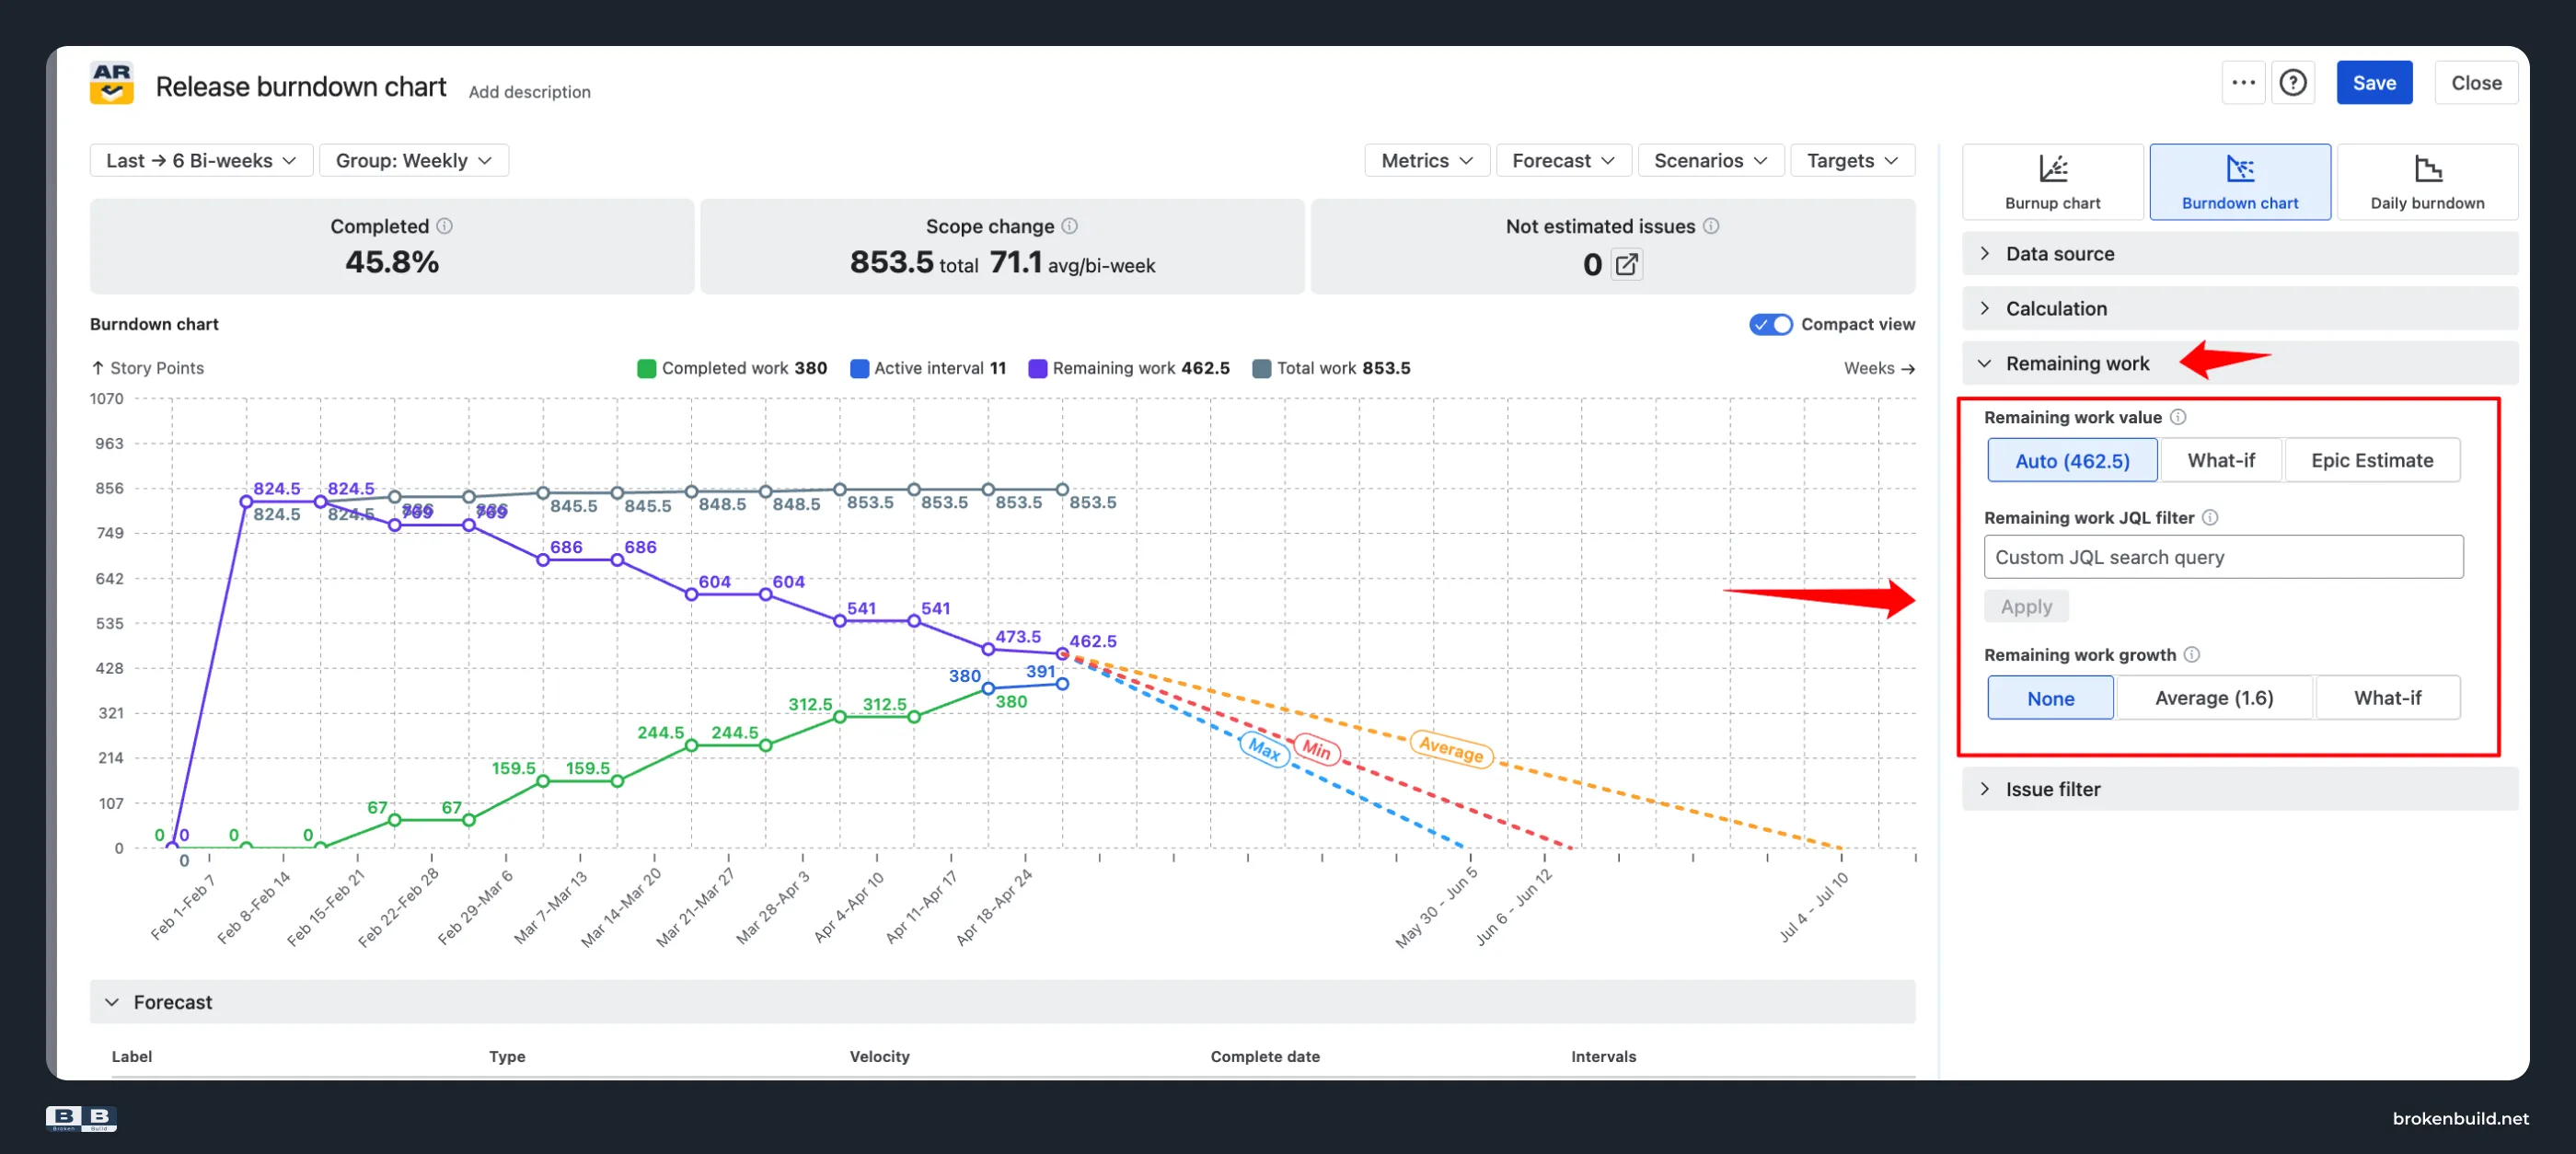
Agile Burnup Burndown Charts by Broken Build: Model expected scope growth into future forecasts. The projection reflects "if scope keeps growing at its current rate, we finish on X" rather than assuming static scope.
7️⃣ One Scrum board → multi-team, multi-release, any scope
Native Jira: Locked to one Scrum board or one release. No cross-board, cross-project, or cross-release view. If you have five teams delivering to the same release, native cannot show aggregate scope change across all five.
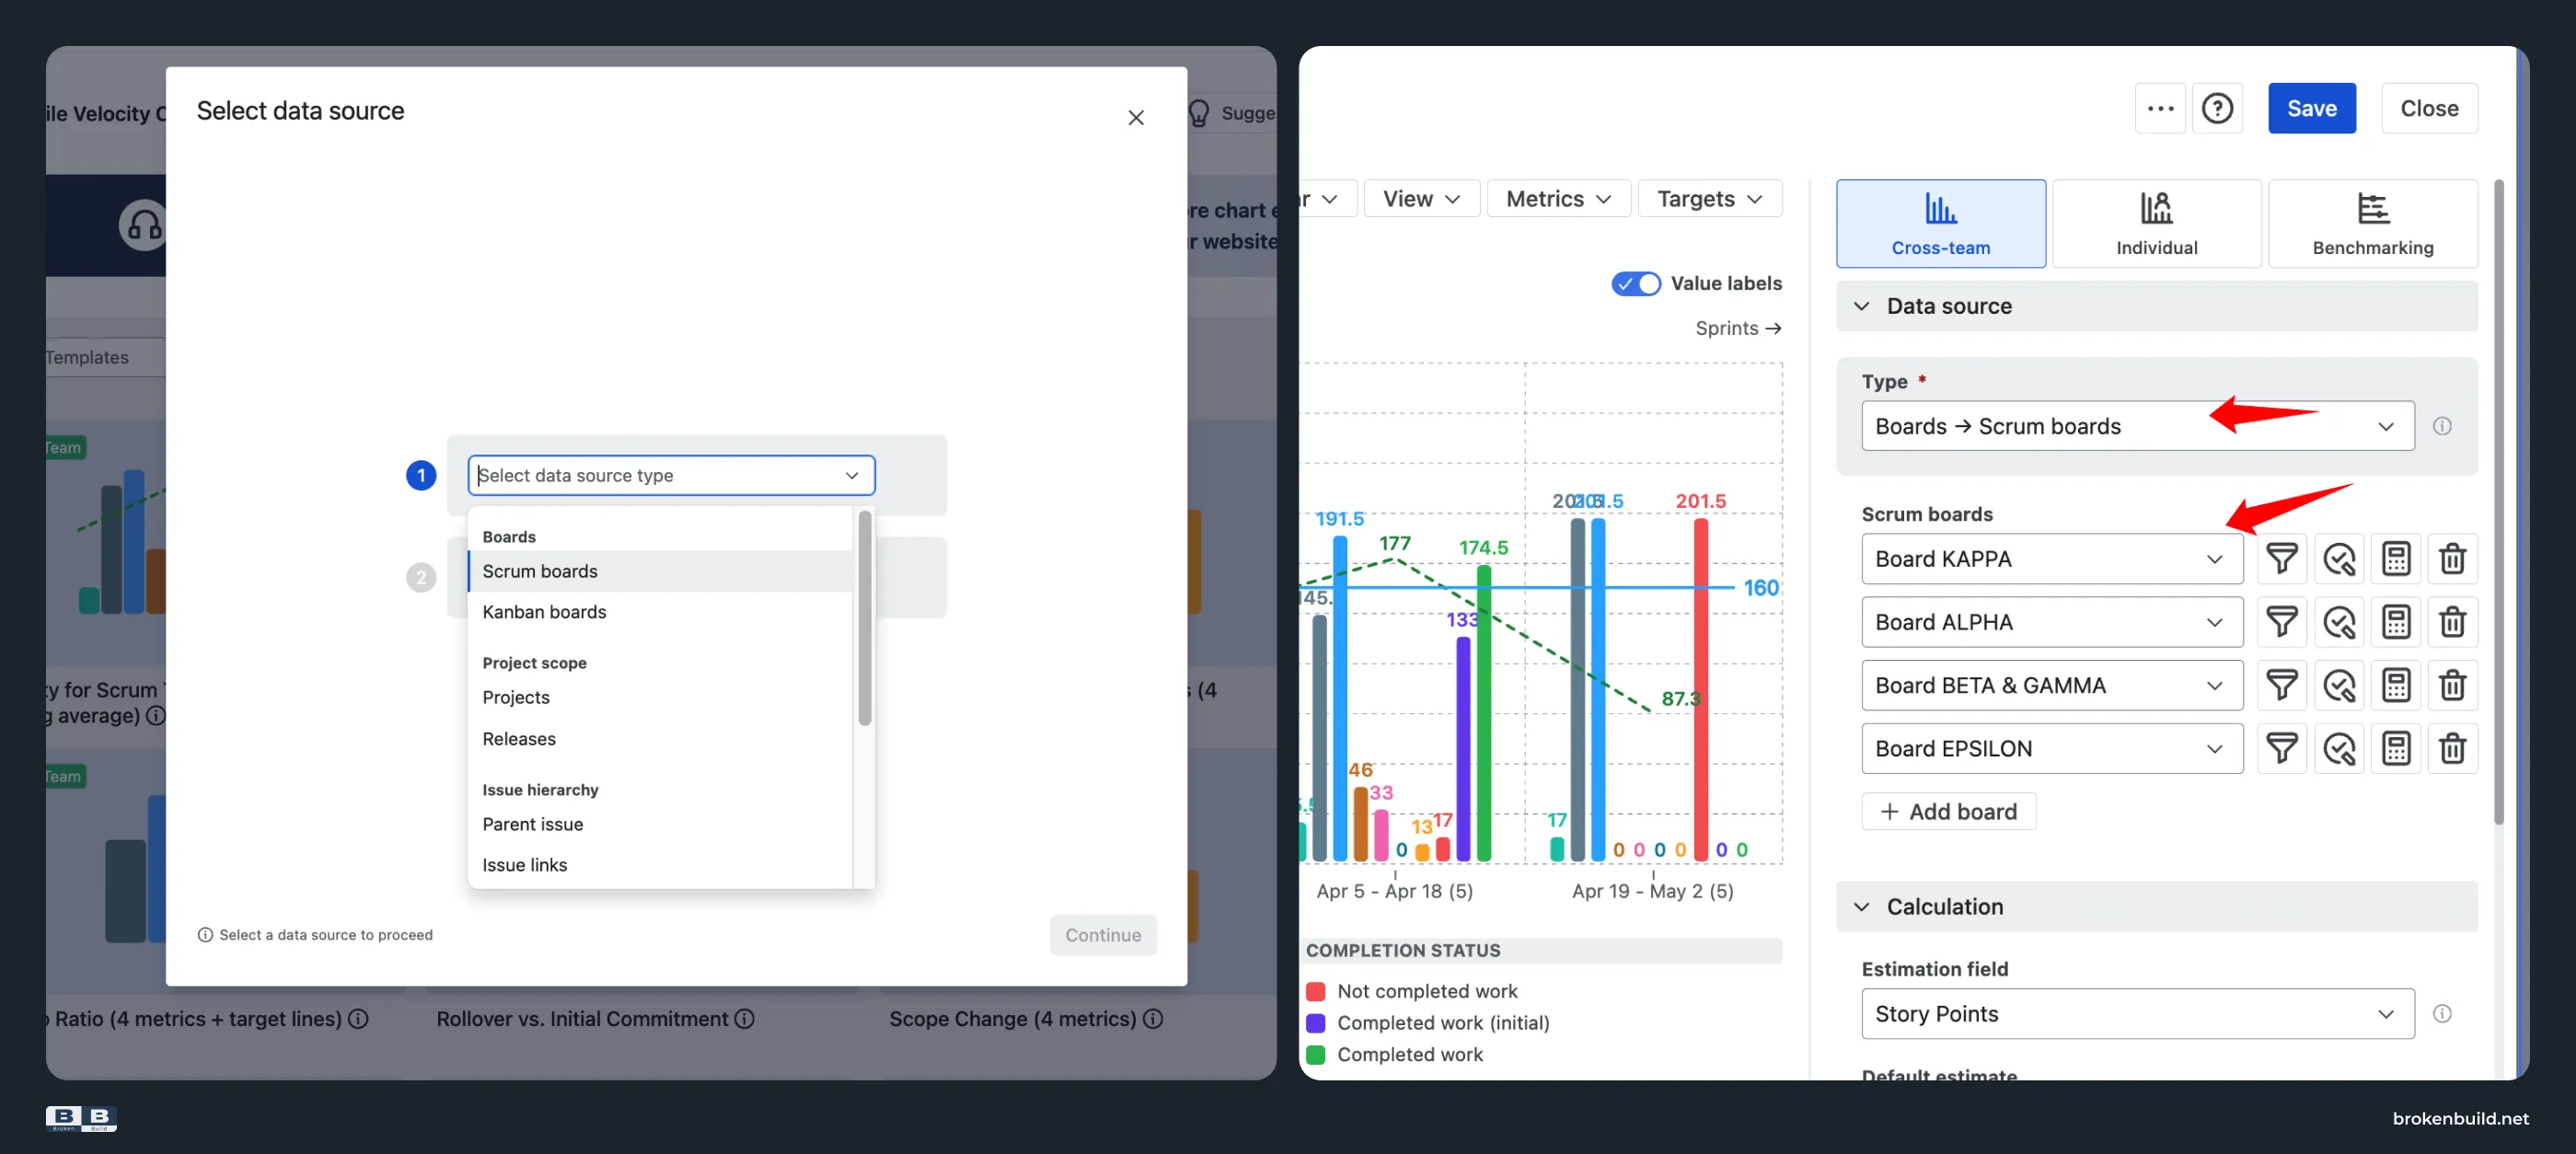
Agile Reports and Gadgets by Broken Build: Combine any mix of data sources in one chart: multiple Scrum boards, Kanban boards, projects, releases, initiatives, epics, saved filters, custom JQL. Track scope change for a single team, compare four teams side-by-side, or roll up an entire program. Scenario examples:
- Cross-team release – add all four team boards delivering to Release 2.0; see aggregate scope change per sprint across the whole release
- Epic-level drill – track scope change for one large epic spanning multiple sprints
- Portfolio view – combine multiple initiatives via JQL to see program-level scope trends
8️⃣ Fixed sprint window → configurable time frame
Native Jira: Fixed number of past sprints. No date-range mode, no group-by-time-interval.
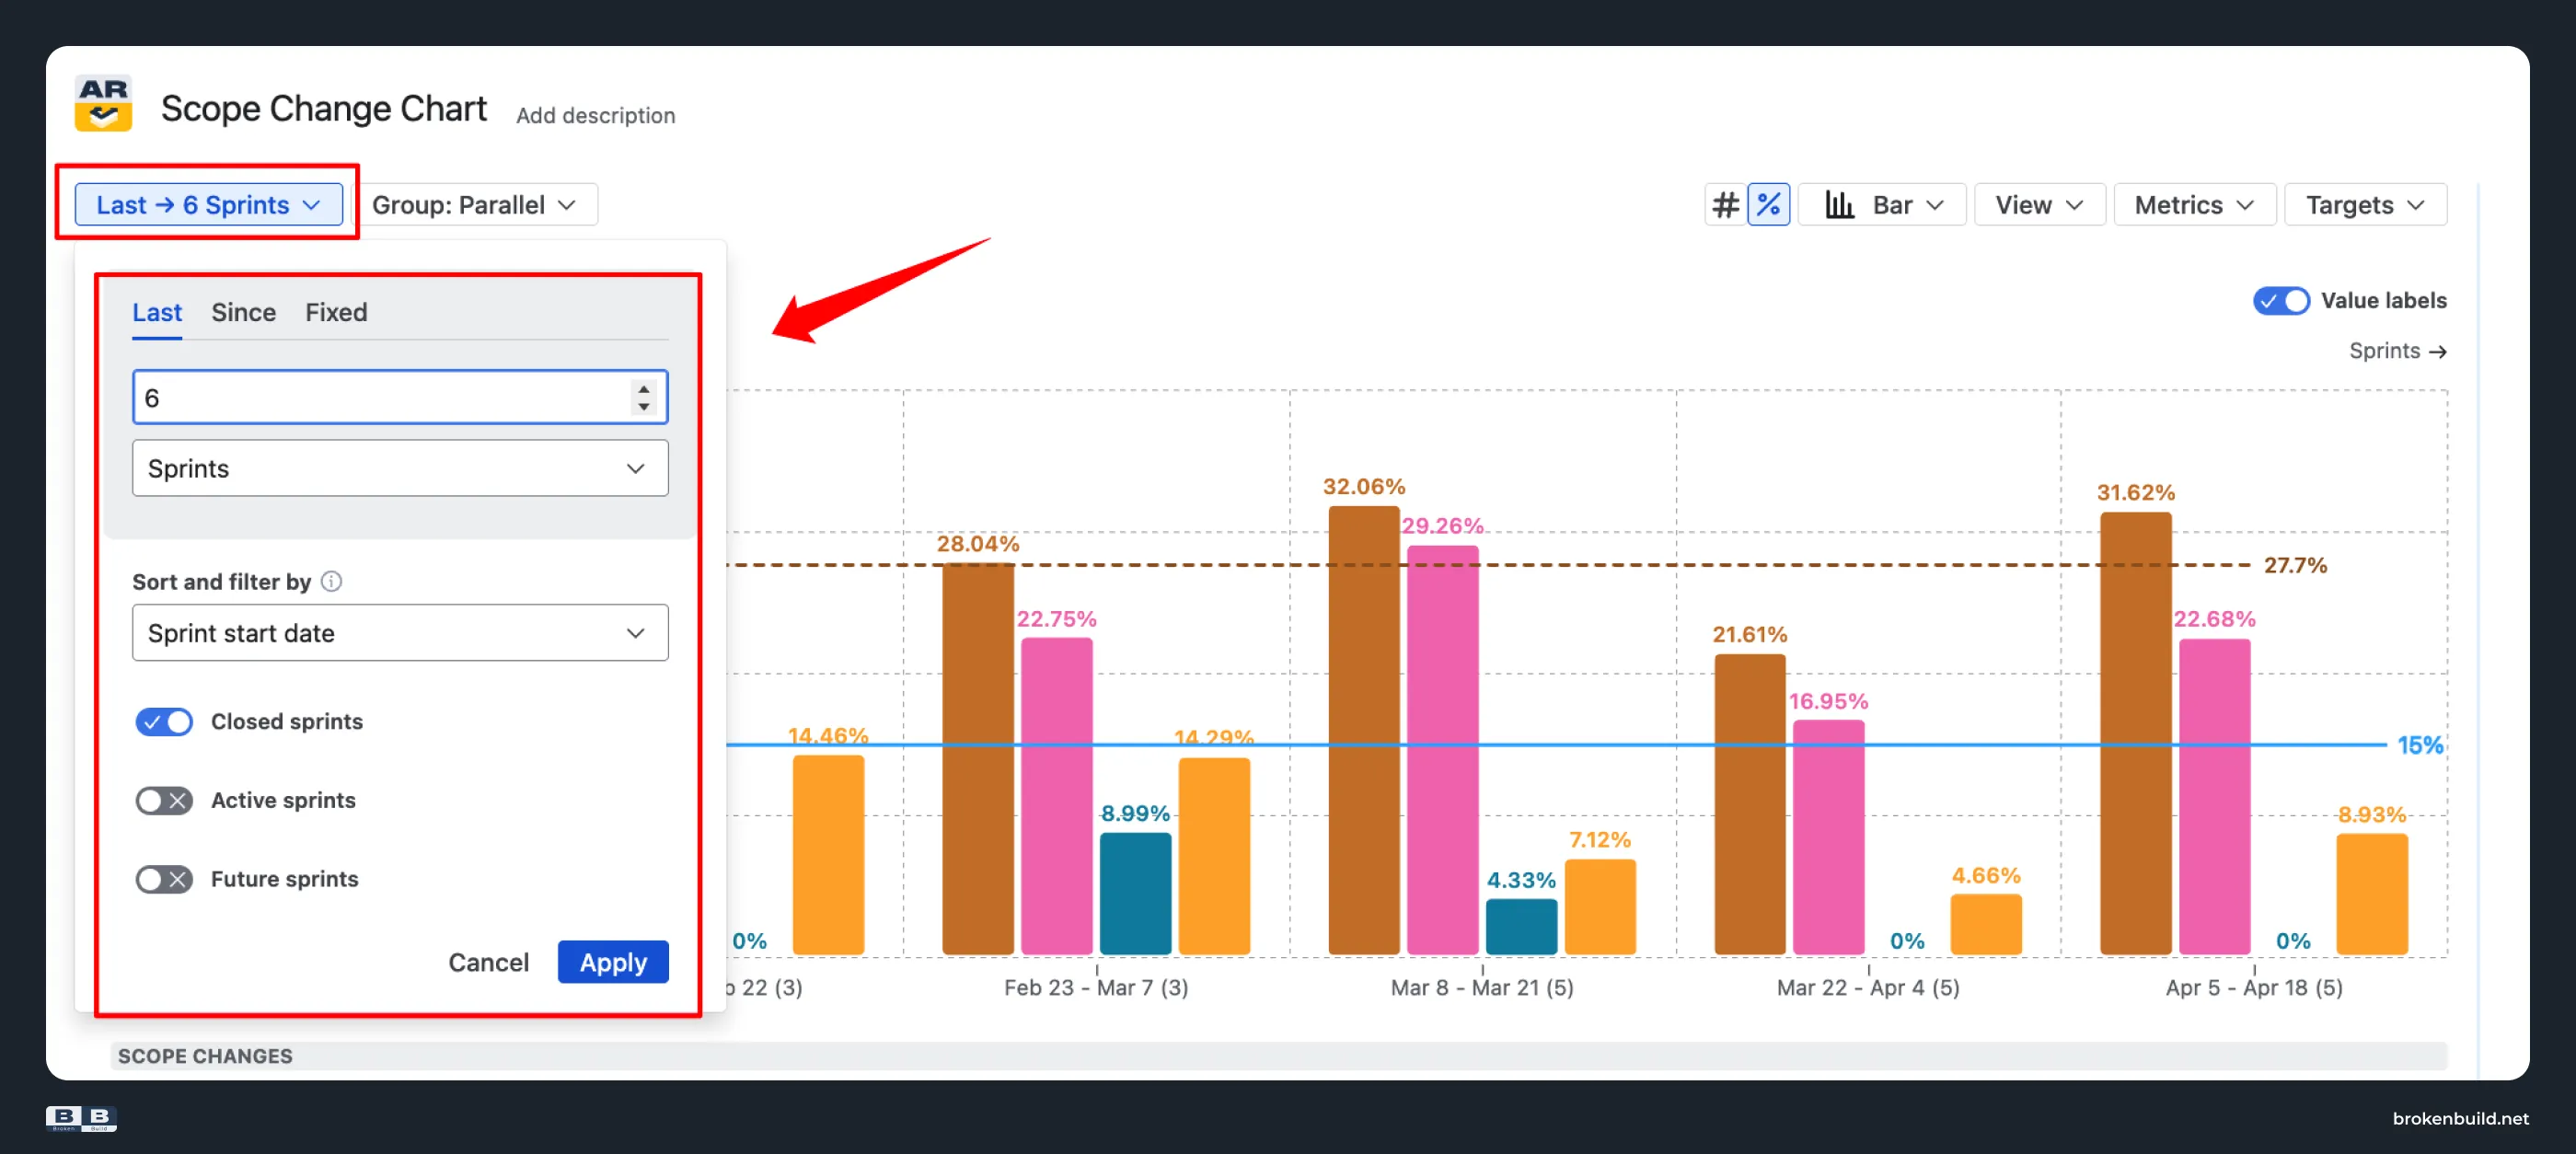
Agile Reports and Gadgets by Broken Build: Choose from three interval modes: Last (sprints, days, weeks, months, quarters), Since (a past date), Fixed (start–end range). A retrospective spanning "the last quarter" or "since the reorg" becomes a real query.
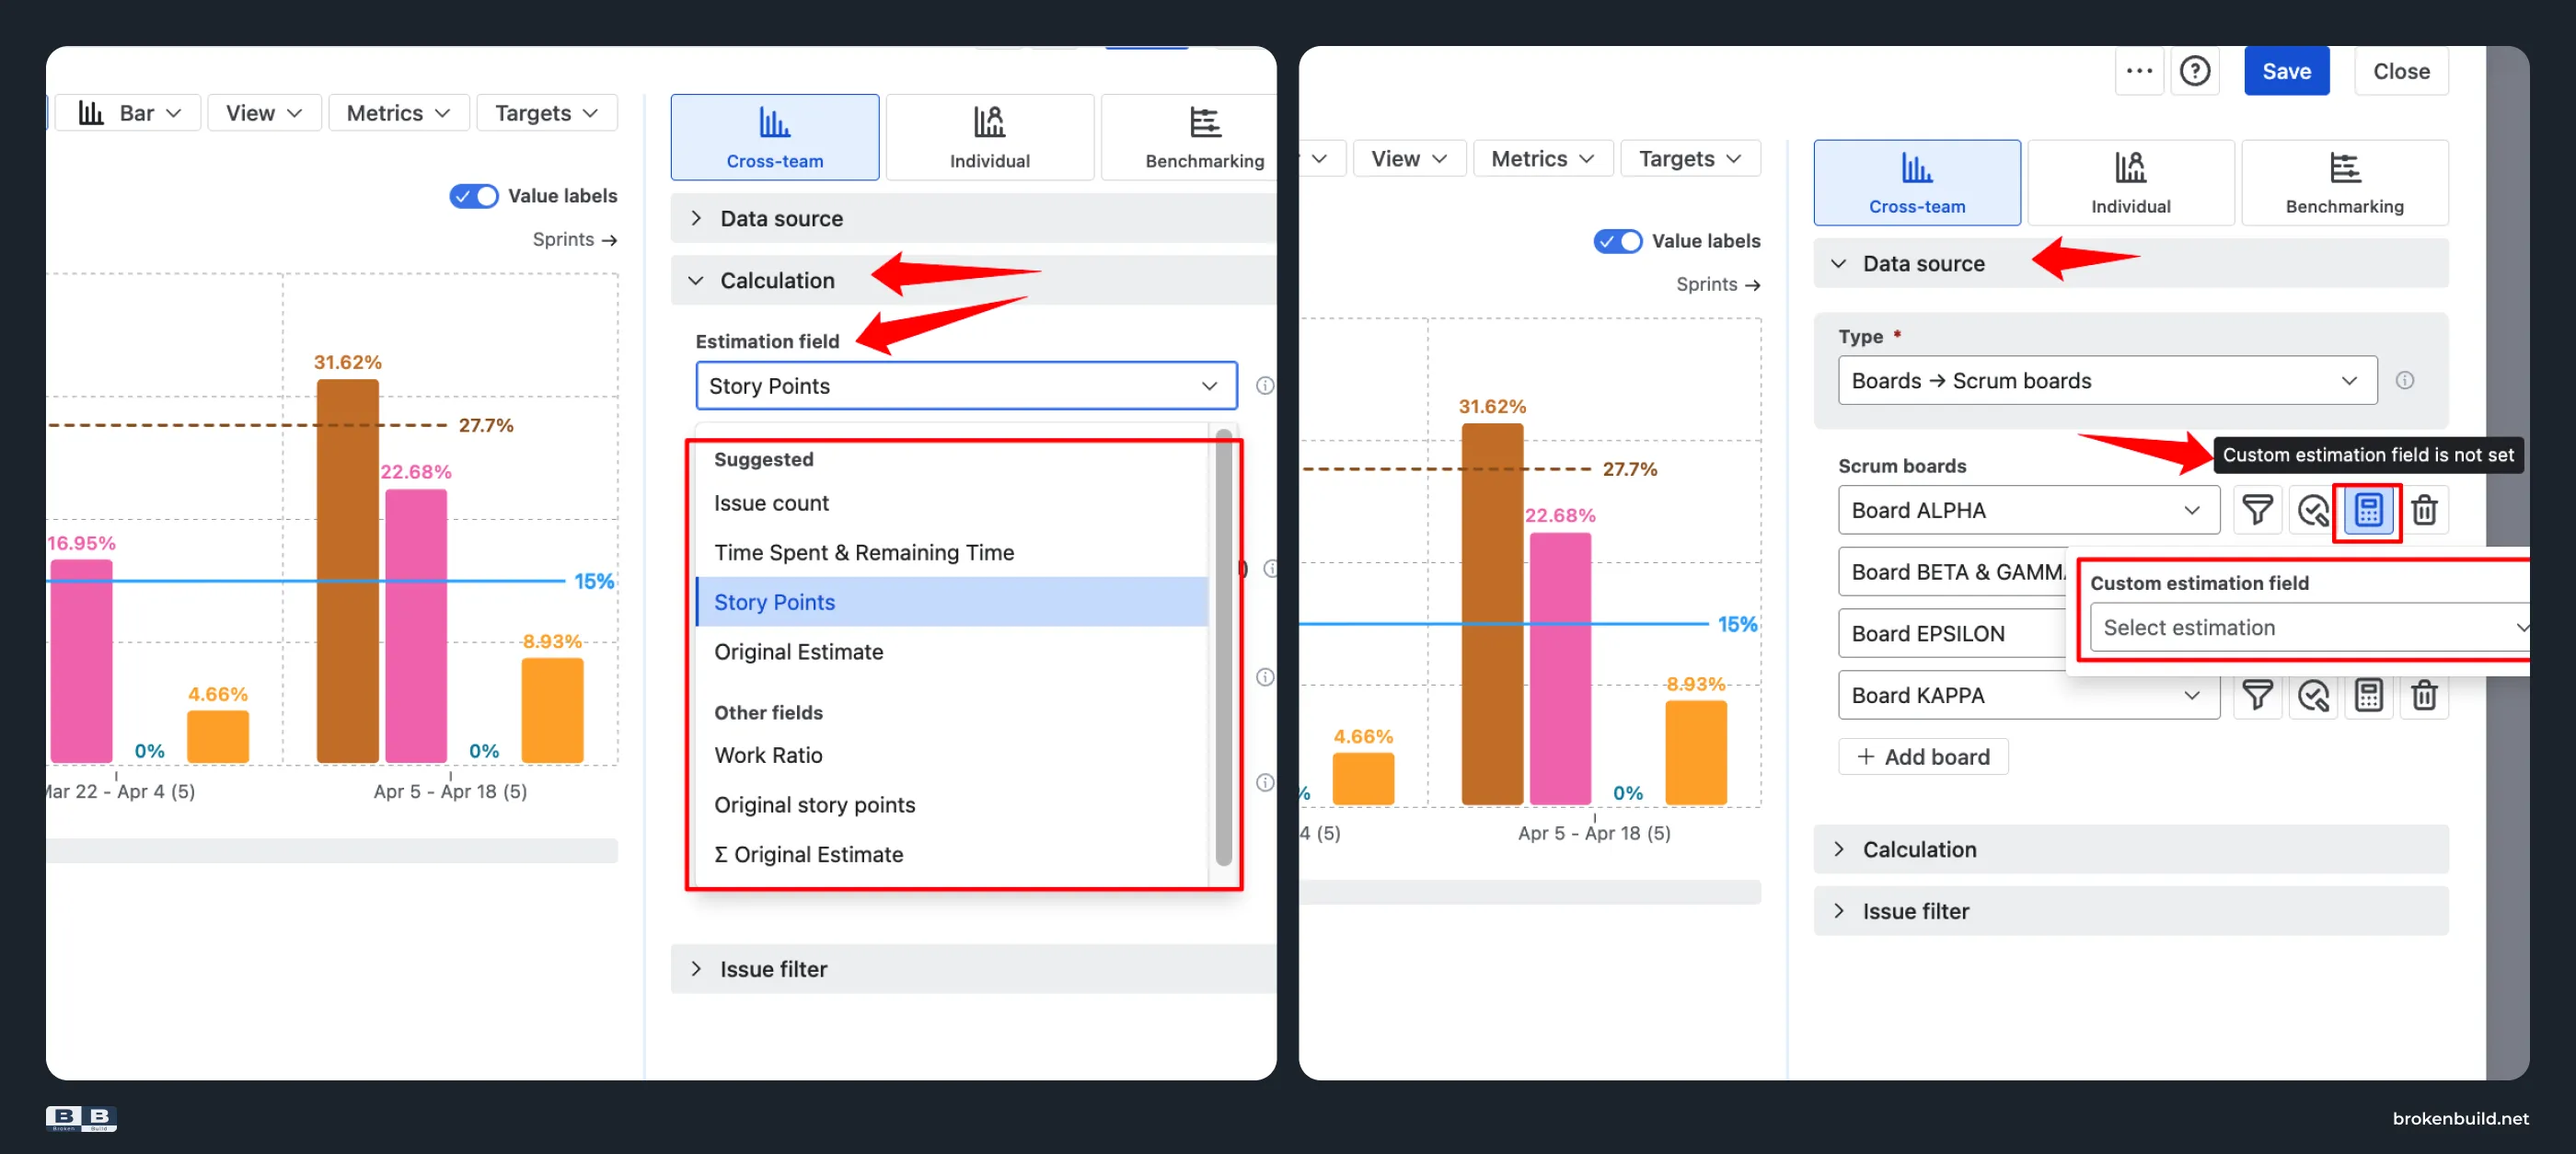
9️⃣ Board-locked estimation → flexible estimation
Native Jira: Estimation field is set on the board – story points, time, work item count, or a custom field. Cannot switch without changing board configuration.
Agile Reports and Gadgets by Broken Build: Set the estimation field at chart level – story points, time, work item count, or any custom numeric field. Teams that use different estimation fields can appear on the same chart, each measured on their own scale.
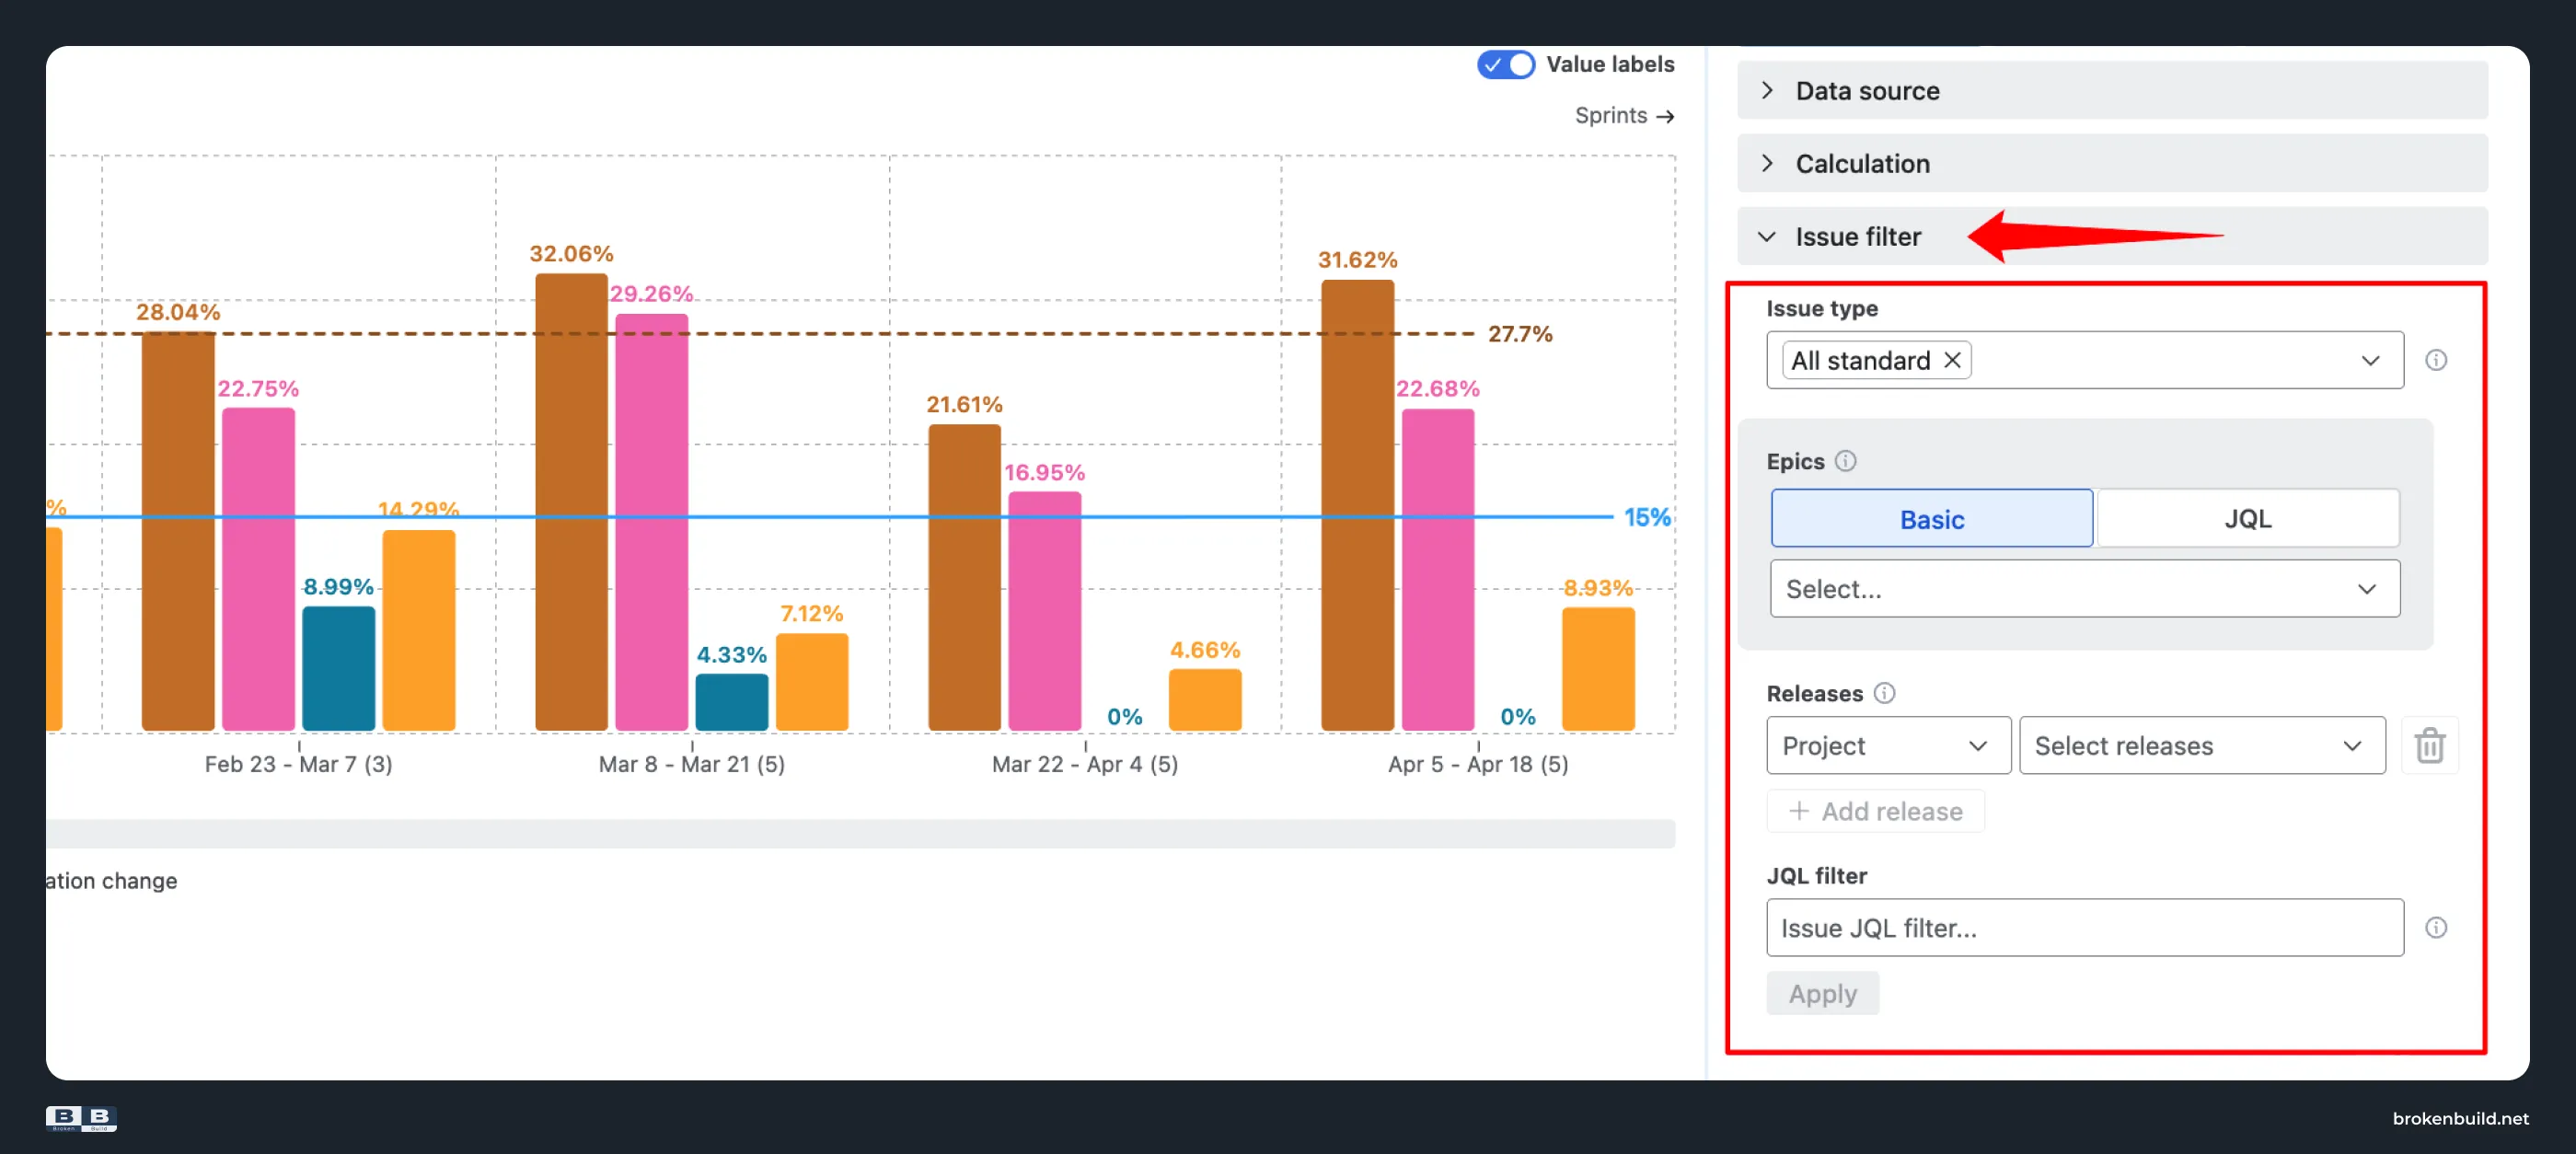
🔟 No filter → flexible issue filter
Native Jira: The filter is whatever the board's saved filter says. Cannot narrow to just stories, one epic, one release, or one team's contribution within a shared board.
Agile Reports and Gadgets by Broken Build: Filter by work item types, specific epics, releases, or custom JQL – so scope change can be tracked per work stream (e.g. bug influx vs. feature scope change), not just per board.
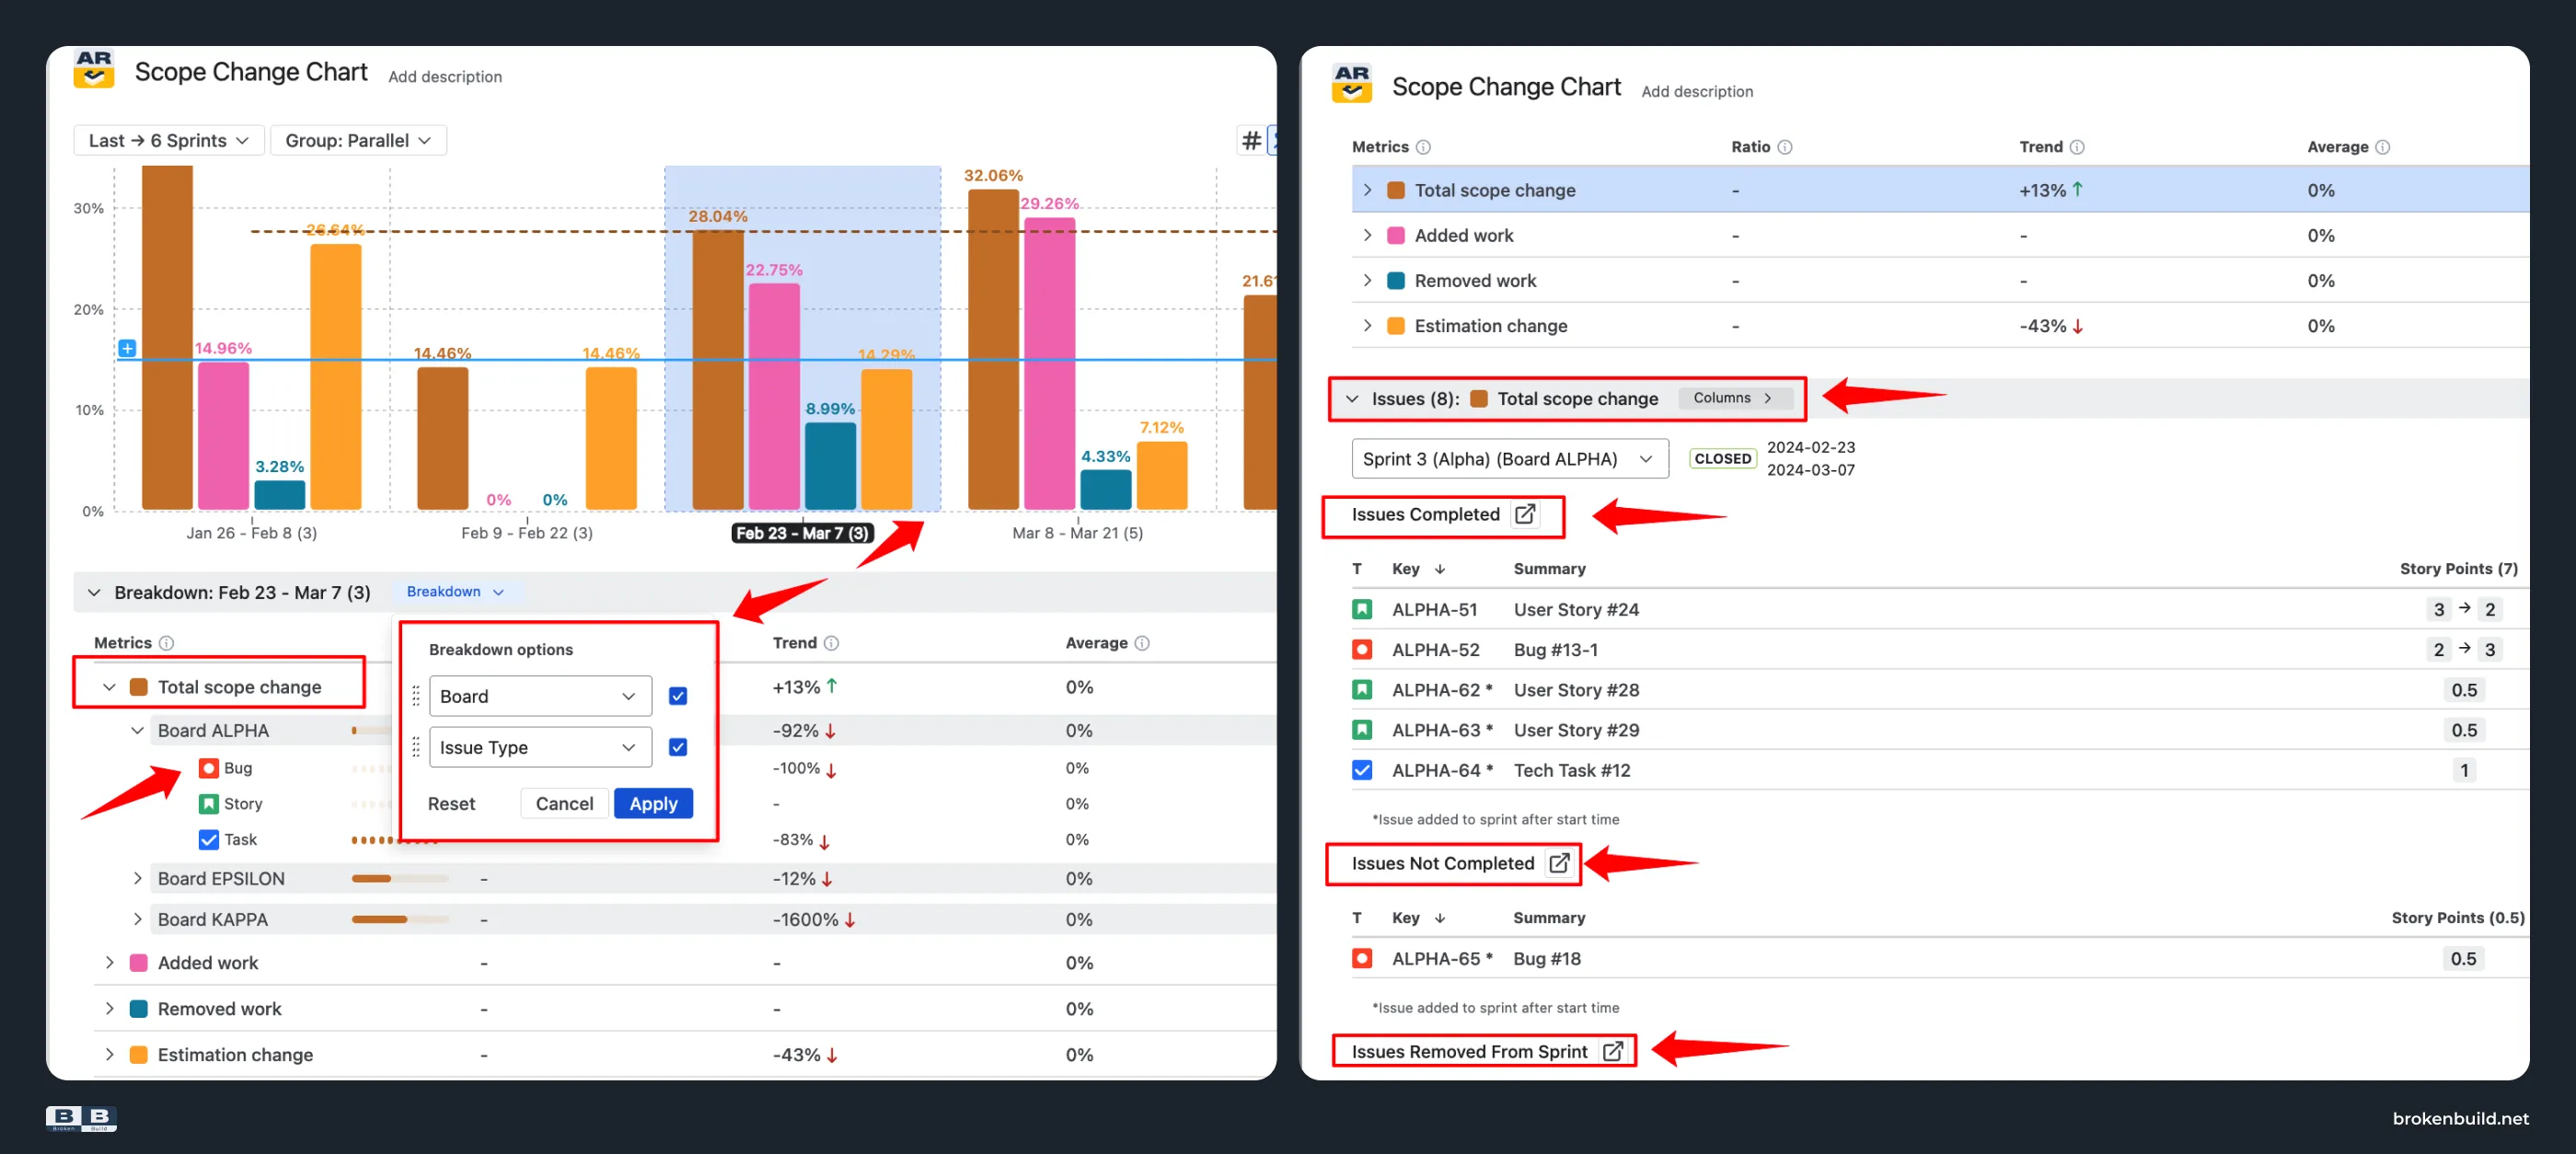
1️⃣1️⃣ No drill-down → breakdown and work item list
Native Jira: Cannot click a dark blue segment or asterisk to see which work items were added.
Agile Reports and Gadgets by Broken Build: Click any sprint or interval to open a Breakdown by any Jira field and an integrated work item list linked back to Jira. See exactly which work items were added mid-sprint, which were removed, and which were re-estimated.
1️⃣2️⃣ Trapped on Reports tab → dashboards, Confluence, export
Native Jira: Reports live only on the Reports tab. No Jira dashboard gadget, no Confluence embed with editable filters.
Agile Reports and Gadgets by Broken Build: Embed interactively in Jira dashboards and Confluence pages via Smart Links – filters and grouping stay editable inside Confluence.
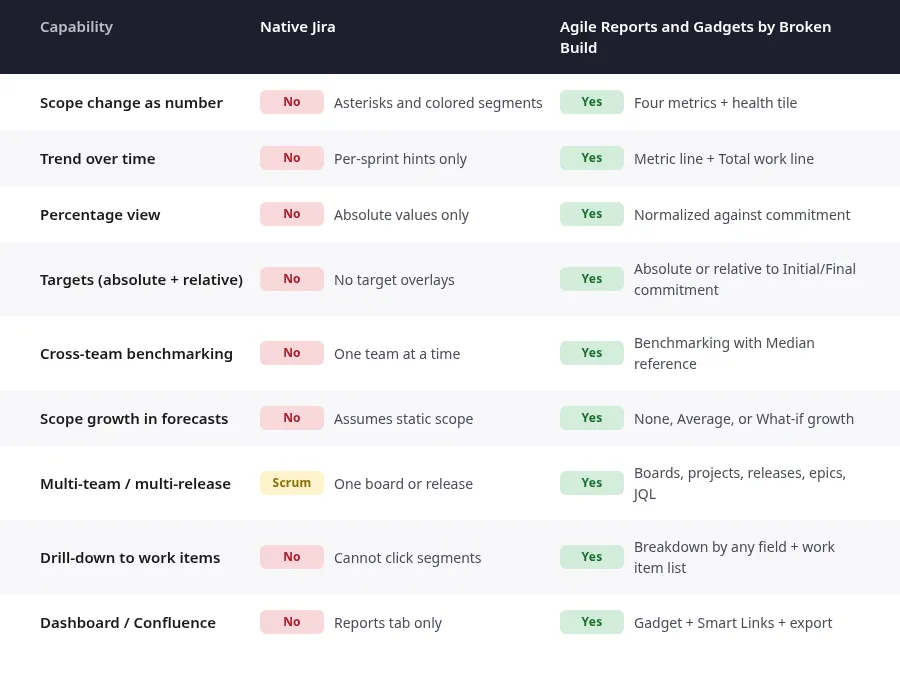
Scope change capabilities at a glance
Do you need more than native?
Answer "yes" to any of these? Native cannot help:
- Do you need to quote a scope change number to stakeholders?
- Do you want to trend scope change across sprints?
- Do you need to compare scope change across teams?
- Do your forecasts need to account for expected scope growth?
- Do you need to drill down to the specific work items?



Try the interactive examples
See scope change tracking in action – no installation needed.
- Scope change report – Total scope change, Added work, Removed work, Estimation change per sprint with drill-down
- Release burndown – scope change tracked in release burndown view
- Cross-team velocity benchmark – compare scope change patterns across teams
When you can skip the upgrade
Native works when:
- Single Scrum team, single sprint
- Simple retrospective, no reporting requirements
- You only need to know that scope changed, not how much
Native stops when:
- Leadership asks "how much did scope grow?"
- You need to trend scope change across sprints or releases
- You need to target or benchmark scope change
- You manage multiple teams and want to compare patterns
- Your forecasts need to account for scope growth
Agile Reports and Gadgets picks up where native stops – and the same data sources power all charts, so nothing breaks.




.png)