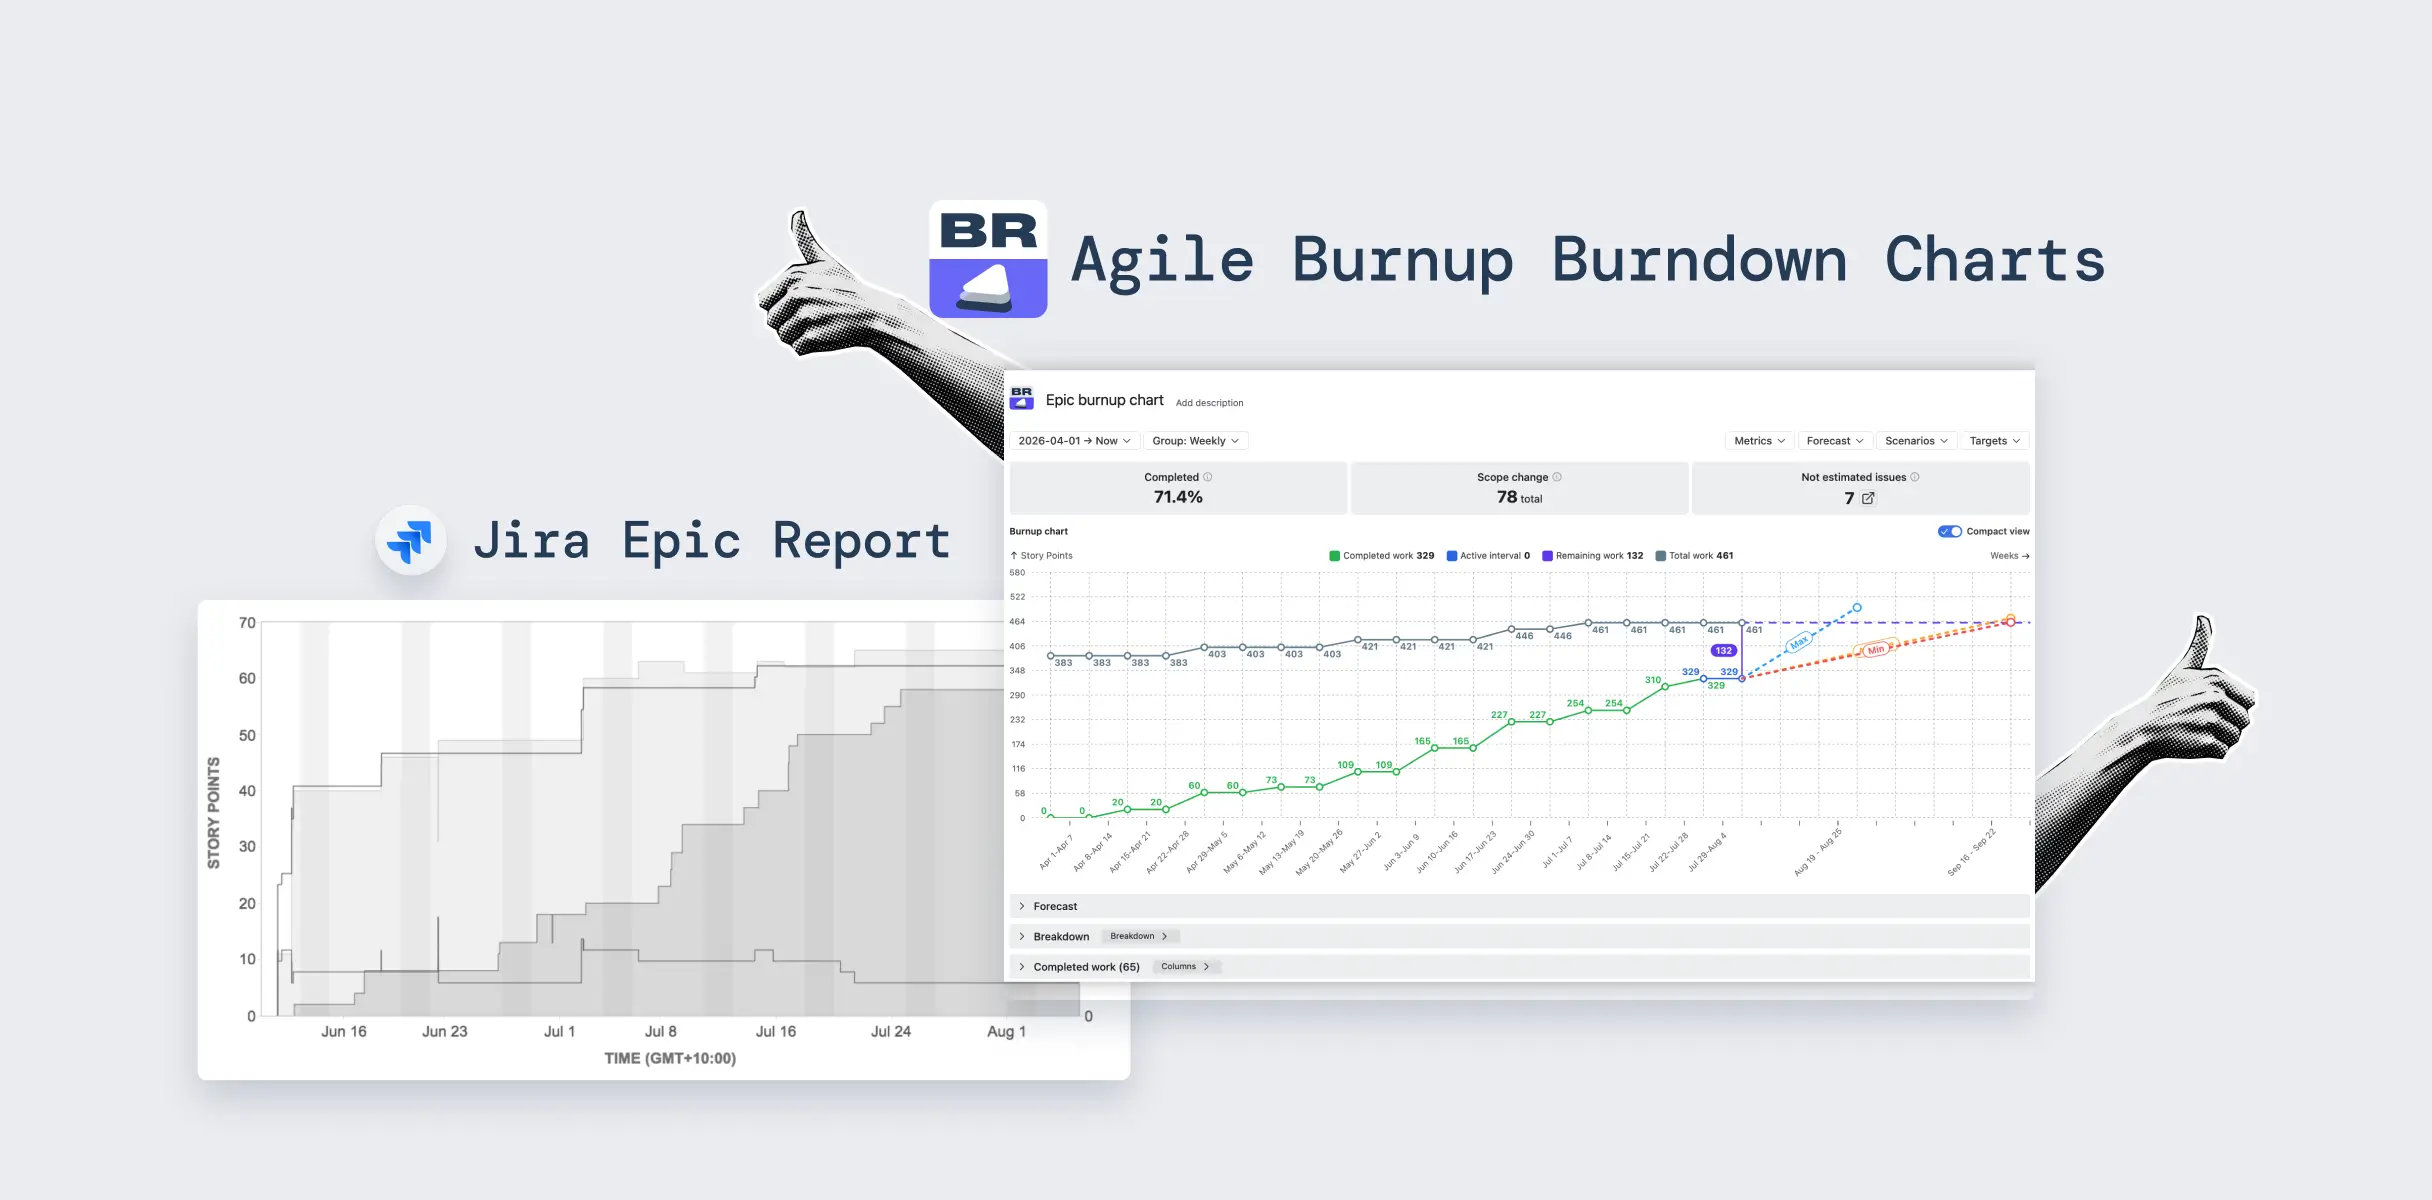
If you're shopping for a Jira reporting or dashboard app, the Marketplace is crowded and the tools don't line up on a single axis. Some are strong at custom charting but need a dedicated admin; others cover a narrow slice like time-in-status but can't give you a full sprint-to-portfolio picture. We built Agile Reports and Gadgets to close that gap - advanced agile and flow metrics out of the box, no JQL or training required, and portfolio-level data support without extra setup. The table below shows how it compares, feature-by-feature and on price, against the 10 reporting apps teams most often evaluate alongside it.
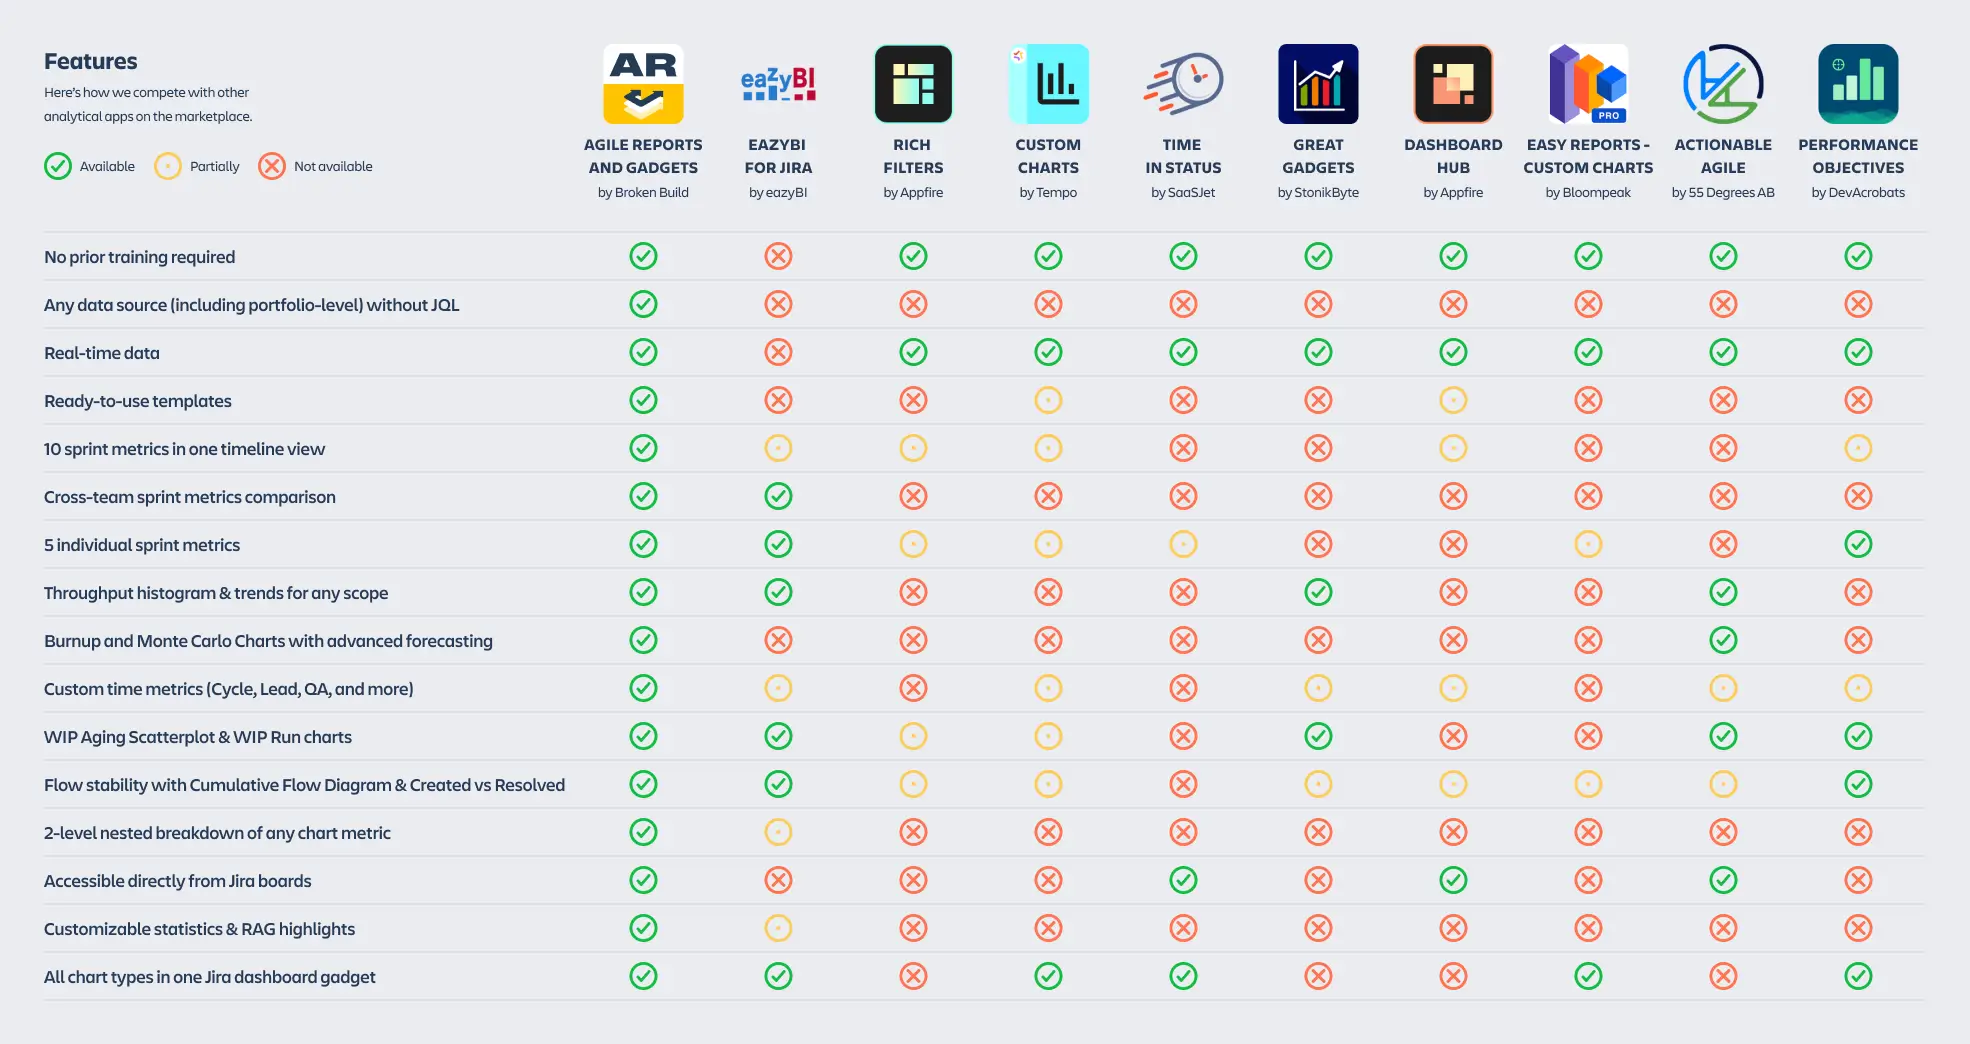
Feature comparison
Pricing at realistic team sizes (snapshot 30.04.2026)
Monthly list price on Atlassian Cloud, sorted by 250 & 1,000-user tier:
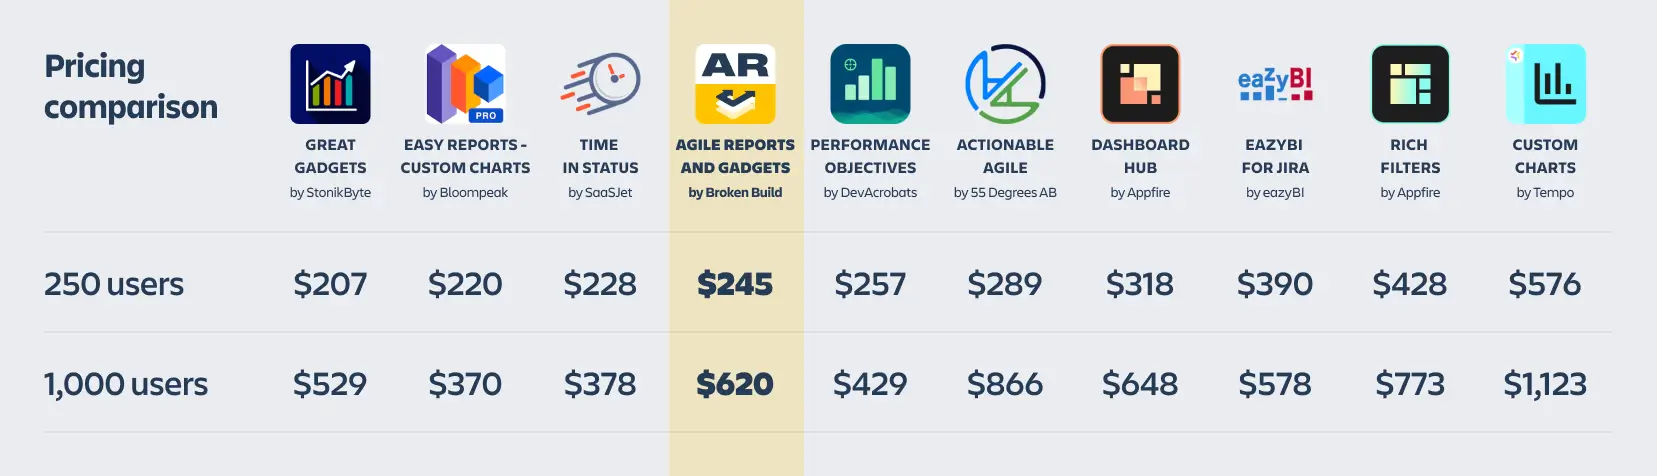
Pricing lands mid-pack. Narrow-scope apps like Bloompeak, Time in Status, and Great Gadgets come in cheaper, but they cover a much smaller slice of the feature matrix above. Broad chart and filter tools like Tempo Custom Charts, Rich Filters, and ActionableAgile cost significantly more - especially at scale.
Hidden costs worth knowing
A few things that rarely show up in a feature row but change your real total cost of ownership:
- eazyBI is extraordinarily flexible, but anything beyond the shipped templates needs MDX scripting, and data syncs once every 24 hours. Budget for admin time and a stale-data lag.
- Custom Charts and Rich Filters are chart-building toolkits, not agile analytics suites. You pick a chart type and configure it yourself. There's no shipped Cycle Time, Throughput distribution, or Monte Carlo - you build each one.
- Time in Status does its namesake well, but it won't give you sprint metrics, forecasting, cross-team analytics, or flow metrics.
- ActionableAgile covers Kanban flow and Monte Carlo, but it doesn't ship sprint-level velocity, commitment analytics, ready-to-use templates, or customizable RAG indicators - and pricing climbs steeper than ARG above 1,000 users.
- Dashboard Hub is a strong dashboarding shell with data import, but it isn't opinionated about agile metrics. You still have to build the metrics yourself.
- Performance Objectives has solid building blocks (cross-team, Monte Carlo, flow) but doesn't ship the 10-metric timeline, custom time metrics, or nested breakdowns.
Which app fits your team?
- You want agile + flow metrics without a setup project. Agile Reports and Gadgets. Templates, no JQL, portfolio-level data, and sprint + flow + forecasting in one place.
- You need fully custom BI reports and have admin capacity for MDX. eazyBI.
- You only need time-in-status reporting. Time in Status by SaaSJet, or Bloompeak Reports if you want cheaper charting too.
- You want dashboard-wide JQL filters with arbitrary custom charts. Rich Filters.
- You want a focused Kanban/flow UX with Monte Carlo forecasting. ActionableAgile.
- You want to bring non-Jira data sources into Jira dashboards. Dashboard Hub Pro.
- You want the cheapest option for a small team. Great Gadgets or Bloompeak, accepting a narrower feature set.
Why teams pick Agile Reports and Gadgets
- Zero-setup analytics. Ten sprint metrics, cross-team comparison, custom time metrics (Cycle, Lead, QA, and more), WIP aging, Cumulative Flow Diagram, throughput, Monte Carlo - shipped as ready-to-use templates. No JQL, no training.
- Portfolio-level without the pain. Pull from any data source - Scrum, Kanban, Spaces, initiatives, custom hierarchies - without writing queries or pre-configuring data sets.
- Real, current data. Metrics update in real time. No 24-hour sync lag.
- Executive-ready. Customizable statistics, RAG highlights, and target lines make the same data usable on a team board and in a leadership review.
- Predictable pricing. Mid-pack at small-to-mid team sizes, and cheaper than the premium chart/filter tools at scale.


.png)