


Delivering value quickly isn’t just about working fast - it’s about understanding where time is truly spent. Cycle time and lead time are two key Agile metrics used to enhance processes and manage projects effectively. Though often confused, they highlight different parts of the delivery process.
This article explores the lead time vs. cycle time difference, why both matter, and how to build cycle time reports in Jira with ease.
Overview of Lead time and Cycle time in Agile workflows
Cycle time and Lead time in Agile methodology offer practical insight into how work flows through a process. Analyzing both sides helps pinpoint delays, refine processes, and improve the accuracy of your planning and forecasting.
What is Lead time?
Lead time refers to the total duration between the initiation and completion of a development process. It’s a key metric for assessing how quickly teams can move from planning to delivering a working product or feature. By lead time measurement across all stages (planning, implementation, testing, and release), teams can evaluate performance, identify bottlenecks, and improve delivery predictability.
Shorter lead time helps accelerate product iterations, boost efficiency, and deliver value to users faster. In contrast, longer lead times can delay releases, slow down feedback loops, and negatively impact product goals.
📌 Key points:
- Lead time tracks the full duration of a development process from idea to production.
- It typically includes requirements analysis, design, coding, testing, and deployment.
- Longer lead times often indicate blockers such as unclear requirements, resource constraints, or inefficient workflows.
- Teams can reduce lead time by improving collaboration, automating testing and deployment, and adopting practices like continuous integration and delivery (CI/CD).
💡Example of Lead time: A customer requests a new feature on July 1. It was developed and released on July 22. The lead time is 21 days, covering everything from request to delivery, including wait time and development. It helps teams measure how long customers wait for results and where delays occur.
What is Cycle time?
Cycle time is defined as a metric that tracks how long a task takes once active work begins. It starts when a team picks up the item and ends when the task is fully completed. Cycle time metric refers to the amount of time it takes to complete a task once work has started. It focuses specifically on the active phase of the process, from the moment a task moves into progress until it’s finished. It's a key agile metric that is critical for understanding team efficiency, identifying workflow slowdowns, and improving delivery speed.
📌 Key Points:
- Cycle time measures how long it takes to complete work once it begins.
- It starts when a task enters a “work in progress” state and ends when it’s completed.
- Helps teams track execution speed and find bottlenecks in the active process.
- Shorter cycle times often indicate smoother, more efficient workflows.
- Useful for improving forecasting, setting internal SLAs, and refining team velocity.
💡Example of Cycle time: On the Scrum board, for example, delivery cycle time usually begins when a task moves into the "In Progress" on July 10 and is marked “Done” on July 15. The cycle time is 5 days, capturing only the time spent actively working on the task.
For expert guidance on implementing these metrics and optimizing your Agile workflows, consider consulting with Softgile’s Kanban trainers consultants and trainers.
Key differences between Lead time and Cycle time
Understanding the differences between cycle time vs. lead time is critical for improving both internal workflows and overall customer satisfaction.
Both metrics help you understand how efficiently you're providing value to your customers, but they focus on different aspects. Here's a summary of their key cycle time vs lead time differences:
Scope
Development Cycle time focuses exclusively on the period when work is actively being done, from the moment a task begins until it is finished. In contrast, lead time covers the full duration of the process, starting from when a request is made until the product or service is delivered to the customer.
Purpose
The main purpose of cycle time tracking is to underline where work may be delayed or idle during the execution phase, helping teams identify and remove bottlenecks. Lead time, however, is used to manage customer expectations by providing insight into the total delivery time and improving the predictability of overall service.
Calculation
- Cycle Time = Task completion date minus task start date
- Lead Time = Delivery date minus order/request date
Many Agile teams track metrics but struggle to apply them effectively. Softgile’s Agile consultants combine technical Jira know-how with proven Agile practices to help you reduce lead time, accelerate cycle time, and achieve measurable results.
How to calculate Lead time and Cycle time in Jira
Even though Lead Time and Cycle Time are essential Agile metrics, Jira doesn’t provide dedicated charts for calculating them out of the box.
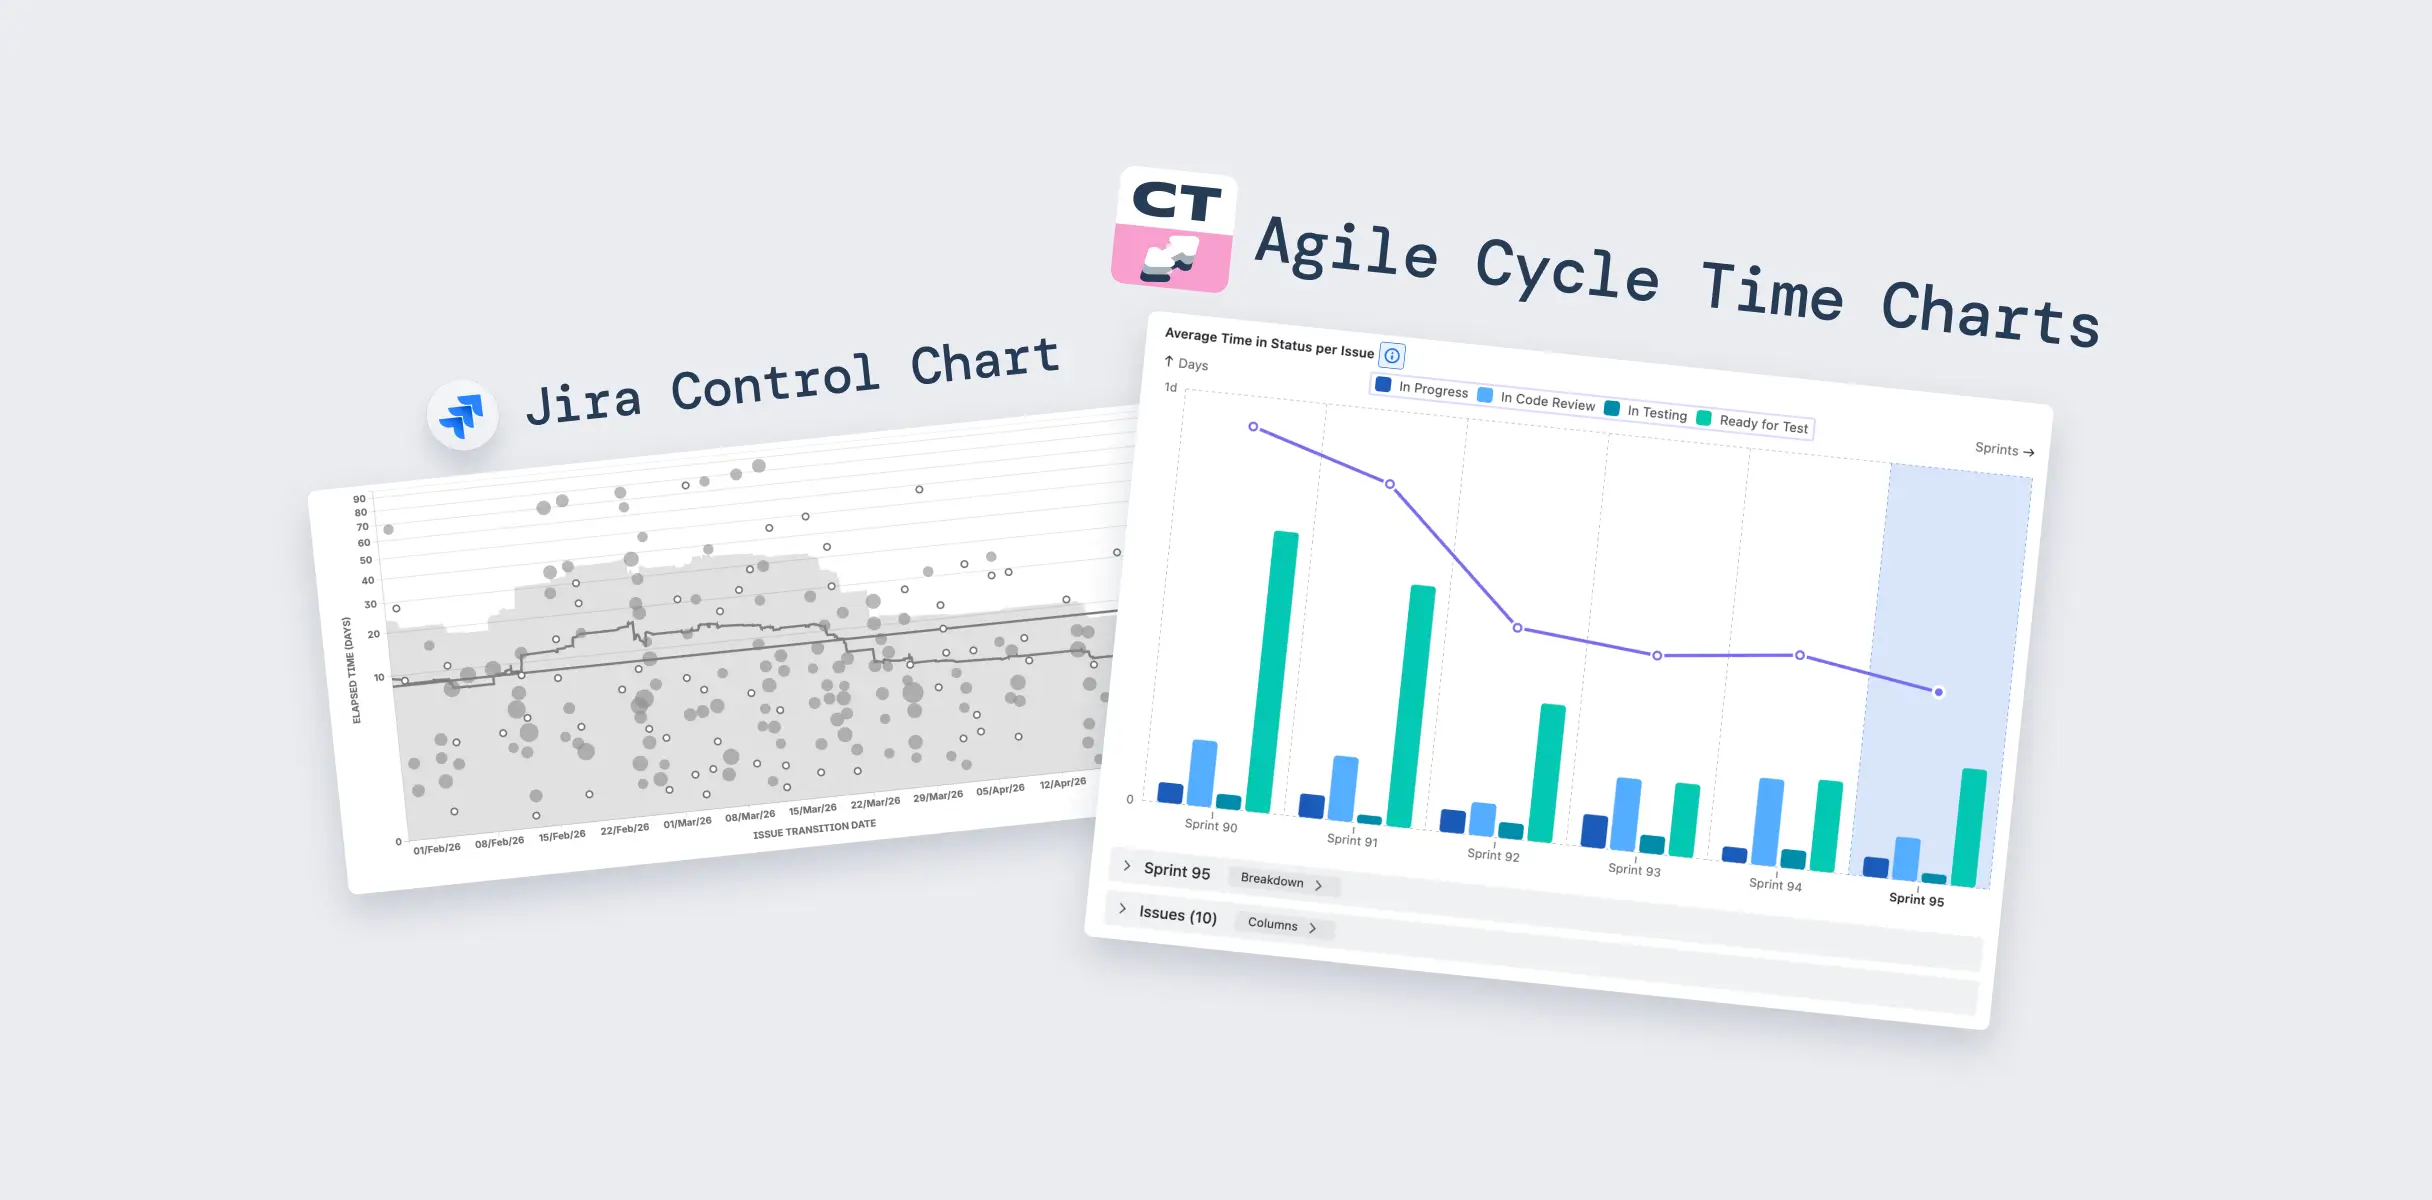
The only built-in option is the Control Chart, which tracks time in progress but doesn’t let you customize statuses or track full lead time.
As part of the Agile Cycle Time Chart, Broken Build’s Cycle time and Lead time charts go further, calculating delivery time directly from Jira issue histories:
- Lead Time is measured from the moment an issue is created until it reaches a completed status (e.g., “Done”).
- Cycle Time is calculated from the moment work starts (e.g., status changes to “In Progress”) until delivery.
Both metrics rely on live Jira data and flexible filters (issue type, project, board, epic, etc.), making them accurate and adaptable to any Agile workflow, whether Scrum or Kanban’s multiple boards.
Solutions for advanced Cycle time reports in Jira
From trends to root causes - Broken Build’s Agile Cycle Time Charts are built for Agile teams who need more than Jira’s default reporting can offer:
✅ Measure total delivery time - from issue creation to completion
✅ Understand how long work stays in each status to identify stage-level delays
✅ Spot hidden waiting time between workflow stages to detect bottlenecks
✅ Track delivery consistency using percentiles like 50th, 85th, 95th or custom
✅ Identify outliers and long-tail issues to improve planning accuracy
✅ Set realistic SLAs and delivery goals grounded in actual team data
✅ Compare performance across multiple teams using breakdown and flexible filters
✅ Drill down into individual work items for root cause analysis
✅ Visualize progress clearly for stakeholders with trendlines and grouped timelines
✅ Use the WYSIWYG editor to adjust chart details and watch updates happen in real time - no page reloads required
👉 Whether you work in Scrum or Kanban, these charts turn raw Jira data into clear, flow-based delivery insights.
Cycle time chart features
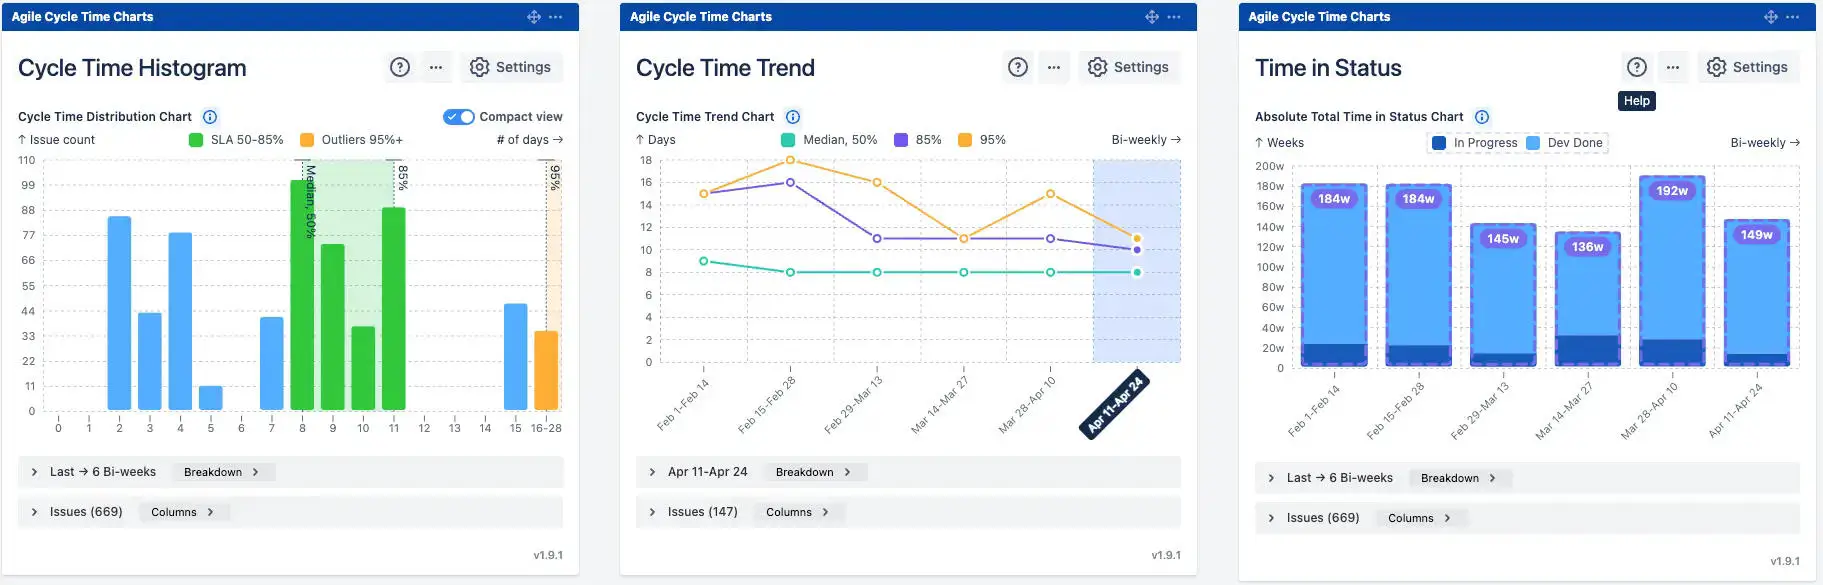
The Cycle Time Chart helps Agile teams visualize how long it takes for work items to move through the process, from “in progress” to “done.” It combines three powerful views - Cycle Time Histogram, Cycle Time Trend, and Time in Status - to highlight delays, outliers, and long-term trends, turning raw Jira data into actionable delivery insights:
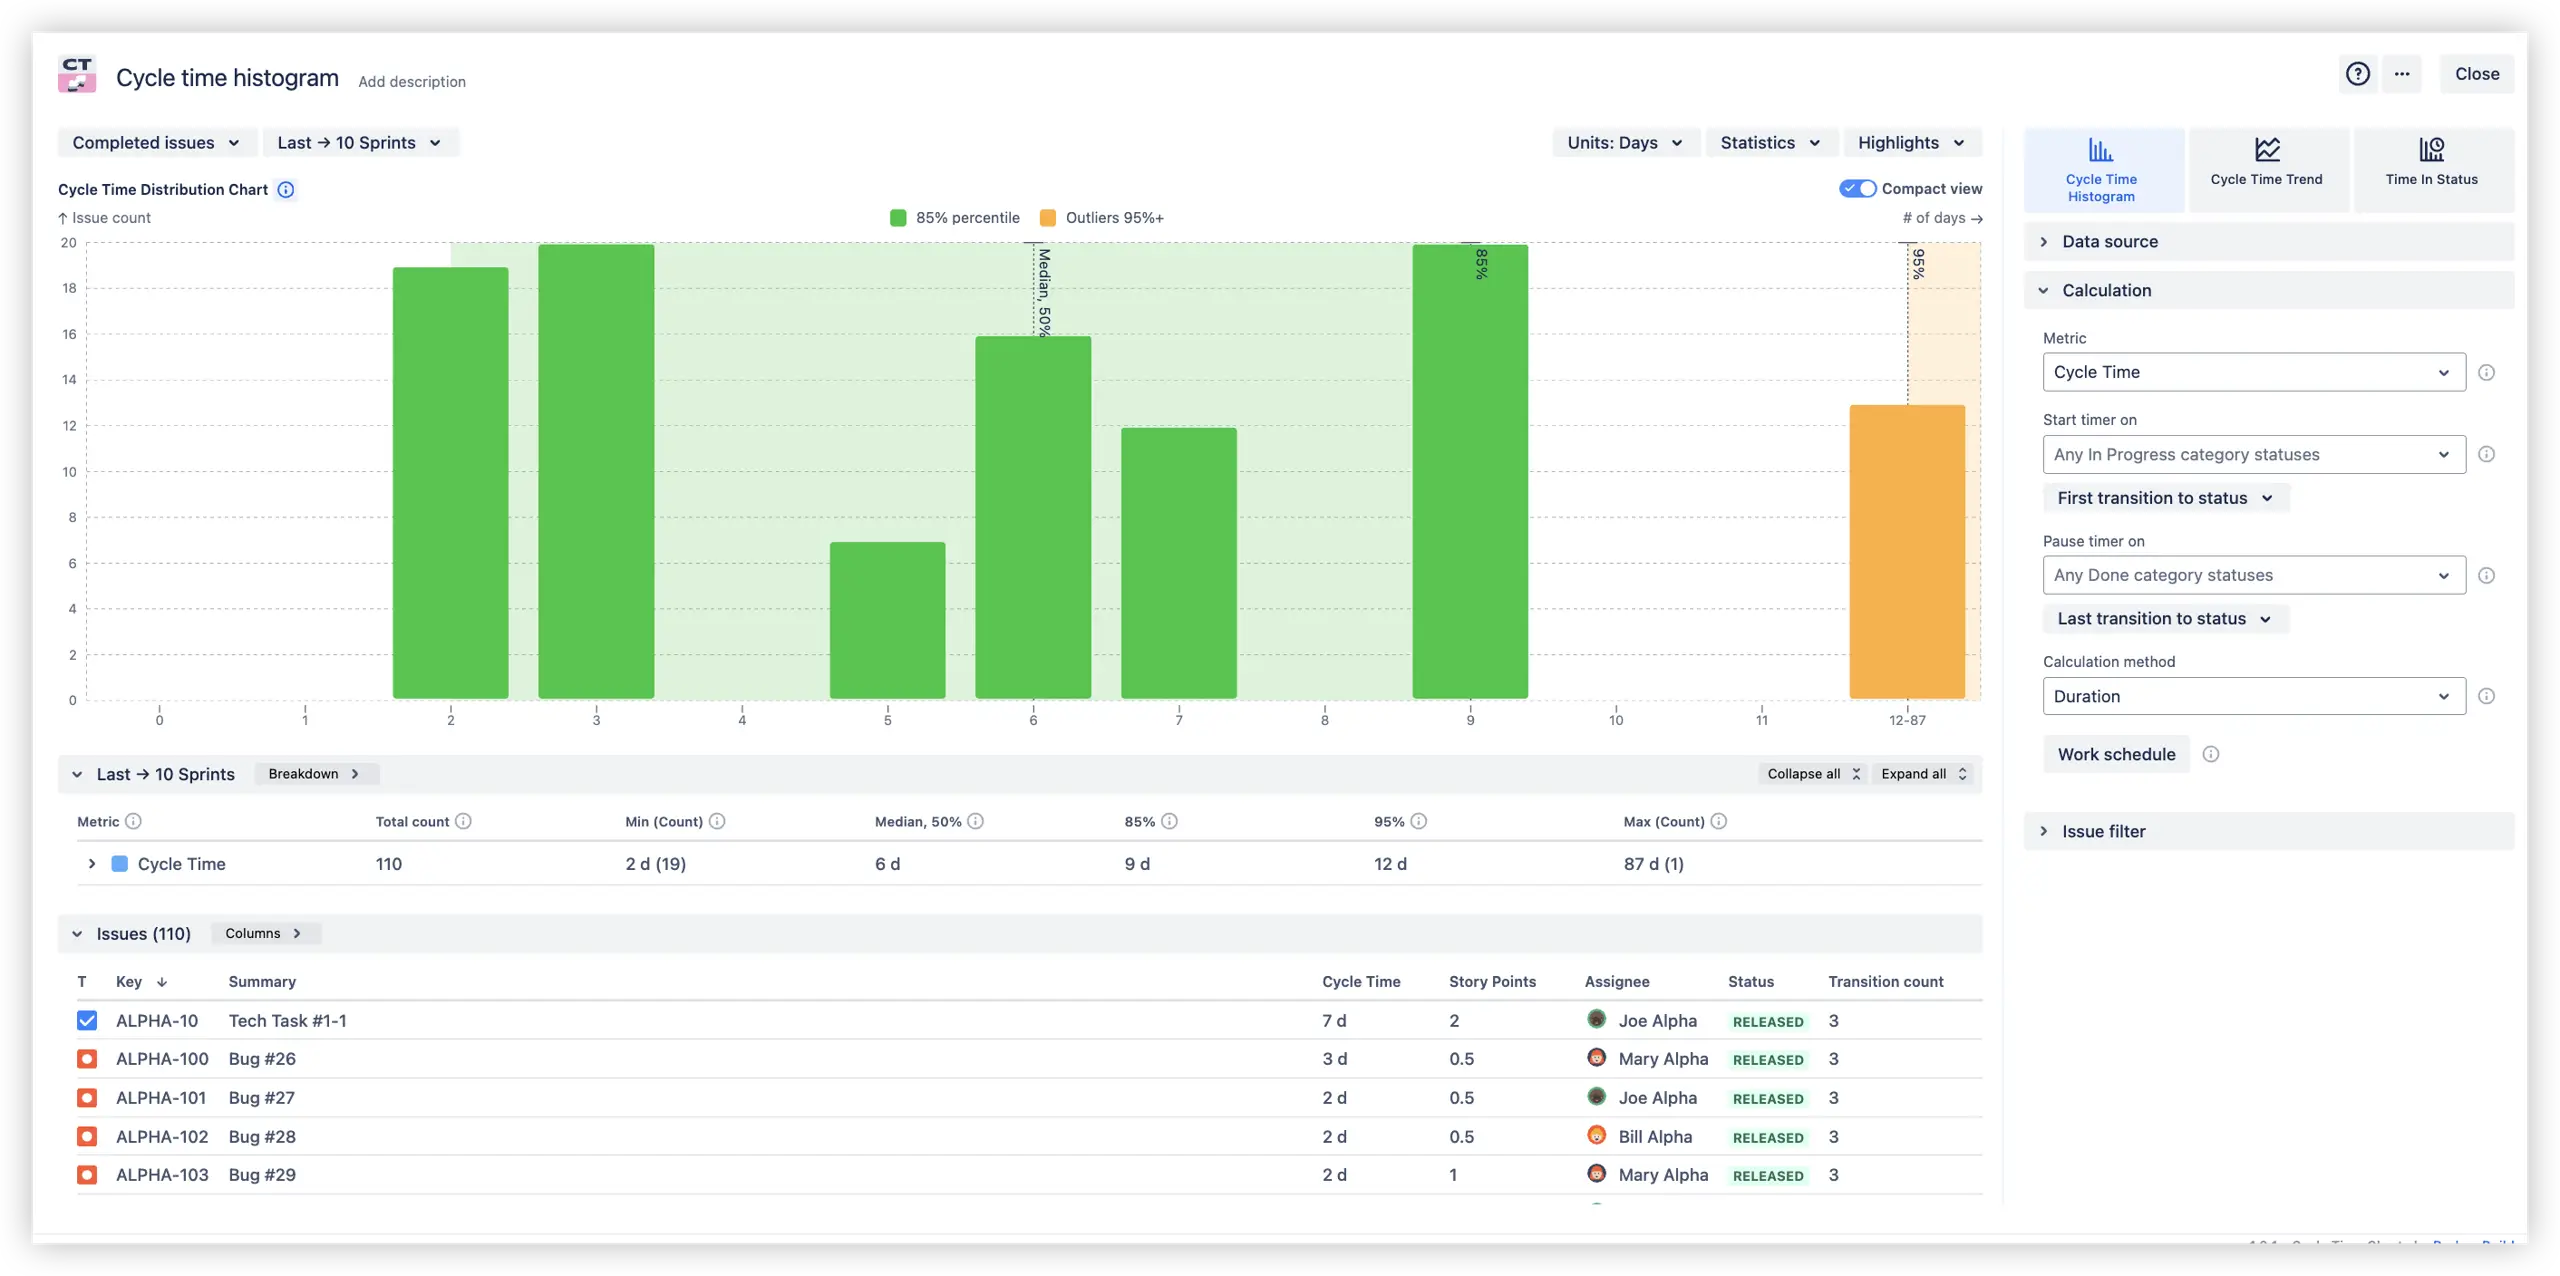
- Cycle Time Histogram shows how long work typically takes by grouping completed issues by time-based bins (e.g., days, weeks, bi-weeks). It helps Agile teams quickly spot delivery patterns, detect outliers, uncover hidden delays, and track consistency using percentiles (50th, 85th, 95th, or custom). Ideal for defining realistic KPIs based on actual performance:
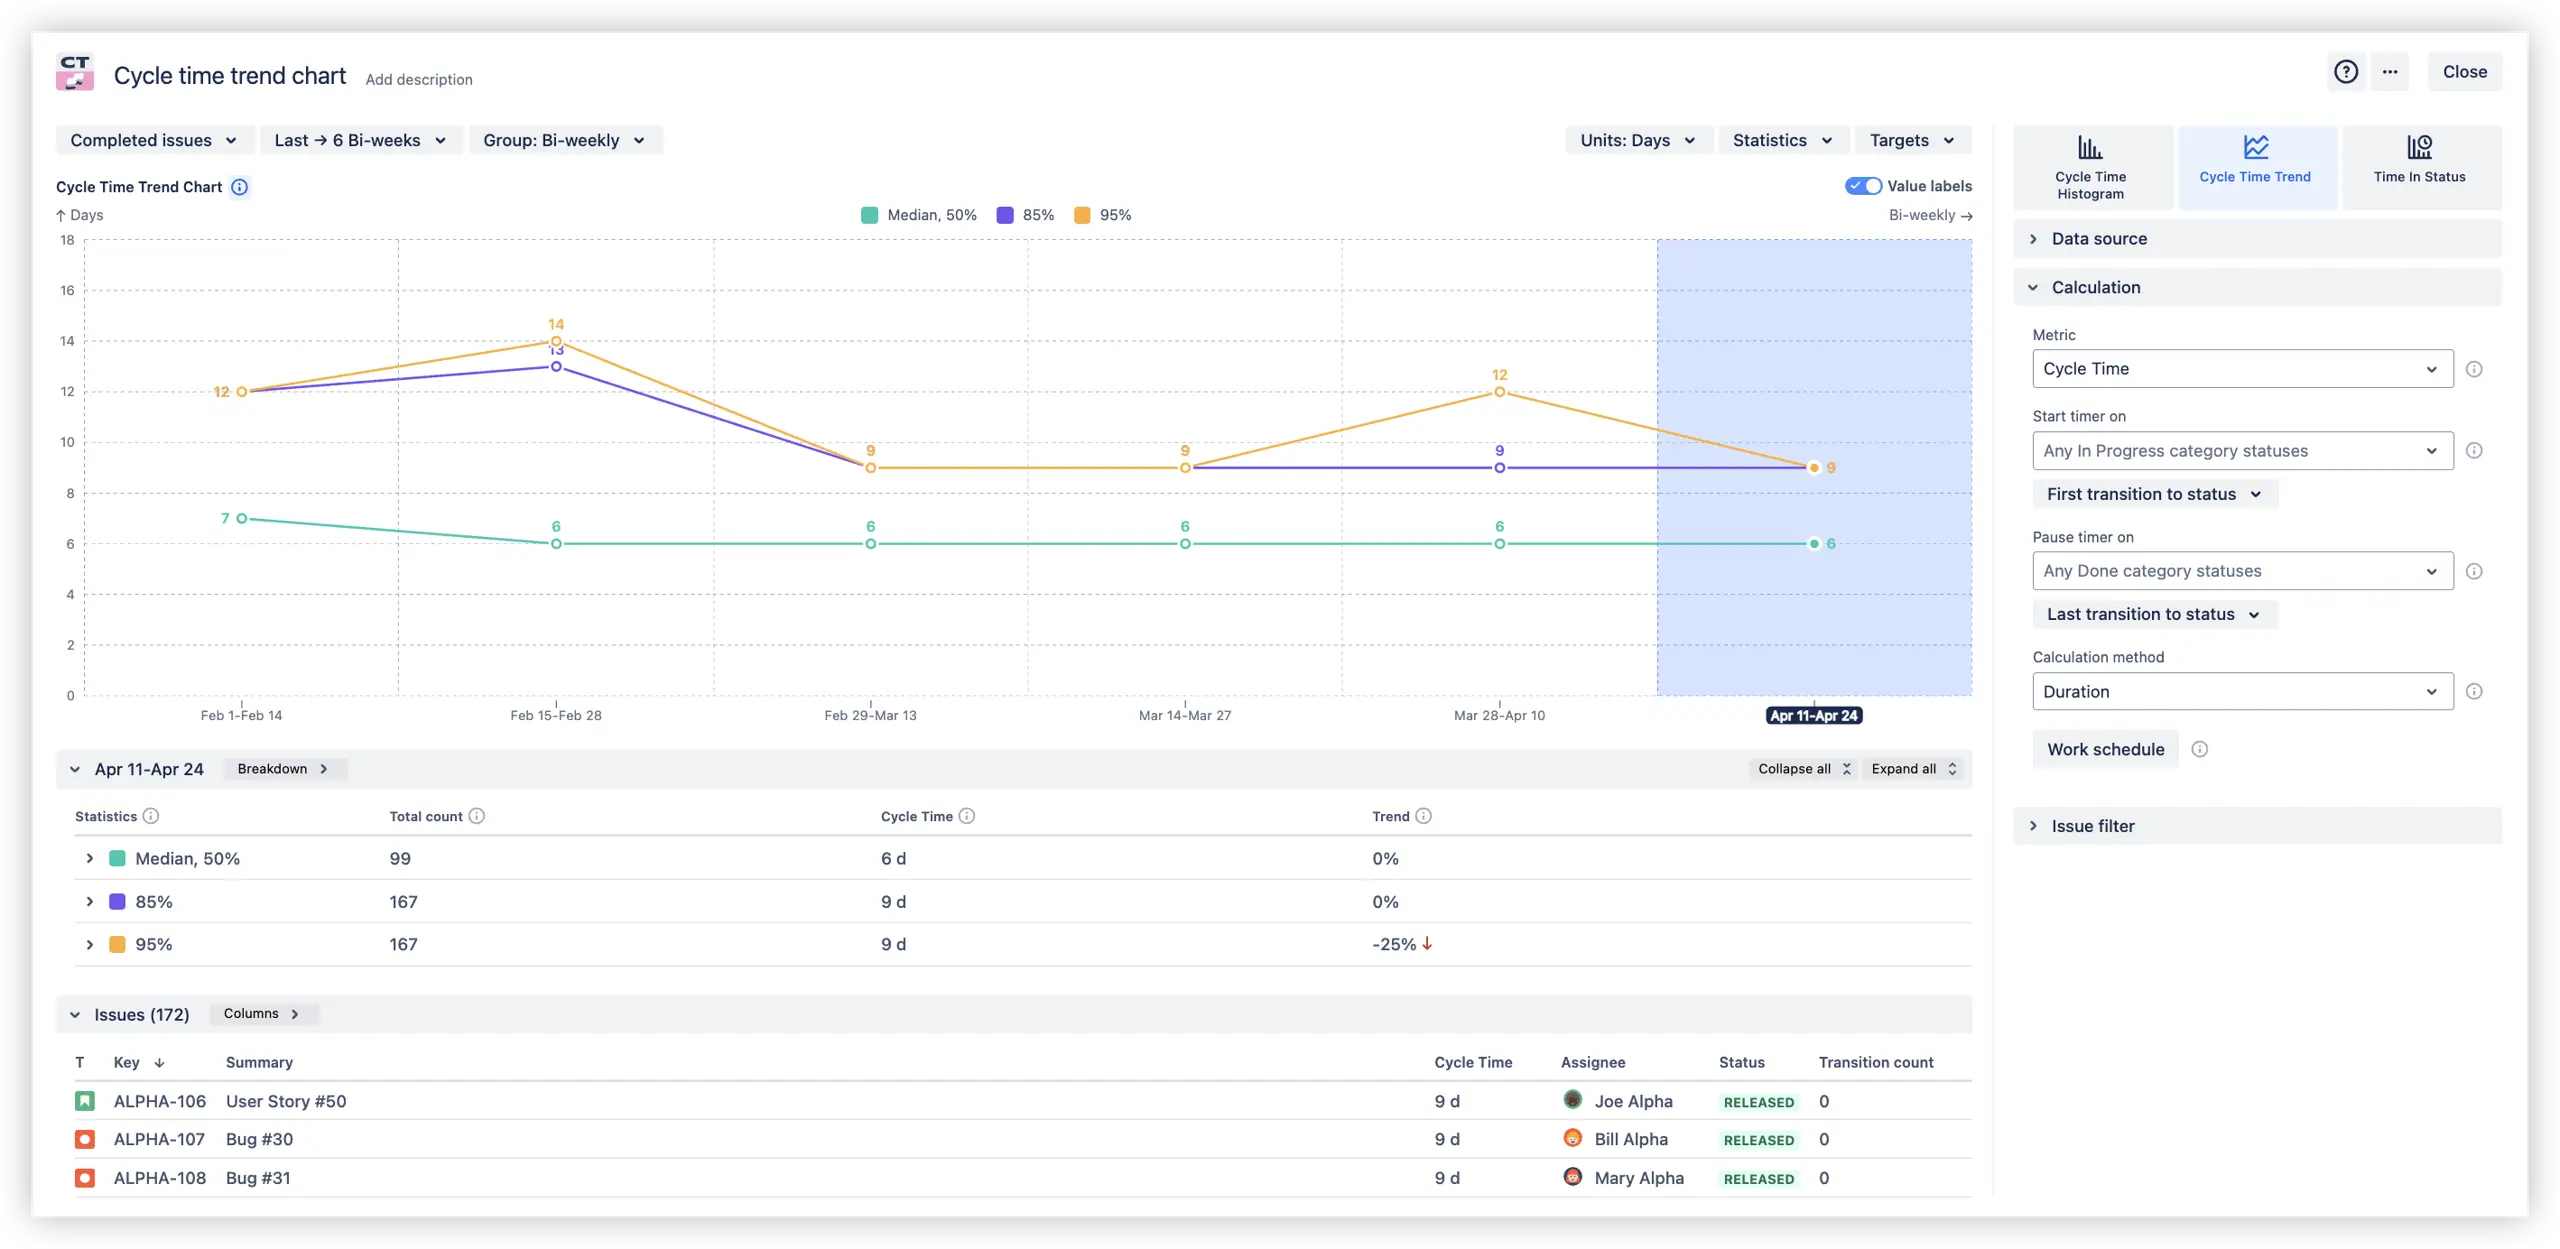
- The Cycle time trend chart shows how your team’s delivery speed changes over time, making it easy to spot trends, evaluate the impact of process changes, and catch early warning signs before they become problems. By tracking median, 85th, 95th or custom percentile cycle times across sprints or intervals, teams can monitor delivery performance, support data-driven retrospectives, and forecast future work more accurately based on real historical trends:
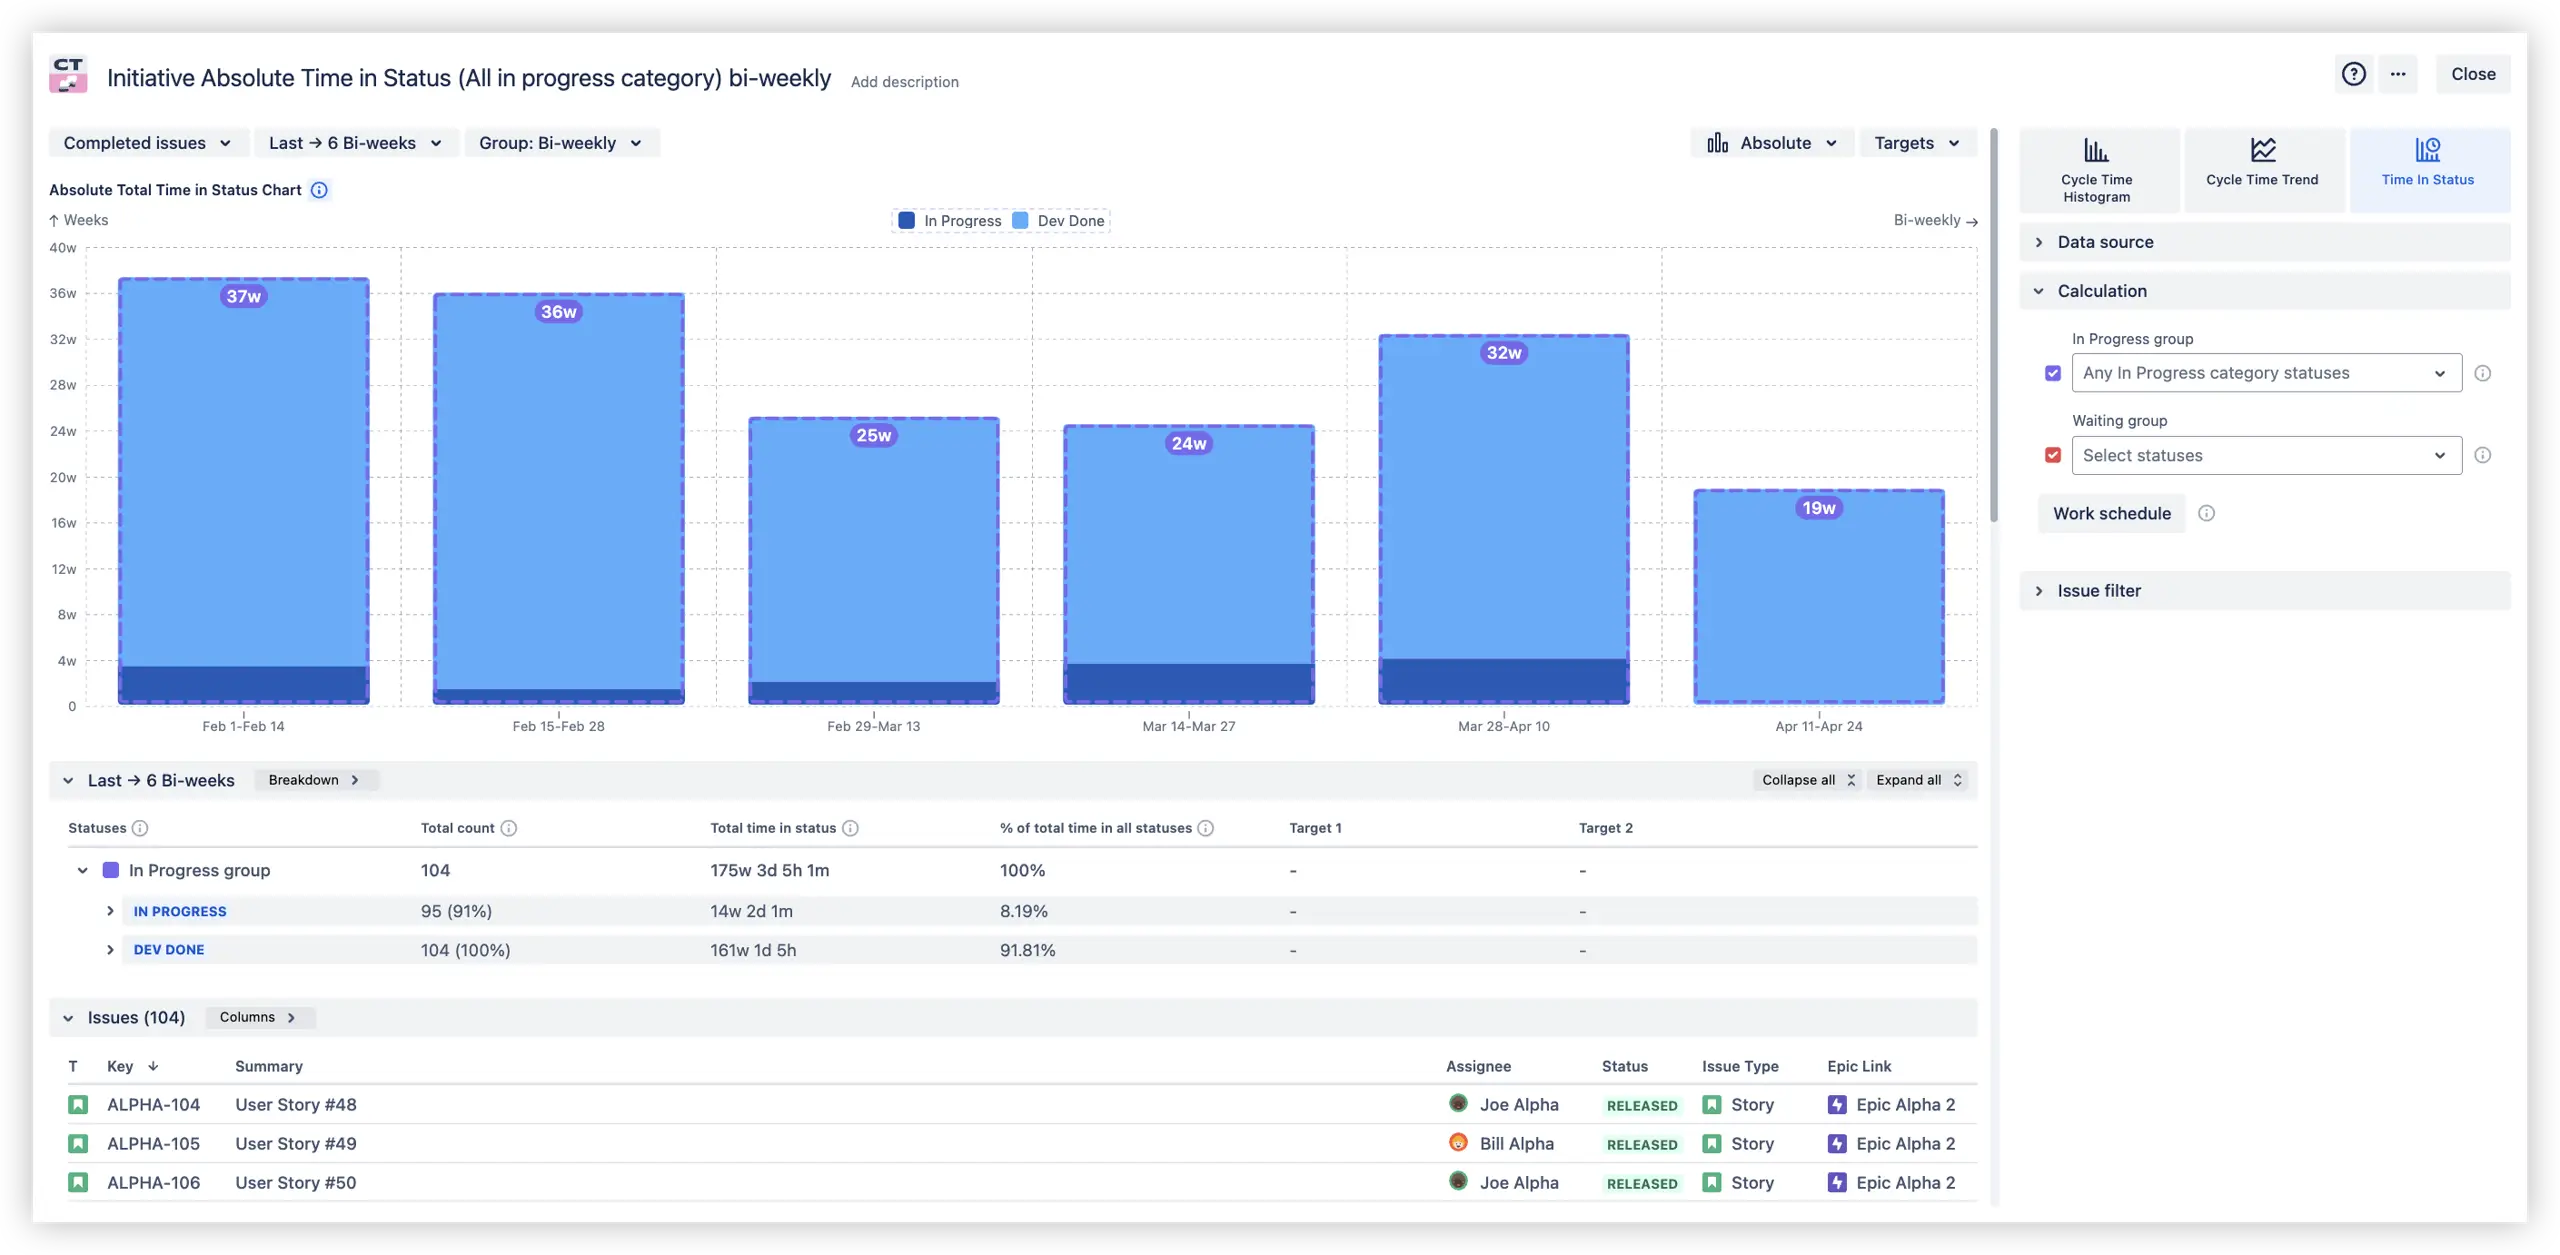
- Time in Status chart provides a clear, detailed view of how long completed issues spend in each workflow status, helping teams understand where delays accumulate and how efficiently work moves through the process. With custom status grouping, you can tailor the report to match your workflow categories (e.g., "In Progress" vs "Waiting").
The report supports hierarchical drill-down - from status groups to individual assignees - and includes flexible issue tables with columns like transition count, status, assignee, priority, and more. Multiple chart views (absolute, ratio, average) make it easy to analyze bottlenecks from every angle:
📊You can also dive into live, clickable examples of:
- Cycle time histogram
- Cycle time trend chart
- Time in status chart
- Cycle time across releases
- Epic time in status graph
Open settings to adjust filters, test different configurations, and see how your data transforms in real time.
Lead time chart features
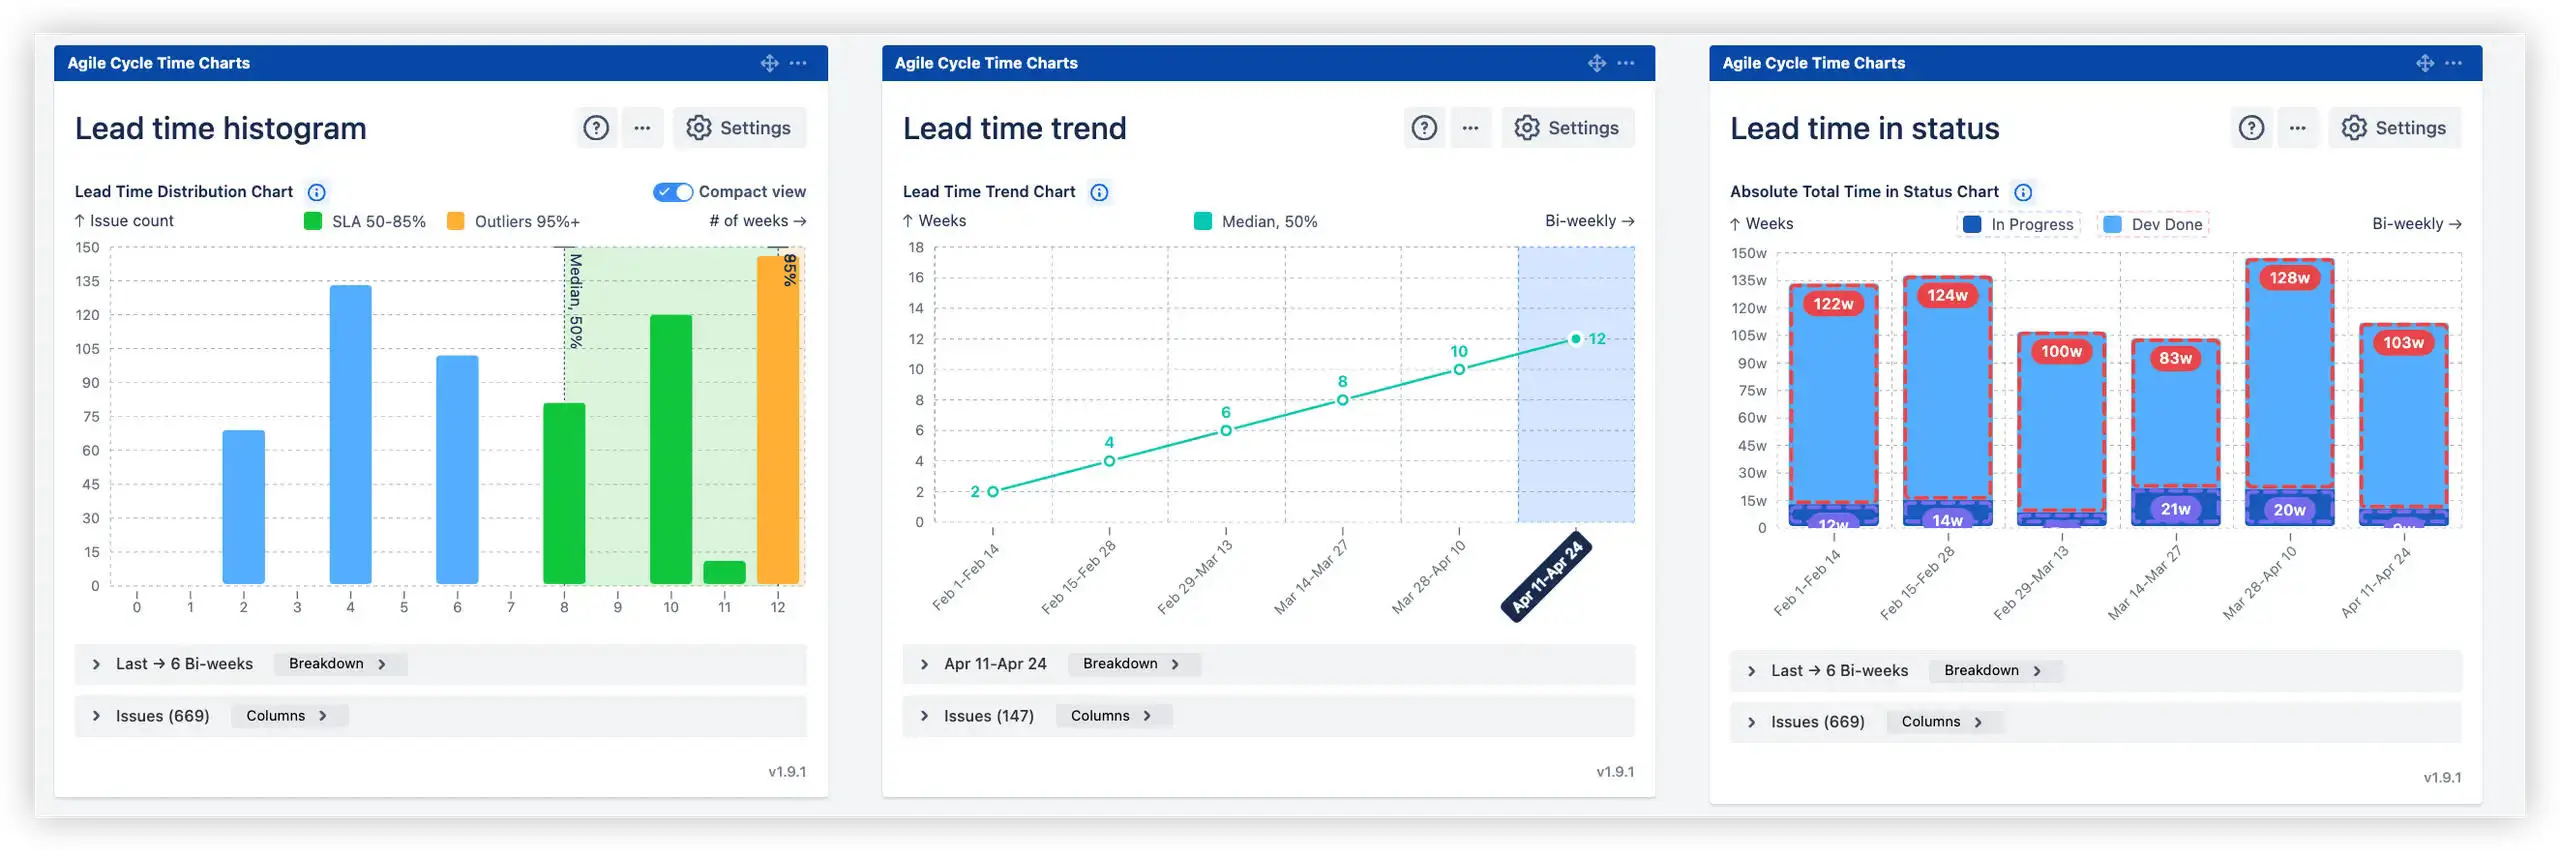
Lead Time Chart offers the same powerful visualizations as the Cycle Time Chart - including Histogram, Trend, and Time in Status. The key difference lies in how time is calculated: it’s based on Lead Time, measuring the full journey from issue creation to final delivery, rather than starting from when work begins.
This makes the Lead time chart especially useful for teams who need to:
✅ Tracking true end-to-end delivery time - from the moment an issue is created to when it’s completed.
✅ Detecting delays before work officially starts, such as backlog stagnation or unclear prioritization.
✅ Setting realistic customer-facing SLAs using lead time percentiles grounded in historical data.
✅ Spotting variability across the entire delivery lifecycle, not just active development stages.
✅ Understanding the full delivery journey, not just time spent in status or active work phases.
👉 Explore an interactive Lead time histogram example and Lead time across releases example to learn more about the full feature set of Lead time charts - including Trend, Time in Status, and practical use cases.
How to reduce Cycle and Lead time with Agile practices
Agile is a flexible project management approach that emphasizes adaptability and collaboration. It helps teams respond quickly to changing needs and deliver work in short, iterative cycles. Instead of following a fixed plan, Agile focuses on continuous improvement and teamwork.
✅ Key values of Agile Methodologies:
- Individuals and interactions over processes and tools
- Working solutions over complex documentation
- Customer input over contract negotiation
- Flexibility over rigid plans
Struggling with long lead times or inconsistent delivery? Softgile’s Agile consulting services are designed to identify bottlenecks, improve team velocity, and tailor your Jira setup to your actual workflow.
These Agile practices help teams deliver high-quality features more quickly and increase overall customer satisfaction.
Sprint planning and iterative development
Agile begins with concrete planning to keep teams aligned and adaptable. Before each sprint, teams define clear goals by breaking larger tasks into smaller, manageable pieces that can be completed within the sprint.
Agile uses an iterative approach, delivering functional parts of the product in each sprint instead of waiting for a full release. This allows for regular testing and ongoing improvements.
Daily stand-ups and ongoing feedback
Daily stand-ups (or Scrums) give each team member a chance to quickly share:
- What they accomplished yesterday
- What they’re working on today
- Any obstacles they’re facing
These brief check-ins help surface issues early and maintain speed. Agile also encourages continuous feedback from stakeholders and users, allowing teams to adapt in real time.
Prioritized product backlog
To help your team stay focused and deliver the most valuable work first, keep your product backlog well-prioritized and aligned with your roadmap. Regularly review items based on customer value, business goals, urgency, and technical complexity.
Use simple Agile methods like MoSCoW (Must have, Should have, Could have, Won’t have) to categorize tasks and guide decisions. Involve both the team and stakeholders in these discussions to ensure alignment and adaptability. It keeps your team focused on high-impact work, streamlines sprint planning, and speeds up delivery.
Kanban training for teams
To support successful Agile adoption, Kanban training helps teams visualize their workflow, manage priorities, and improve delivery speed. It enhances collaboration and transparency across projects.
Softgile, an Atlassian Platinum Solution Partner, provides certified Kanban training from Kanban University combined with hands-on Agile consulting to help your team work more efficiently and deliver better results. To learn more, contact the Softgile team.
Wrap-up: Explore Lead time and Cycle time for Agile success
Understanding and tracking both lead time and cycle time in Agile are essential for teams striving to deliver value efficiently and predictably. While lead time offers a big-picture view of the total delivery process, from request to completion, cycle time zeroes in on the active work phase, highlighting opportunities to improve team efficiency and eliminate bottlenecks. By combining these insights with Agile practices, teams can optimize workflows, accelerate delivery, and better meet customer expectations.


.png)